Uncharted Waters: A Behind the Scenes Look at the Struggle to Kill the Deepwater Horizon Oil Spill
April 12, 2013

Peter Flemings was on a family vacation hiking in the White Mountains in New Hampshire when his cell phone rang. It was U.S. energy secretary Stephen Chu’s assistant. Could he join a web conference with Secretary Chu, and dozens of scientists from government, academia and industry, in a few hours? After packing up and making his way to a coffee shop with wireless access, Flemings found himself on an elite scientific team advising Chu and others in their battle to contain the Deepwater Horizon oil spill.
“That was the end of my vacation,” says Flemings, professor and research scientist at The University of Texas at Austin’s Jackson School of Geosciences.
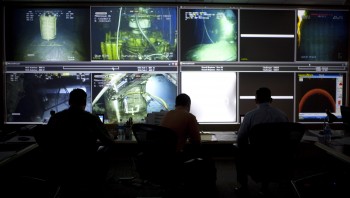
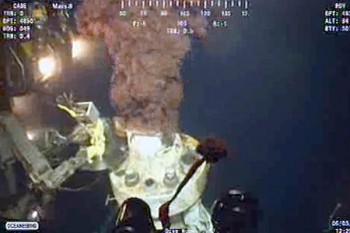
Almost immediately, Flemings was swept up in a relentless series of high-level web conferences every few hours. And within a couple of days, he was at the nerve center for an unprecedented combined response from BP, the federal government and academia. The hub of activity, at one of BP’s facilities in Houston, was the HIVE—Highly Immersive Visualization Environment—a large space some have compared to NASA’s Mission Control. The room had big screen TVs everywhere showing positions of about 20 ships, rigs and remotely operated vehicles (ROVs) working in the vicinity of the well, live views of the gusher from near the seafloor, and media coverage.
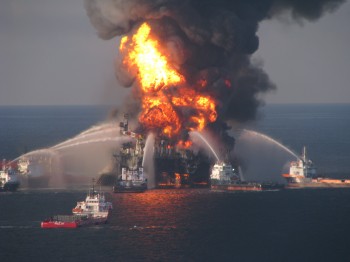
In the weeks following the April 20, 2010 blowout, BP had tried two elaborate strategies to bring the Macondo well under control—a massive containment dome and a so-called top kill—but both ended in failure. Tens of thousands of barrels of oil were still spewing into the Gulf of Mexico each day when Flemings joined the Well Integrity Team in mid-July.
BP was anxious to cap the top of the well, but what kept the experts up at night was the possibility that either the pipe had already burst somewhere underground during the initial blowout or that if they now bottled up the gusher at the seafloor, the pipe would burst. Either way, it would be like performing a hydraulic fracture on the surrounding geologic formation, in much the same way that drillers fracture shale formations to liberate oil and gas. If you thought containing a gusher from the top of a wellhead under more than a kilometer of water was hard, try containing it under more than a kilometer of water AND buried deep underground. Some members of the team even feared that an underground blowout could cause the sediments around the wellhead to liquefy and the entire wellhead to disappear into the seafloor.
So this is the dilemma the team had to resolve: could you cap the well and if so, how would you know, as the hours and then days went by, if it was safe to keep it plugged?
The team decided BP could cap the well temporarily—no permanent damage was likely in the first few hours—and then devised a simple little test involving one number to ensure the well was not in danger of an underground blowout—a simple little test that ultimately left them scratching their heads.
Purgatory
Just after noon on July 15, BP workers instructed an ROV to begin closing the valves on a newly installed “capping stack”— essentially a second blowout preventer—atop the original, failed blowout preventer. You might remember from news accounts that the blowout preventer contained sharp teeth designed to automatically shear the metal pipe at the top of the well and clamp it shut in case of a blowout. Had the original blowout preventer worked, there would have been no oil spill. Now, as the valves on the second blowout preventer were shutting, sensors recorded rising pressures inside the wellhead.

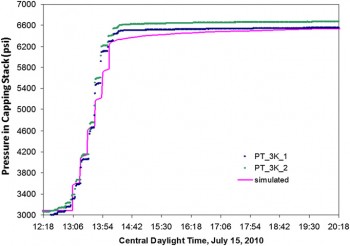
To evaluate whether the well was in good enough shape to withstand being plugged up, the team proposed a simple test: If pressures rose above 7,500 pounds per square inch (psi), then the well was probably intact and could be shut in for at least 48 hours. If, on the other hand, the pressures measured inside the wellhead stayed below 6,000 psi, oil and gas was probably leaking into the geologic formation. In that case, the well should be reopened immediately.
After a couple of hours, the valves stopped turning. For the first time in nearly three months, no oil flowed into the Gulf. Soon after, the pressures leveled off at around 6,600 psi, about the most ambiguous number they could have imagined. What on Earth did it mean? The experts found themselves in a kind of purgatory.
“My first reaction was … now what do we do?,” recalls Flemings. “It would have been great if it were here or here, it would be obvious. Now we’re in the middle. I think that’s more or less how everybody felt.”
The team agreed that the well could stay safely shut in for 24 hours, but beyond that, if they couldn’t be sure the well was sound, they would need to reopen it. Before that deadline, three starkly different interpretations of the anomalous pressures arose.
Paul Hsieh, a hydrologist with the US Geological Survey (USGS), used a hydrologic model to simulate how the pressures should build up in the well for the first six hours after shut in if it had full integrity. The simulated pressure curve was remarkably similar to the actual pressures observed at the wellhead. This suggested the well was in fact sound. Meanwhile, representatives from BP also now believed the well was intact, but that the reservoir, which had disgorged millions of barrels of oil, was more depleted than previously thought. Still others on the team felt the best explanation for the anomalous pressures was an underground leak.
Balancing these different possibilities, Secretary Chu decided the shut in could continue past the initial 24 hours, but with a full review of the latest data every six hours. Several geophysical tests, including a continuous series of seismic profiles and sonar surveys, were begun to monitor the area for signs of underground leakage.
Over the second 24 hours, the experts were faced with a new dilemma. The USGS hydrologic model said pressures should be rising significantly, yet the observed pressures were only creeping up slightly. This growing divergence renewed fears that an underground leak was bleeding off some of the pressure.

Flemings sat down with BP’s experts and went back over all of their seismic data, well logs and computer models. He concluded that the way the reservoir was represented in the USGS model, basically a thick square block of sand, was too simplified.
“Their models were based on a square sandbox,” he says. “The reservoir is not a sandbox, it’s much longer than it is wide and cigar shaped and made up of different sand channels that don’t necessarily touch each other.”
When the reservoir in the USGS model was revised to reflect this new interpretation, the simulated and observed pressures were again in lockstep. There was also encouraging news from the ongoing geophysical monitoring.
Comparing seismic profiles first taken before shut in and then several times a day thereafter, Flemings and other government and industry scientists could scan for signs that brine in the surrounding sand had been replaced by hydrocarbons. He and Hsieh also made predictions of how small an oil slick would have to be to go undetected in the seismic data. So as each day went by with no sign of a leak, it meant the flow rate of a hypothetical leak would have to be smaller and smaller to “fly under the radar”—or seismic, as it were. After several days of shut in, neither the seismic profiles nor a series of sonar surveys showed signs of leakage.
Within about a week of the shut in, the team was feeling pretty confident that there was in fact no underground blowout, the well was structurally sound, and that BP’s alternate explanation for the unusually low pressures—that the reservoir was depleted—was likely correct. Eventually, the entire team came to agree. The well was finally under control.
Flemings’ combination of expertise in stratigraphy, pore pressure, drilling and seismic data interpretation might seem a bit esoteric, but it made him a good fit for this particular disaster.
“How many times do you get called up because you have just the right expertise to help with a true crisis in real time?,” he says. “I don’t think it will happen again in my lifetime.”
Afterlife
On August 3, nearly three weeks after the well was shut in, BP began pumping mud—and then later cement—down the well in a process known as a top kill. BP finished cementing the inner bore of the well the next day. Because the well is essentially a set of pipe inside another set of pipe, there is also an outer bore space between the two sets of pipe. In mid-September, a relief well intercepted the Macondo well much farther down and BP injected cement into the outer bore, permanently sealing off the reservoir.
While it’s still too early to assess the full toll of the world’s largest marine oil spill—about 5 million barrels of oil were released into the Gulf—it clearly had an impact on fishermen and on coastal communities that rely on tourism, not to mention marine and coastal ecosystems.

According to the National Oceanic and Atmospheric Administration, 1,100 miles of shoreline were oiled, including coastal wetlands. In a study released last year in the Canadian Journal of Fisheries and Aquatic Sciences, researchers estimated that over the coming seven years, the spill would cost the Gulf fishing industry about $8.7 billion. In October 2010, scientists with the non-profit Ocean Foundation estimated that populations of commercially important juvenile bluefin tuna were reduced by 20 percent in the months following the spill. And just this month, the National Wildlife Federation released a study highlighting some of the environmental impacts, including an unusually high number of dolphin and sea turtle strandings, including the endangered Kemp’s ridley sea turtle.
Still, the impact might have been much worse if not for naturally-occurring bacteria that broke down some of the oil and gas and favorable winds and currents, all of which kept a significant amount of oil from reaching the shore.
Flemings is grateful that members of the public now understand what’s involved in drilling ever deeper for oil.
“The average person came to understand the conditions under which industry goes to get the oil and what can go wrong,” he says. “We’re drilling 30,000 feet below the seafloor and, in some cases, underneath 10,000 feet of water. Before this accident, the average person had no idea what that meant.”
by Marc Airhart
Further Reading:
Scientific basis for safely shutting in the Macondo Well after the April 20, 2010 Deepwater Horizon blowout, PNAS, December 3, 2012
Deep Water: The Gulf Oil Disaster and the Future of Offshore Drilling (full report of the National Commission on the BP Deepwater Horizon Oil Spill and Offshore Drilling), January 11, 2011
Application of MODFLOW for Oil Reservoir Simulation During the Deepwater Horizon Crisis, Groundwater, May/June 2011
