
Mapping Austin Heat
October 29, 2021

Austin has hot summers. But that heat isn’t felt the same way across the city, as anyone who has sweltered in a parking lot or cooled off beneath a tree knows.
The University of Texas at Austin is partnering with the City of Austin, community groups and East Austin residents to find out where hot temperatures are affecting people the most — and proposing solutions to cool down these places.
UT is one of four institutions selected by the National Oceanic and Atmospheric Administration to lead research projects focused on combating extreme heat in urban environments.
“This helps business and communities, and it is helping students to develop a purpose for their research,” said project lead Dev Niyogi, a professor at the Jackson School of Geosciences and the Cockrell School of Engineering. “They are not simply trying to develop an analysis or a plot. It’s a project where what we do means a better life for someone, if we do this right.”
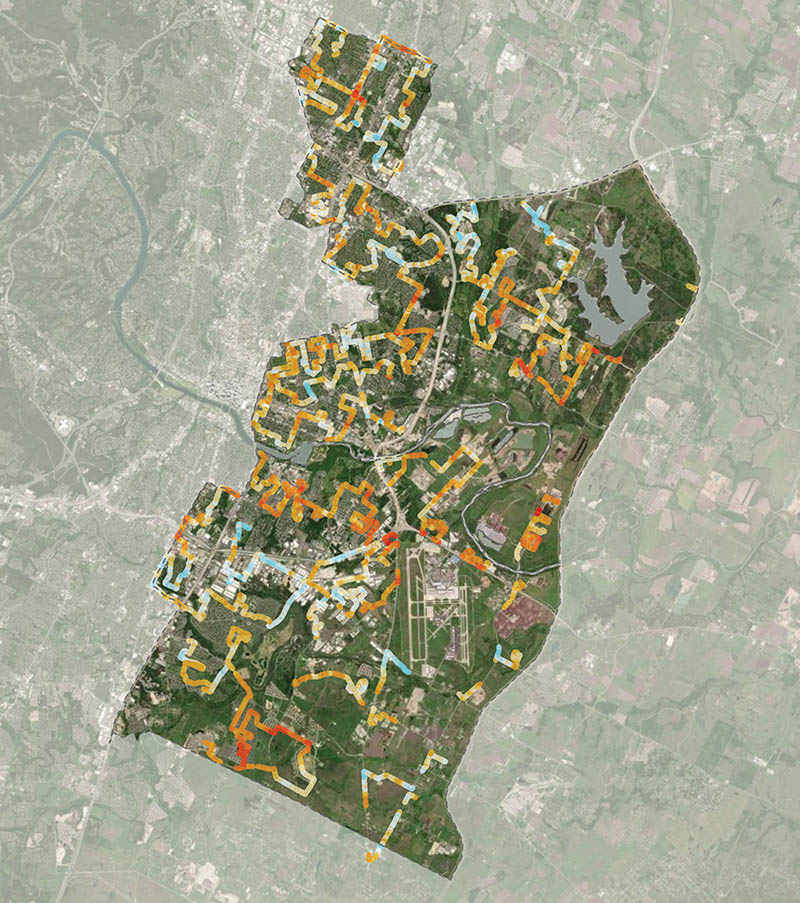
The two-year project builds on an Austin heat map created by the CAPA Heat Watch program last year and has three main goals: creating dynamic heat maps that depict how people experience the heat alongside actual temperature measurements; using those maps to develop strategies to cool down temperature hot spots; and, finally, presenting the data and potential solutions to community members and city decision makers.
The temperature map will include the entire city, but the project team will focus on collecting public input and making improvements in East Austin, where residents encounter hot spots more frequently.
To make sure temperature readings and community experiences are aligned, the project team will incorporate resident input from the very beginning, engaging in discussions about temperature hot spots in their communities and receiving feedback on temperature maps.
There are a number of ways to reduce heat in specific areas, from adding greenery to installing light-colored pavement. To make sure any proposed solutions hold up over time, the researchers will investigate how potential improvements will affect local temperatures in coming decades.
Back to the Newsletter