
A 3-D View of the Greenland Ice Sheet
October 22, 2015
Surface & Hydrologic Processes
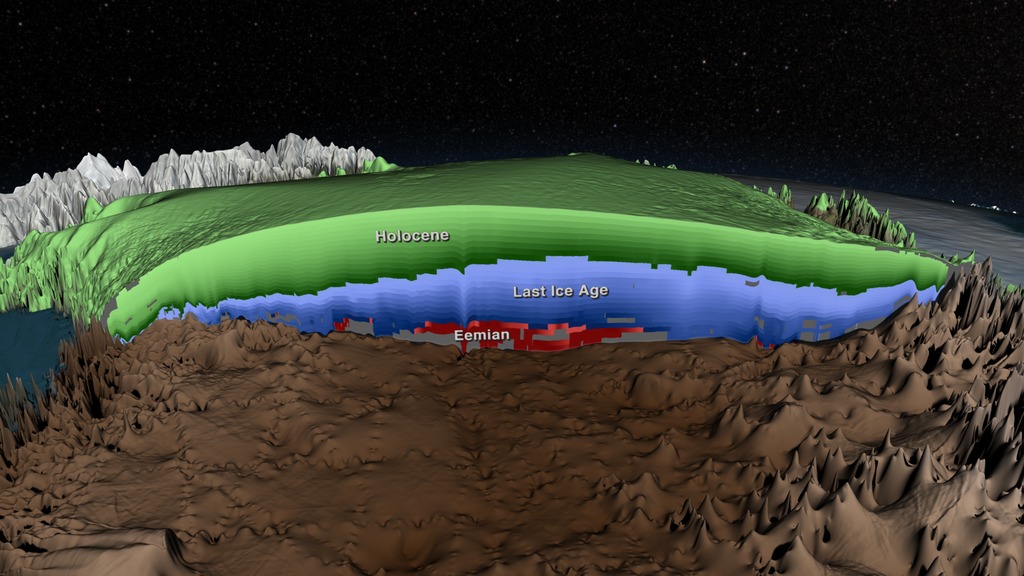
Scientists using ice-penetrating radar data collected by NASA’s Operation IceBridge and earlier airborne campaigns have built the first comprehensive 3-D map of layers deep inside the Greenland ice sheet, opening a window on past climate conditions and the ice sheet’s potentially perilous future.
This new map allows scientists to determine the age of large swaths of the second largest mass of ice on Earth, an area containing enough water to raise ocean levels by about 20 feet. This study was published online on Jan. 16, 2015, in Journal of Geophysical Research: Earth Surface.
“This new, huge data volume records how the ice sheet evolved and how it’s flowing today,” said Joe MacGregor, the study’s lead author and a glaciologist at the Institute for Geophysics.
Greenland’s ice sheet has been losing mass during the past two decades, a phenomenon accelerated by warming temperatures. Scientists are studying ice from different climate periods in the past to better understand how the ice sheet might respond in the future.
Scientists are interested in knowing more about ice from the Eemian period, a time from 115,000 to 130,000 years ago that was about as warm as today. This information will be helpful for evaluating the more sophisticated ice sheet models that are crucial for projecting Greenland’s future contribution to sea-level rise.
Back to the Newsletter