
Frequently Asked Questions (FAQ) – BEG Barnett Shale Assessment Study
February 28, 2013
Who were the team members who conducted this study?
What is the Bureau of Economic Geology?
What are the previous major studies and assessments of natural gas in the Barnett Shale?
What is distinct about this study?
What are the forecasts of the study for production of natural gas from the Barnett Shale?
Where did the production data on the wells come from? Can others obtain it?
When will assessments be available on other major U.S. shale formations?
How many years of supply of natural gas is there in the Barnett Shale?
Why are there more reserves if the price of gas goes up, and fewer if the price goes down?
Has this study been peer-reviewed?
Figures Accompanying the Release and FAQ
Who were the team members who conducted this study?
- Principal Investigator: Scott Tinker, Director, Bureau of Economic Geology, and acting Associate Dean and Professor, Jackson School of Geosciences, The University of Texas at Austin
- Co-Principal Investigator: Svetlana Ikonnikova, Energy Economist, Bureau of Economic Geology, The University of Texas at Austin
- John Browning, Petroleum Engineer, Bureau of Economic Geology, The University of Texas at Austin
- Qilong Fu, Geologist, Bureau of Economic Geology, The University of Texas at Austin
- Gürcan Gülen, Energy Economist, Bureau of Economic Geology, The University of Texas at Austin
- Susan Horvath, GIS Specialist, Bureau of Economic Geology, The University of Texas at Austin
- Frank Male, Graduate Research Assistant, Department of Petroleum and Geosystems Engineering, The University of Texas at Austin
- Ken Medlock III, Energy Economist, James A. Baker Institute for Public Policy, Rice University
- Tad Patzek, Chair, Department of Petroleum and Geosystems Engineering, The University of Texas at Austin
- Eric Potter, Associate Director – Energy Division, Bureau of Economic Geology, The University of Texas at Austin
- Forrest Roberts, Graduate Research Assistant, Jackson School of Geosciences, The University of Texas at Austin
- Likeleli Seitlheko, Graduate Fellow, James A. Baker Institute for Public Policy, Rice University
The team members acknowledge the following people and organizations who contributed valuable suggestions, comments, and editorial help: William L. Fisher, Leonidas T. Barrow Centennial Chair in Mineral Resources, Jackson School of Geosciences, The University of Texas at Austin; Ian Duncan, program director, Vanessa Nunez, research associate, Caroline Breton, research scientist associate, all at the Bureau of Economic Geology, The University of Texas at Austin; Robert Bryce, author, senior fellow, Manhattan Institute; and oil and gas information providers Drilling Info, Inc. and IHS.
The Alfred P. Sloan Foundation. The Sloan Foundation is a philanthropic, not-for-profit grantmaking institution based in New York City. Established in 1934 by Alfred Pritchard Sloan Jr., then-President and Chief Executive Officer of the General Motors Corporation, the foundation makes grants in support of original research and education in science, technology, engineering, mathematics and economic performance. For more information, see About the Sloan Foundation.
What is the Bureau of Economic Geology?
The Bureau of Economic Geology, established in 1909, is the oldest and second largest research unit at The University of Texas at Austin. Part of the Jackson School of Geosciences at The University of Texas at Austin, the Bureau also functions as the State Geological Survey.
The Bureau conducts basic and applied research related to energy resources including oil, natural gas, and coal; mineral resources; coastal processes; Earth and environmental systems; hydrogeology; carbon sequestration; nanotechnology; energy economics; and geologic mapping. The Bureau disseminates scientific knowledge by (1) publishing research results in scientific journals, in Bureau reports, and on the Internet; (2) conducting technology transfer workshops and schools; (3) participating in professional meetings; (4) training undergraduate and graduate students and postdocs by providing hands-on research experience with modern datasets; and (5) promoting K-12 and public outreach.
The Bureau not only curates the largest volume of subsurface core and cuttings in the United States at three world-class centers located in Houston, Austin, and Midland, but also runs a major Texas well log library, with nearly one million well records on file. The Bureau serves as the managing organization for the Advanced Energy Consortium, a major subsurface nanotechnology research organization. Centers include the Gulf Coast Carbon Center and Center for Energy Economics. Bureau reports, maps, and other publications are available online.
What are the previous major studies and assessments of natural gas in the Barnett Shale?
The U.S. Energy Information Agency (EIA) included an estimate of technically recoverable resources in the Barnett in their 2011 “Review of Emerging Resources: U.S. Shale Gas and Shale Oil Plays.”
Other recent studies, mainly consensus views and literature surveys have been conducted by the National Petroleum Council and the Potential Gas Committee.
In 2003, the U.S. Geological Survey published an assessment (updating an earlier assessment from the late 1990s), but this was done before the advent of horizontal drilling had transformed shale gas exploration, and the reserves number has long since been recognized as well below the now estimated ultimate recovery (EUR) for the formation.
What is distinct about this study?
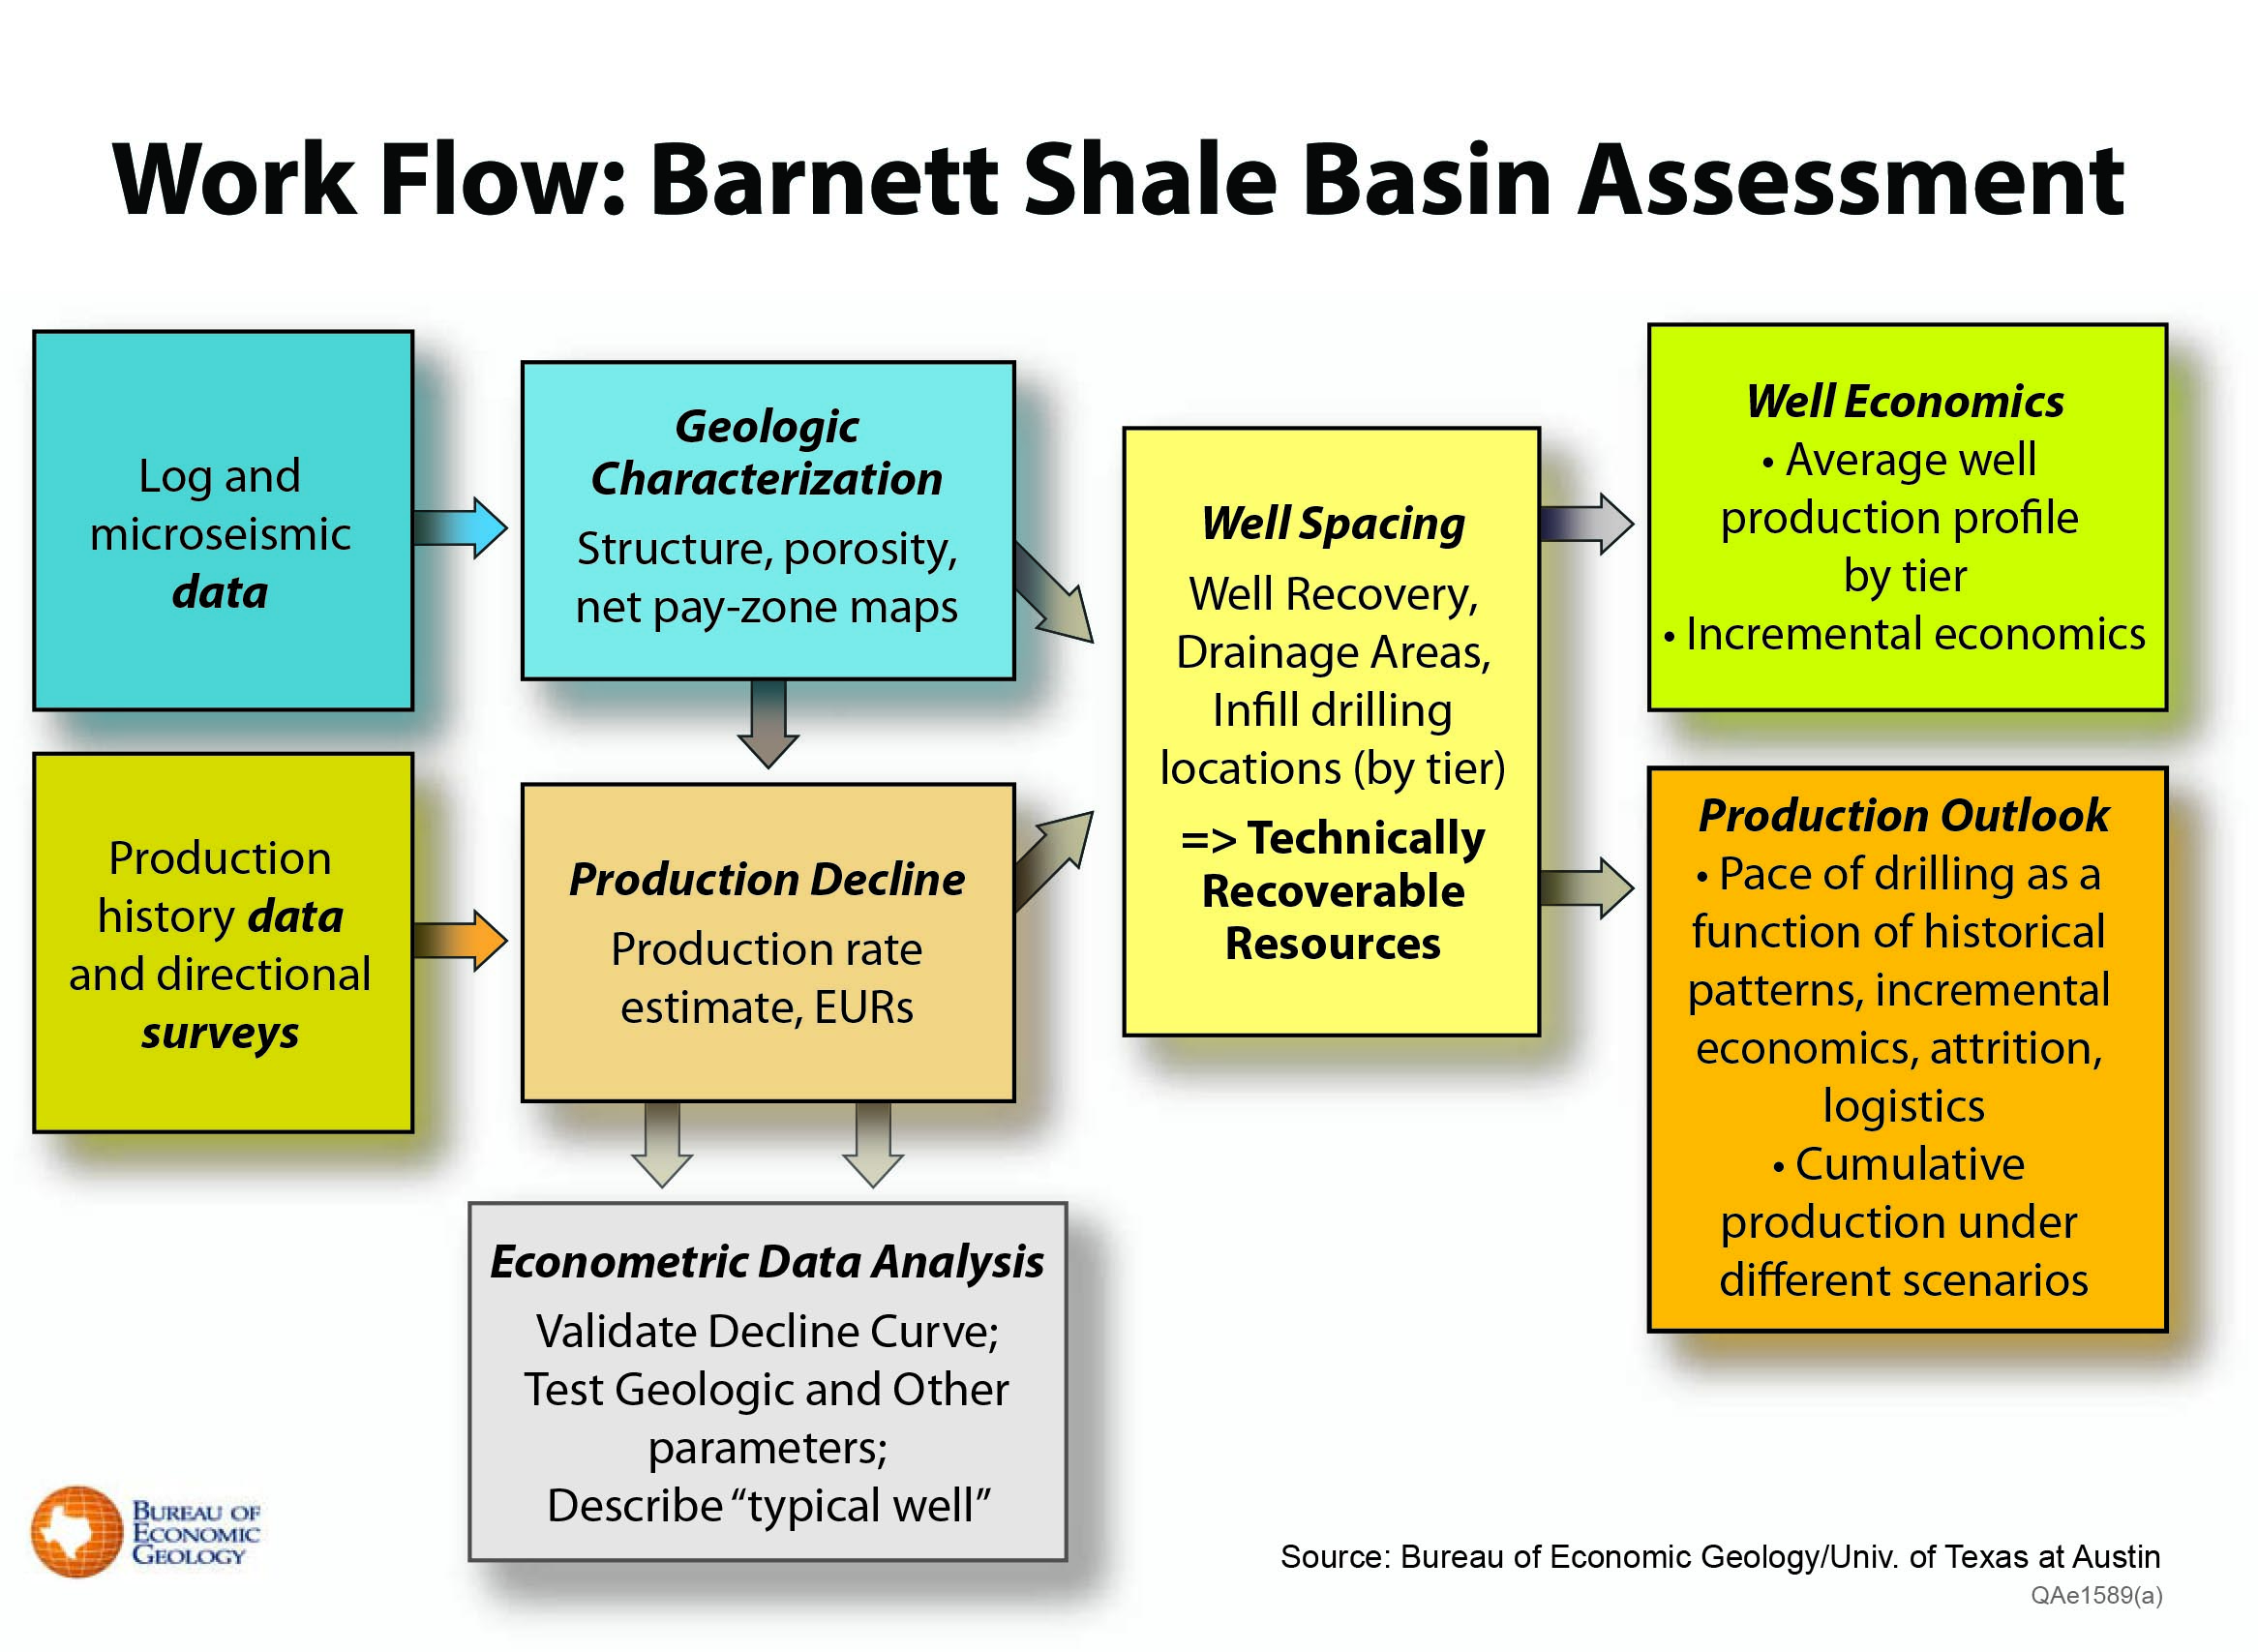
The BEG assessment is an integrated study of the Barnett shale formation, bringing together the best related research in engineering (reservoir engineering, production engineering), geoscience, and economics. Previous assessments of the Barnett and other major shale plays have taken a top-down approach, using averages to estimate the size of the recoverable resource. In contrast, the BEG assessment takes a bottom-up approach, starting with actual production data from each individual well in the formation.
Unique features of the BEG shale gas study:
- Multi-disciplinary collaboration by geologists, engineers and economists creating a cohesive model of the Barnett linking geologic mapping, production analysis, well economics and development forecasting.
- Development led by the Department of Petroleum Geosystems and Engineering of a physics-based decline curve that closely describes Barnett well declines and explains impacts due to interfracture interference late in well life (after year 5).
- Well-by-well analysis of production and calculation of individual well estimated ultimate recovery (EUR) for 16,000+ wells, making use of decline approach.
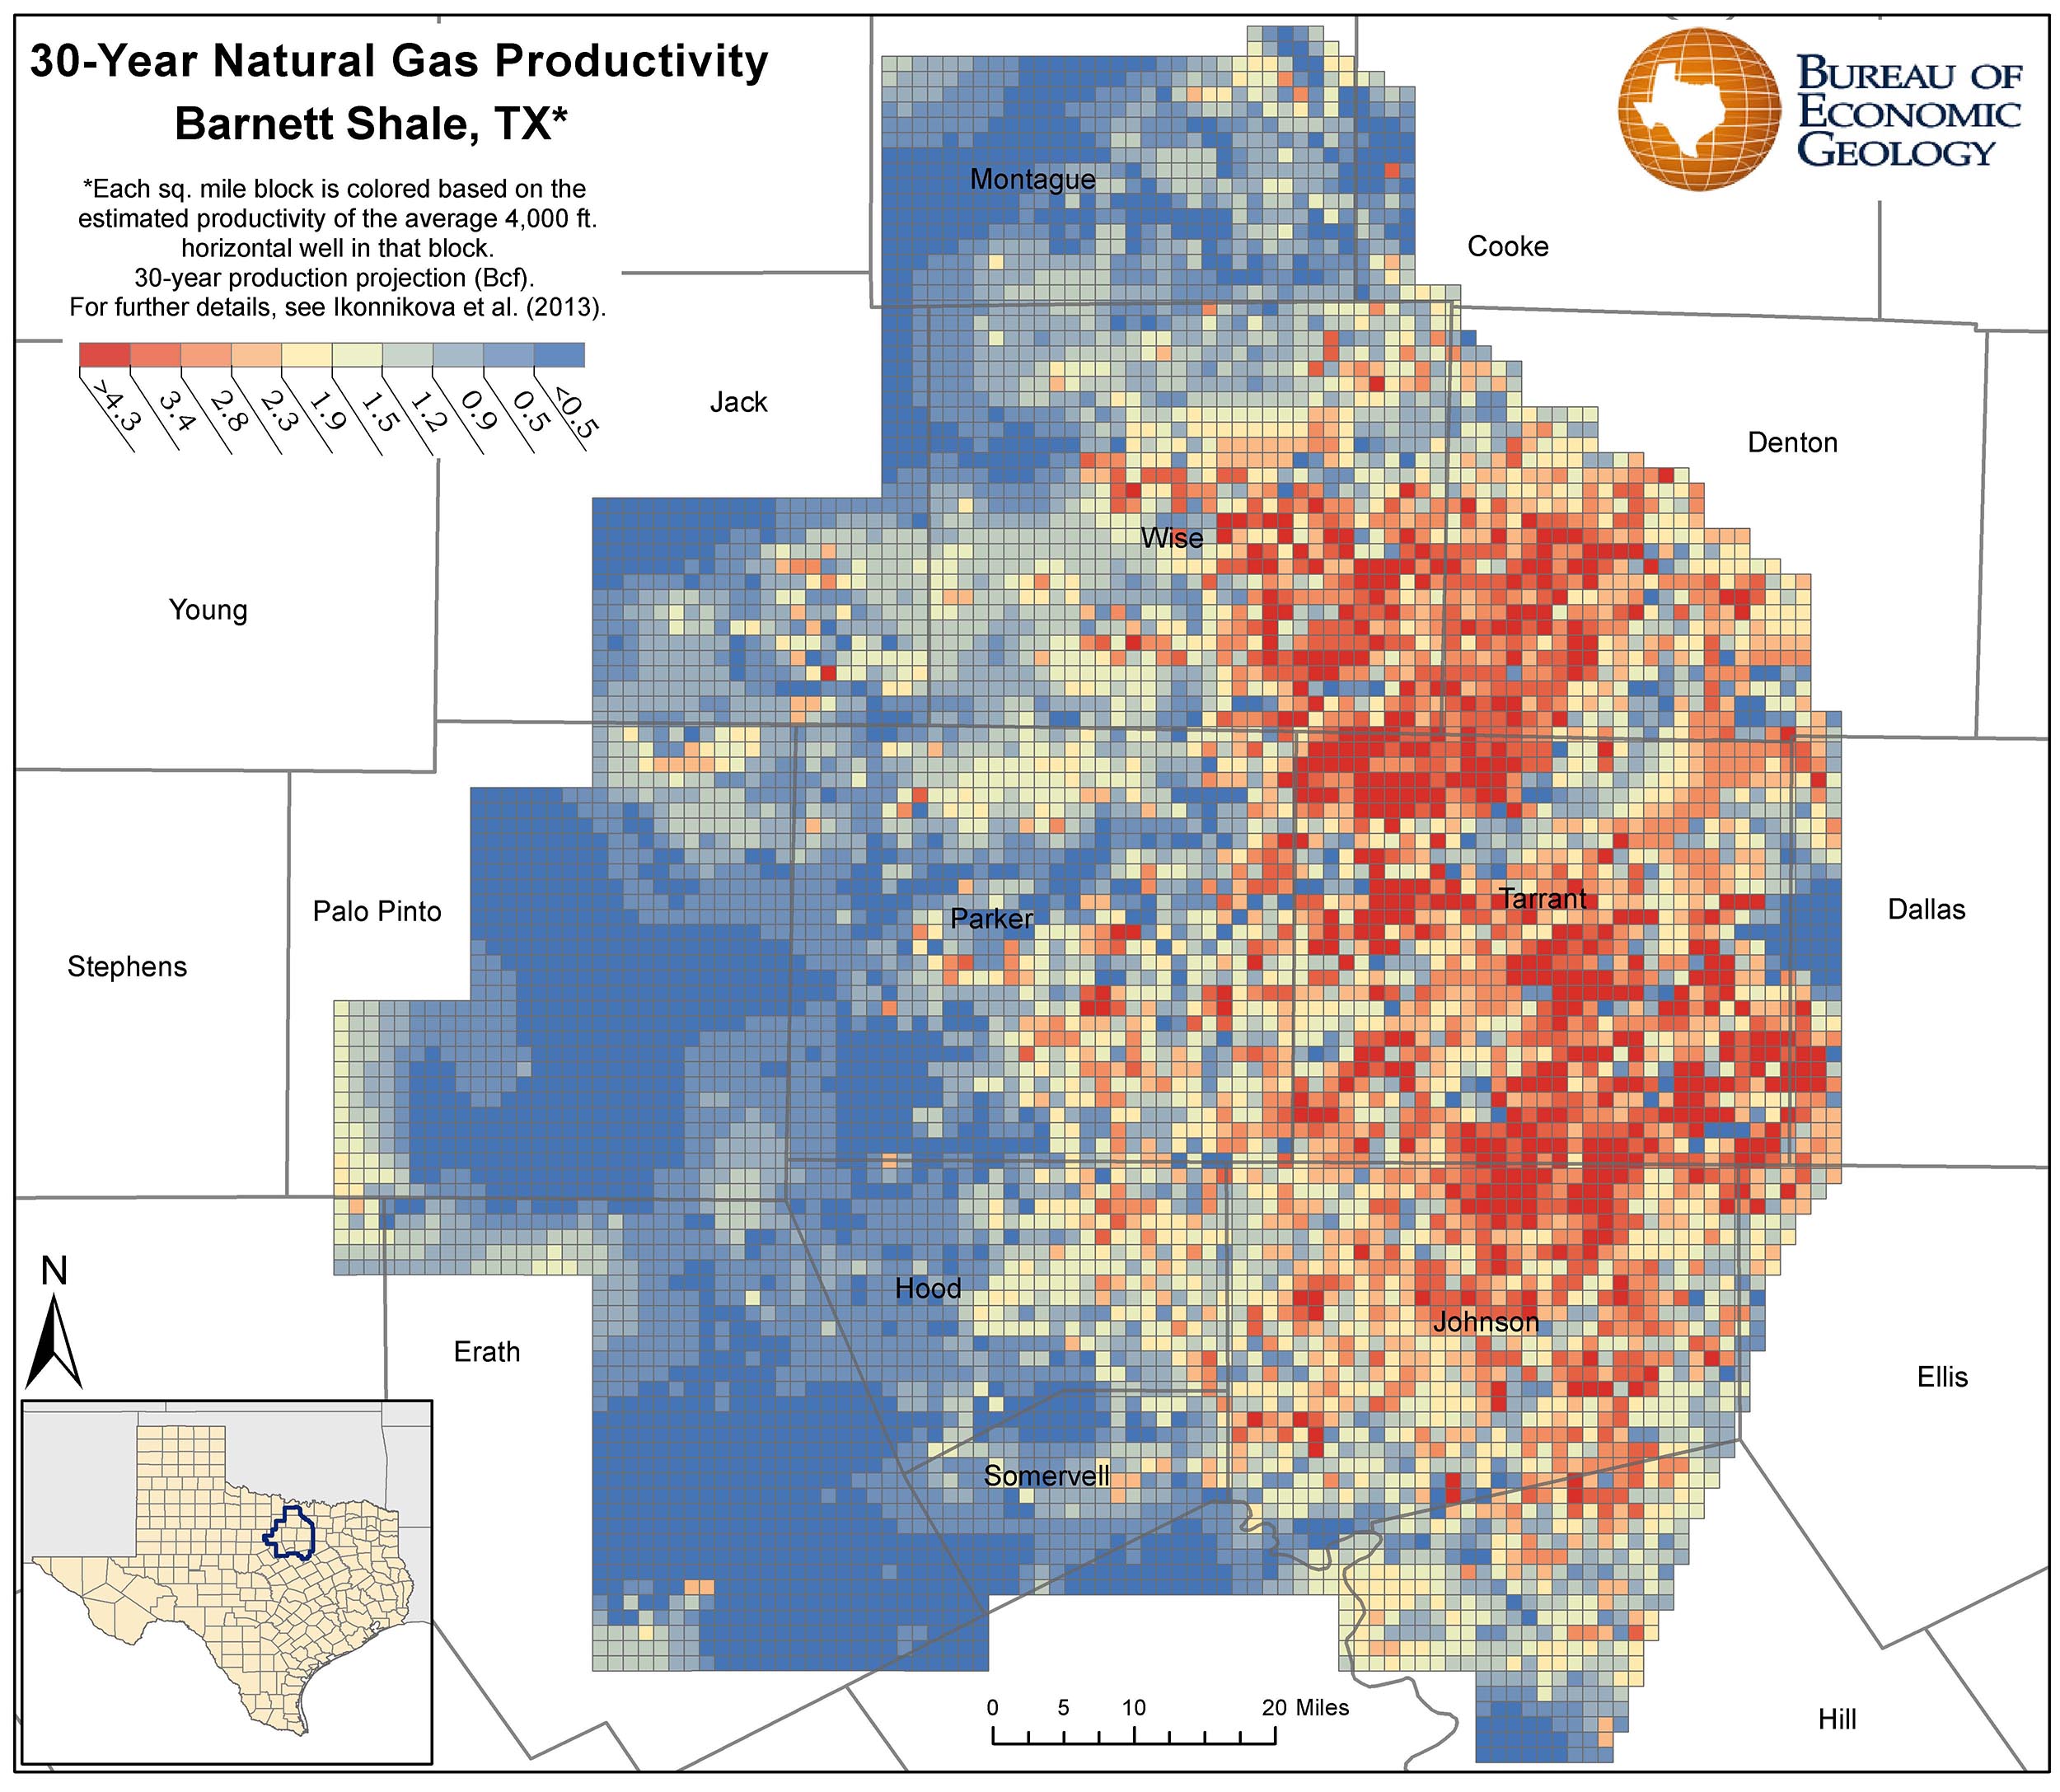
- Mile-by-mile analysis of 8,000 square miles gross area includes 4,172 square miles currently developed.
- The field is subdivided into 10 productivity tiers providing much improved granularity to reserves and economics.
- Full field panel analysis which applies econometric techniques to quantify the significance of many factors affecting well performance including validation of the decline rate and the significance of geologic and economic parameters.
- Geologic mapping of porosity and net pay zone thickness across the entire play. Porosity-thickness (PhiH) was determined to be a key driver of well productivity.
- Calculation of volumetric original gas in place (OGIPfree) and technically recoverable resources for each square mile and for the full field. For the entire Barnett OGIP free (original free gas in place) per square mile ranges from about 100Bcf/mi2 to less than 20 Bcf/mi2 : 444 Tcf for 8,000 mi2 (entire Barnett), and 280 Tcf for 4,172 mi2 (drilled blocks only).
- Quantification of well “drainage areas” and recovery factors that were validated against observed well interference between closely spaced wells.
- The estimate of technically recoverable resources exceeds previous USGS estimates and is similar to previous EIA estimates; this was enabled by per well granularity of recovery factor (RF) and drainage areas calculations. RF ranges from 55 percent for horizontal wells in the best tiers to about 4 percent in the worst tier.
- 86 Tcf of technically recoverable free gas (TRFG) in 8000 square miles of which over 12 TcF has been produced and 7 TcF is proven.
- Of the 67 Tcf remaining, 45 Tcf is in drilled blocks and 22 Tcf in undrilled.
- The 45 Tcf TRFG in 4,172 square miles of drilled areas exceeds the estimates of 23.81 Tcf by EIA (Intek analysis) of 4,000 miles of active area in July 2011. The 67 Tcf remaining technically recoverable over 8,000 square miles for the full Barnett also exceeds the EIA estimate for the full Barnett of 43.37 Tcf which covered 6,500 square miles The USGS estimated 26 Tcf in their 2003 assessment covering 5,000 square miles of the Barnett.
- 86 Tcf of technically recoverable free gas (TRFG) in 8000 square miles of which over 12 TcF has been produced and 7 TcF is proven.
- Detailed well economics of average wells in each of 10 productivity tiers, including the impacts of gas plant liquids on well economics.
- Quantification of historic attrition effects by productivity tier is incorporated into production models to account for the future volumes lost due to well failure. The attrition rate ranges from 1.1 % per year in Tier 1 to 3.5 % per year in Tier 6, with significantly larger failure rates in poorer Tiers (15 % in Tier 9; 35 % in Tier 10).
- A field-wide look at the production impact of refracturing on full field production. Refracturing contributes about 2 % of field production.
- Detailed modeling of future drilling through 2030, honoring production histories, well economics, pace of development and sensitivity to many other drivers of well performance.
- Quantification of the ultimate number of wells that will be necessary to achieve the expected field production.
- 28,302 wells total in the base case of which over 15,000 had been drilled through 2010 and 13,139 will be drilled between 2011 and 2030; for modeling are new wells were assumed to be 4,000-ft horizontals.
- Calculation of full-field production for wells drilled through 2030 including a stochastic risking of potential production to quantify the potential range of EUR outcomes.
- Base case 44 Tcf cumulative production through 2050 from wells drilled through 2030.
- Funded by the Alfred P. Sloan foundation as the first of several basins to be analyzed using consistent methodologies
The production outlook considers key variables of:
- The parameters of future wells (RF & length, attrition, lifetime, interfracture interference), resulting in an inventory of future wells
- Natural gas price
- The economic limit of each well
- Technology and well cost improvements
- OGIPfree
- Decline rate is the function of permeability, porosity and well depth and is proportional to

- Percentage of developed (drilled) & developable (undrilled) acreage
- Dry gas (Low Btu) vs. higher liquids (higher Btu) gas areas and oil production per well
- Achievable pace of development
- Ability of the production areas to expand and collapse with well economics (minimum & maximum incremental wells)
- Economic incentives to drill (which trigger increase in internal rate of return)
What are the forecasts of the study for production of natural gas from the Barnett Shale?
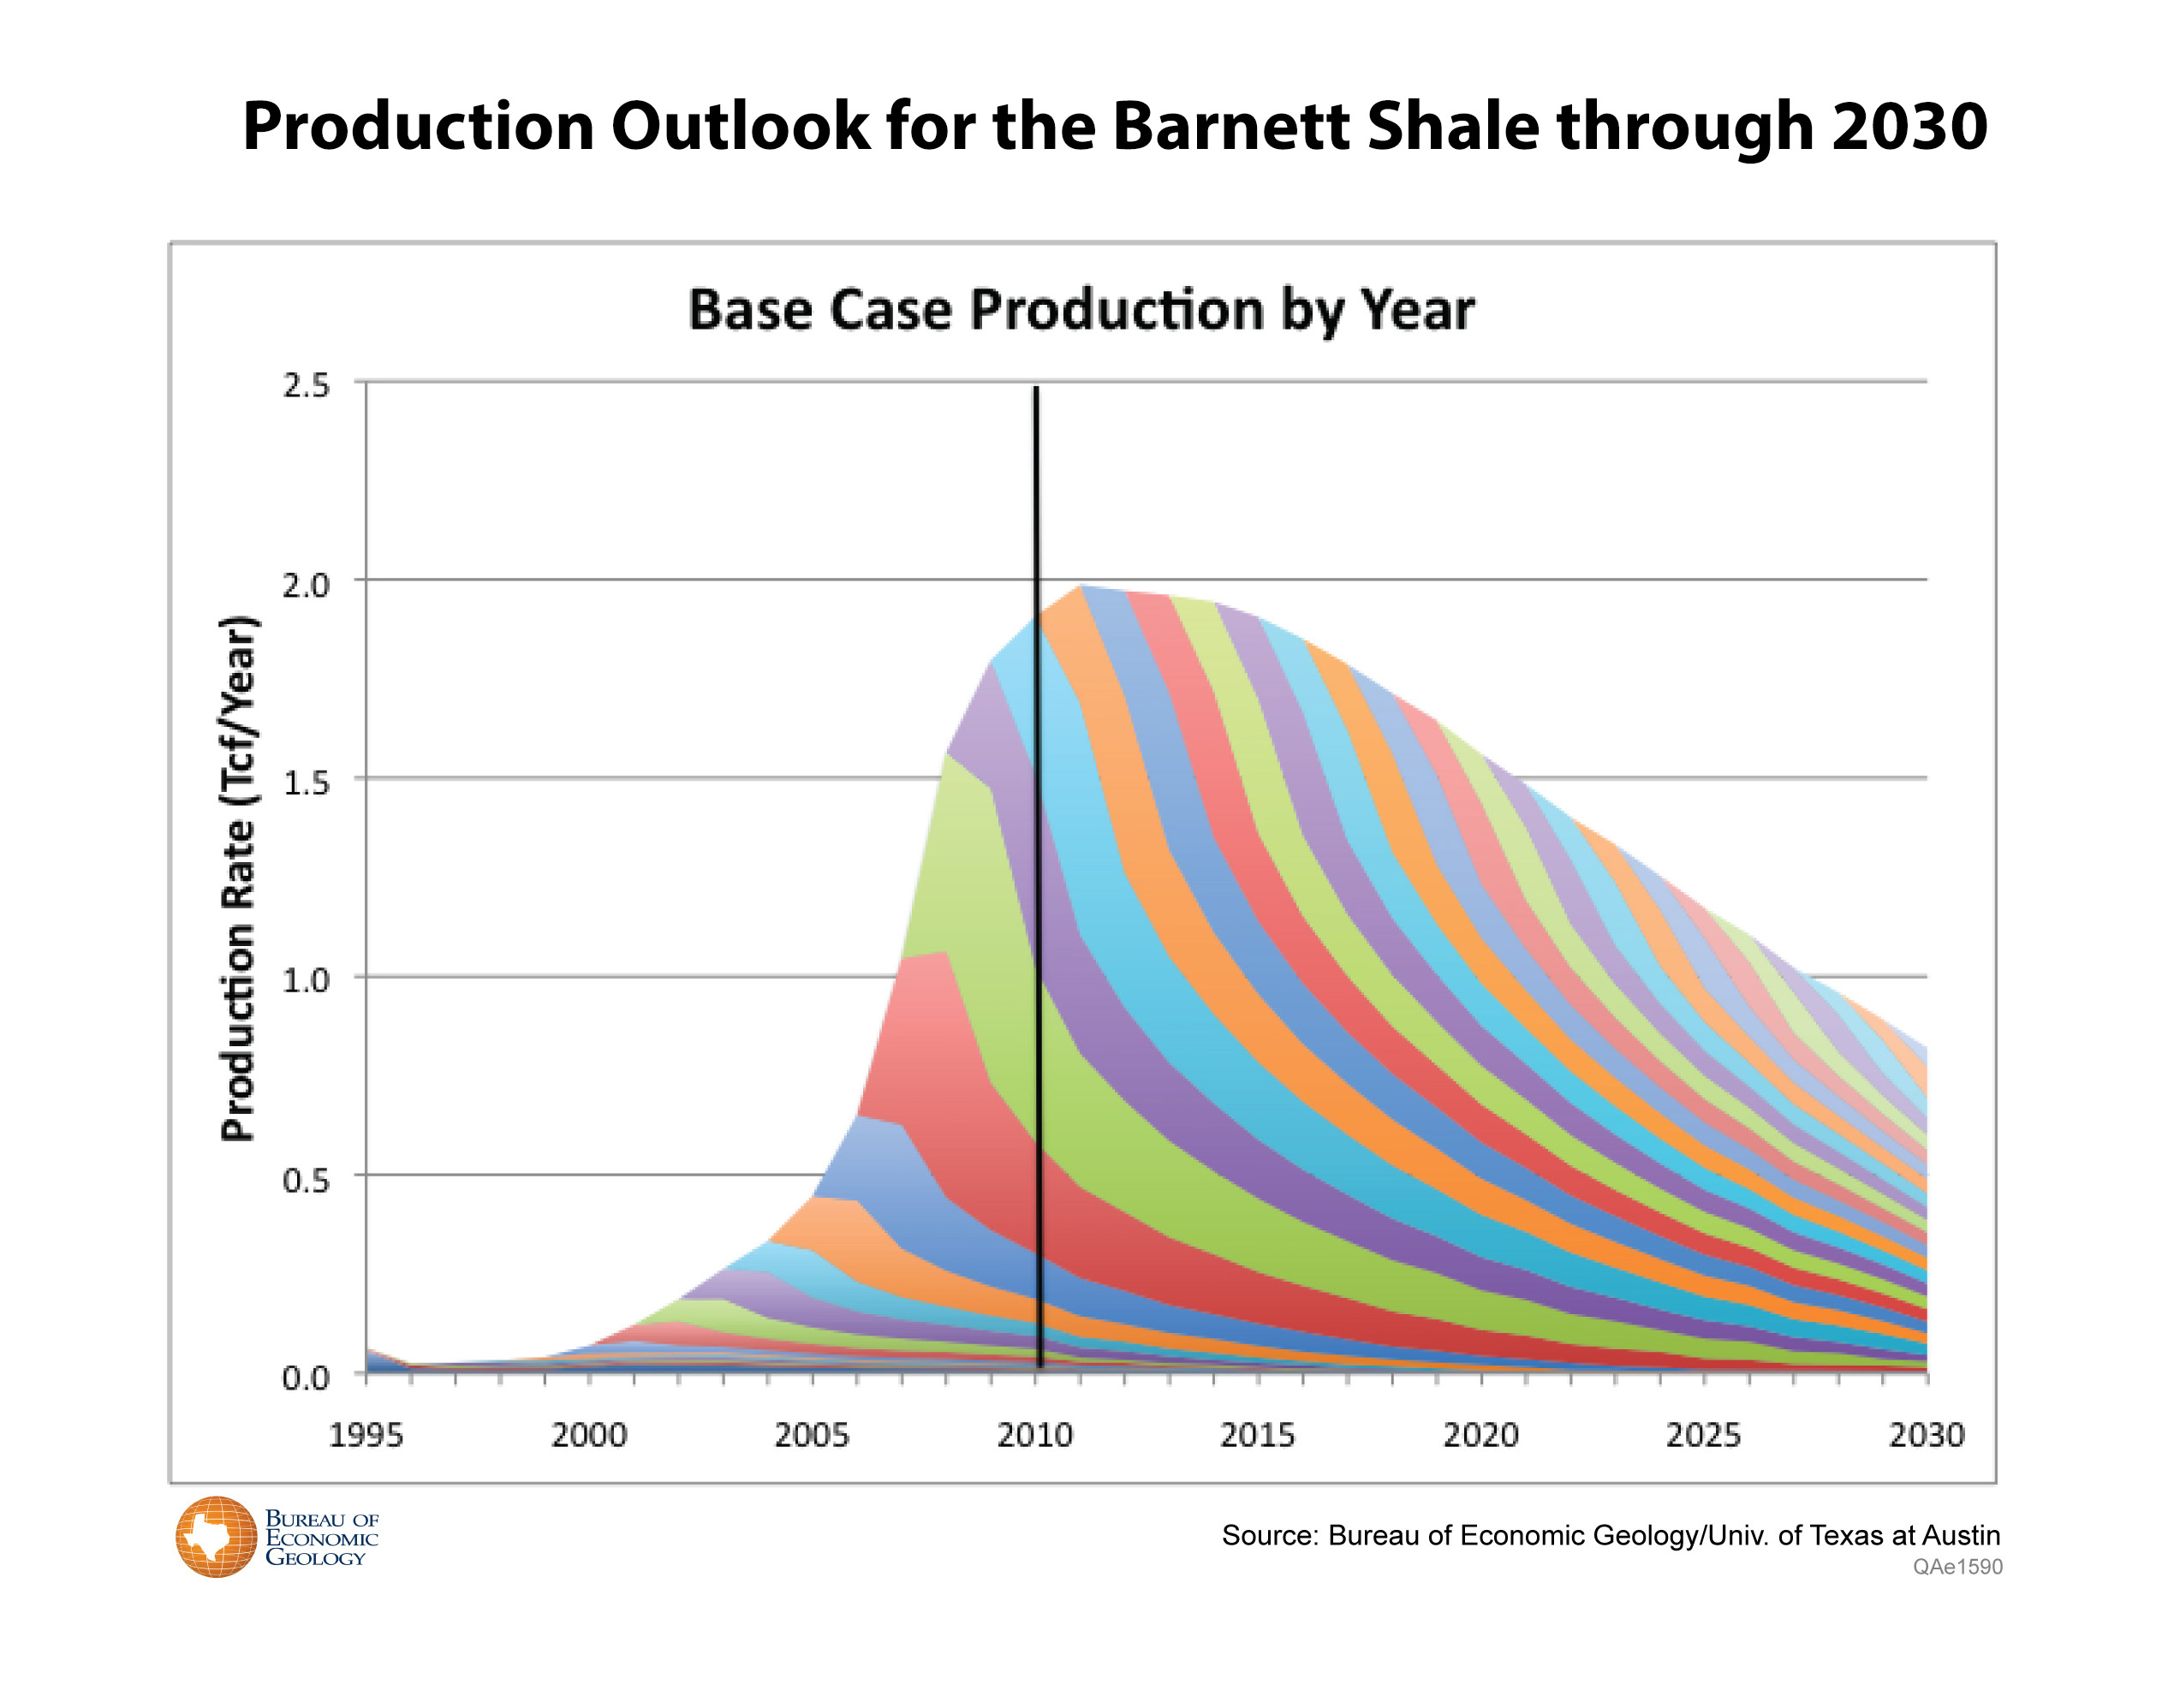
At a base price of $4 gas, the Barnett will produce approximately 44 trillion cubic feet (TCF) of natural gas through 2050 based on already drilled wells and the wells that will be drilled through 2030.
In the base case, from a current high of 2 TCF per year, production will plateau and slowly decline to about 900 BCF a year by 2030.
The data in the model stop at the end of 2010, after approximately 15,000 wells were drilled in the field. In the base case, the assessment forecasts another 13,000 wells would be drilled through 2030. In 2011 and 2012 more than 2900 wells were actually drilled, in line with the forecast, leaving just over 10,000 wells remaining to be drilled through 2030 in the base case.
The forecast stops addition of new wells by 2030, with wells started by 2030 continuing to produce through 2050 under the well attrition, economic recovery limits, and decline parameters imposed by the model.
Where did the production data on the wells come from? Can others obtain it?
IHS and Drillinginfo.com provided datasets on production. Both companies sell their proprietary data, which BEG cannot lawfully share.
When will assessments be available on other major U.S. shale formations?
By the end of 2013, the BEG will complete assessments, following the same methodology, of three other major U.S. shale gas basins: the Marcellus, Haynesville and Fayetteville.
How many years of supply of natural gas is there in the Barnett Shale?
While it is common for analysts to report that a formation or county has a certain number of years of natural gas reserves based on current rates of consumption, presenting information in this manner can be misleading because of shifts underway in national energy use. In 2004, for example, the U.S. produced half of its electricity from coal and only about 20 percent from natural gas, whereas in 2012, the resources each accounted for about 35 percent of U.S. electricity generation. For this reason it can be more useful to simply state the production forecasts in trillion cubic feet (TCF).
In 2011, the U.S. consumed about 24.4 TCF of natural gas, according to the U.S. Energy Information Administration and Barnett production supplied nearly 10% of that consumption.
Why are there more reserves if the price of gas goes up, and fewer if the price goes down?
The word “reserves” refers to the amount of a mineral resource that is technically and economically recoverable within a certain area. In an oil or gas formation, the resource base is almost always considerably larger than the recoverable reserves, because in some parts of the formation, it is simply too expensive or technically difficult to extract the resource. When resource prices are high, operators can afford to spend more and take greater technological risks seeking the harder-to-extract parts of the resource base. When prices are low, it does not pay to pursue expensive parts of the formation, and this fact lowers the overall reserves estimate.
Technology also plays a significant role in understanding reserves. Before the advent of hydraulic fracturing, for example, the U.S. was known to have a large resource base of shale gas, but the country did not have economically recoverable reserves. Today, hydraulic fracturing has substantially reduced the cost of obtaining shale gas resources, contributing to much higher natural gas reserves estimates for the U.S. and world. The resource (shale gas) did not change, but the drilling and extraction technology and our understanding of the geology did.
Has this study been peer-reviewed?
Five research papers based on research from the assessment are in review in peer reviewed journals.
Before submitting the papers, the BEG team submitted their research to several other forms of peer review, as part of the research process. The BEG team invited an independent review panel with members from government, industry and academia to critique their research. At an open day for academic, government, NGO representatives and industry scientists, 100 attendees were invited to offer additional feedback. Scientists from two of the largest producers in the Barnett, Devon Energy and ExxonMobil, offered feedback on the methodology during two in-house corporate review days. Finally, the BEG hired a consulting company to critique the draft manuscripts and offer suggestions for their improvement of the study.
To answer this question—and see updates on the study as they become public—please visit the Bureau of Economic Geology website for the study at: