
Boerne Gets Water Data Dashboard
December 12, 2023
With help from researchers from the Bureau of Economic Geology, the City of Boerne recently launched an interactive water dashboard that allows anyone to access a range of water data in one place.
Bureau Senior Research Scientist Michael Young and Vianey Rueda, an alumna of the Jackson School of Geosciences Energy and Earth Resources master’s program, played lead roles in creating the dashboard. The project was informed by “Internet of Water” principles, which recognize the importance of using modern data infrastructure to effectively manage water resources and making water data accessible to the public.
For the past several years, Young and Rueda, along with collaborators at Duke University and Boerne’s Cibolo Center for Conservation, have been working with the City of Boerne to make the dashboard a reality. The project was partially funded by the Cynthia and George Mitchell Foundation.
“We were excited to work with the City of Boerne on this project,” said Young. “With their support, we were able to develop an effective tool that can promote better stewardship of water resources and greater resilience during droughts or other water-supply challenges.”
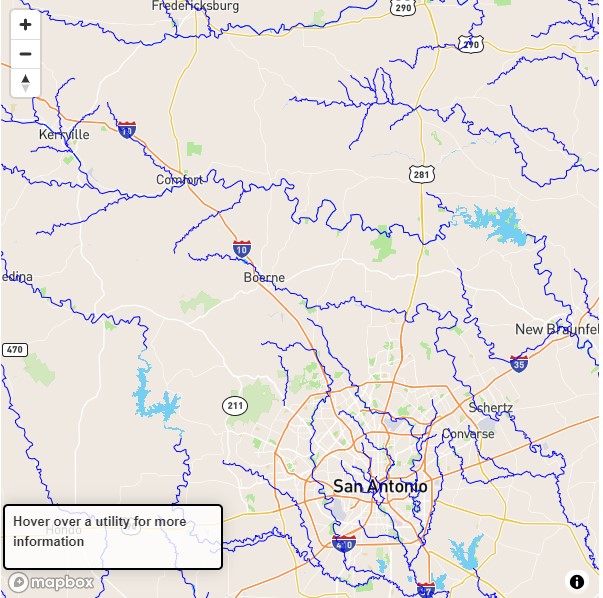
The dashboard includes data on groundwater and surface water supplies, water demand, and water reuse, among other water data. The information is displayed on the dashboard through graphs, charts, maps and other illustrations that provide users with a visual understanding of both current and historical water data.
In addition to serving the Boerne community, the researchers said the dashboard also serves as a proof-of-concept tool that could be mirrored by other communities interested in creating their own regional water data programs.
Visit the dashboard at boerne-dashboard.thewaterdata.com.
Back to the Newsletter