
Big Data Imaging Shows Rock’s Big Role in Channeling Earthquakes in Japan
February 7, 2022

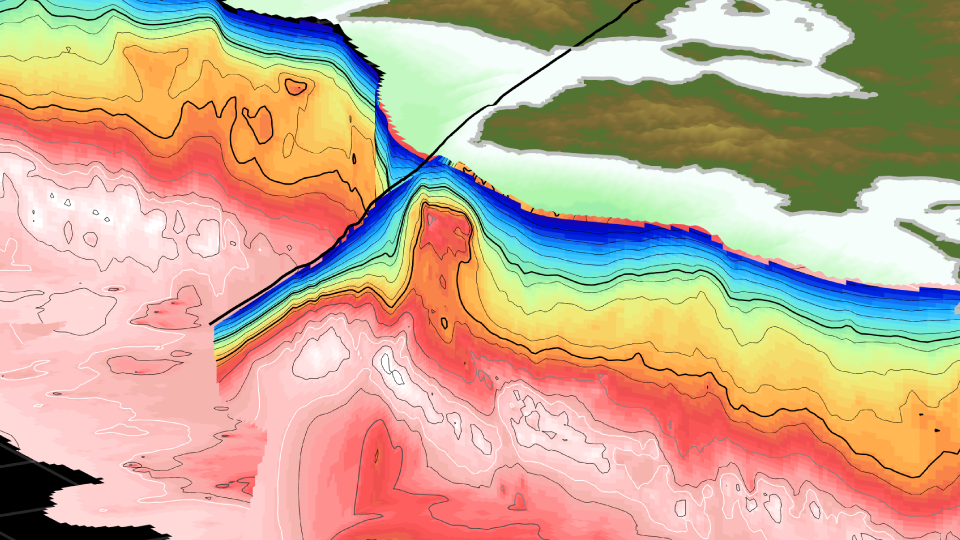
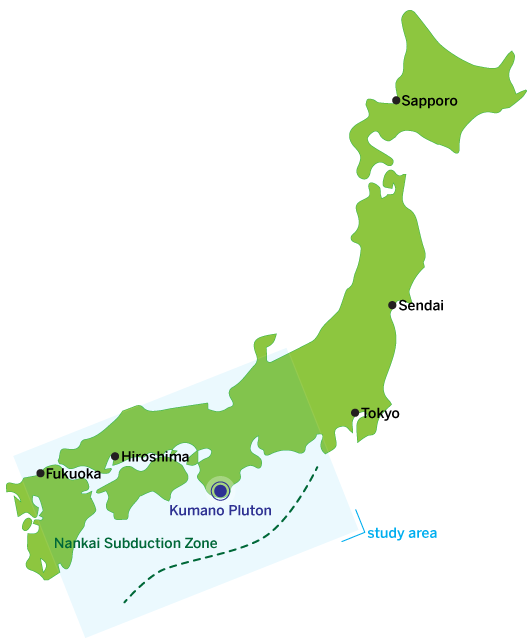
Thanks to 20 years of seismic data processed through one of the world’s most powerful supercomputers, scientists have created the first complete, 3D visualization of a mountain-size rock called the Kumano Pluton buried miles beneath the coast of southern Japan. They can now see the rock could be acting like a lightning rod for the region’s megaquakes, diverting tectonic energy into points along its sides where several of the region’s largest earthquakes have happened.
The findings will provide critical information for a major new Japanese government-funded project to find out whether another major earthquake is building in the Nankai subduction zone, where the pluton is located, said Shuichi Kodaira, director of the Japan Agency for Marine-Earth Science and Technology and a co-author of the study published Feb. 3 in the journal Nature Geoscience.
“We cannot predict exactly when, where, or how large future earthquakes will be, but by combining our model with monitoring data, we can begin estimating near-future processes,” said Kodaira, who was among the scientists who first spotted signs of the Kumano Pluton in 2006. “That will provide very important data for the Japanese public to prepare for the next big earthquake.”
The full extent of the Kumano Pluton was revealed using the LoneStar5 supercomputer at UT’s Texas Advanced Computing Center to piece together 20 years of seismic data into a single high-definition 3D model.
“The fact that we can make such a large discovery in an area that is already well studied is, I think, eye opening to what might await at places that are less well monitored,” said Adrien Arnulf, a research assistant professor at the University of Texas Institute for Geophysics and the study’s lead author.
The model shows the region around the Nankai subduction zone, with the Earth’s crust bending under the pluton’s weight. In another unexpected finding, the pluton was seen diverting buried groundwater into the Earth’s interior. The researchers think the pluton’s interference with the wider subduction zone is influencing the tectonic forces that cause earthquakes.
Seismic imaging uses sound waves to create pictures of the Earth’s subsurface. Over the years, Japan’s vast network of sensors has collected millions of seismic recordings from thousands of locations along the Nankai subduction zone. The sensors are primarily used to record earthquakes and tremors, but the team widened their search to include chance recordings of passing scientific surveys using a technique Arnulf and coauthor Dan Bassett, a research scientist at GNS Science, had perfected while working on small-scale projects in New Zealand. The researchers compiled the massive amounts of information into a single data set and turned it into a 3D model with the help of LoneStar5.
The research was funded by the U.S. National Science Foundation. Additional co-authors include scientists at Scripps Institution of Oceanography at the University of California, San Diego. UTIG is a research unit of the UT Jackson School of Geosciences.
Constantino Panagopulos, University of Texas Institute for Geophysics, 512-574-7376; Monica Kortsha, Jackson School of Geosciences, 512-471-2241; Anton Caputo, Jackson School of Geosciences, 512-232-9623.