
Jackson School Symposium Winners and Q&A
February 19, 2025
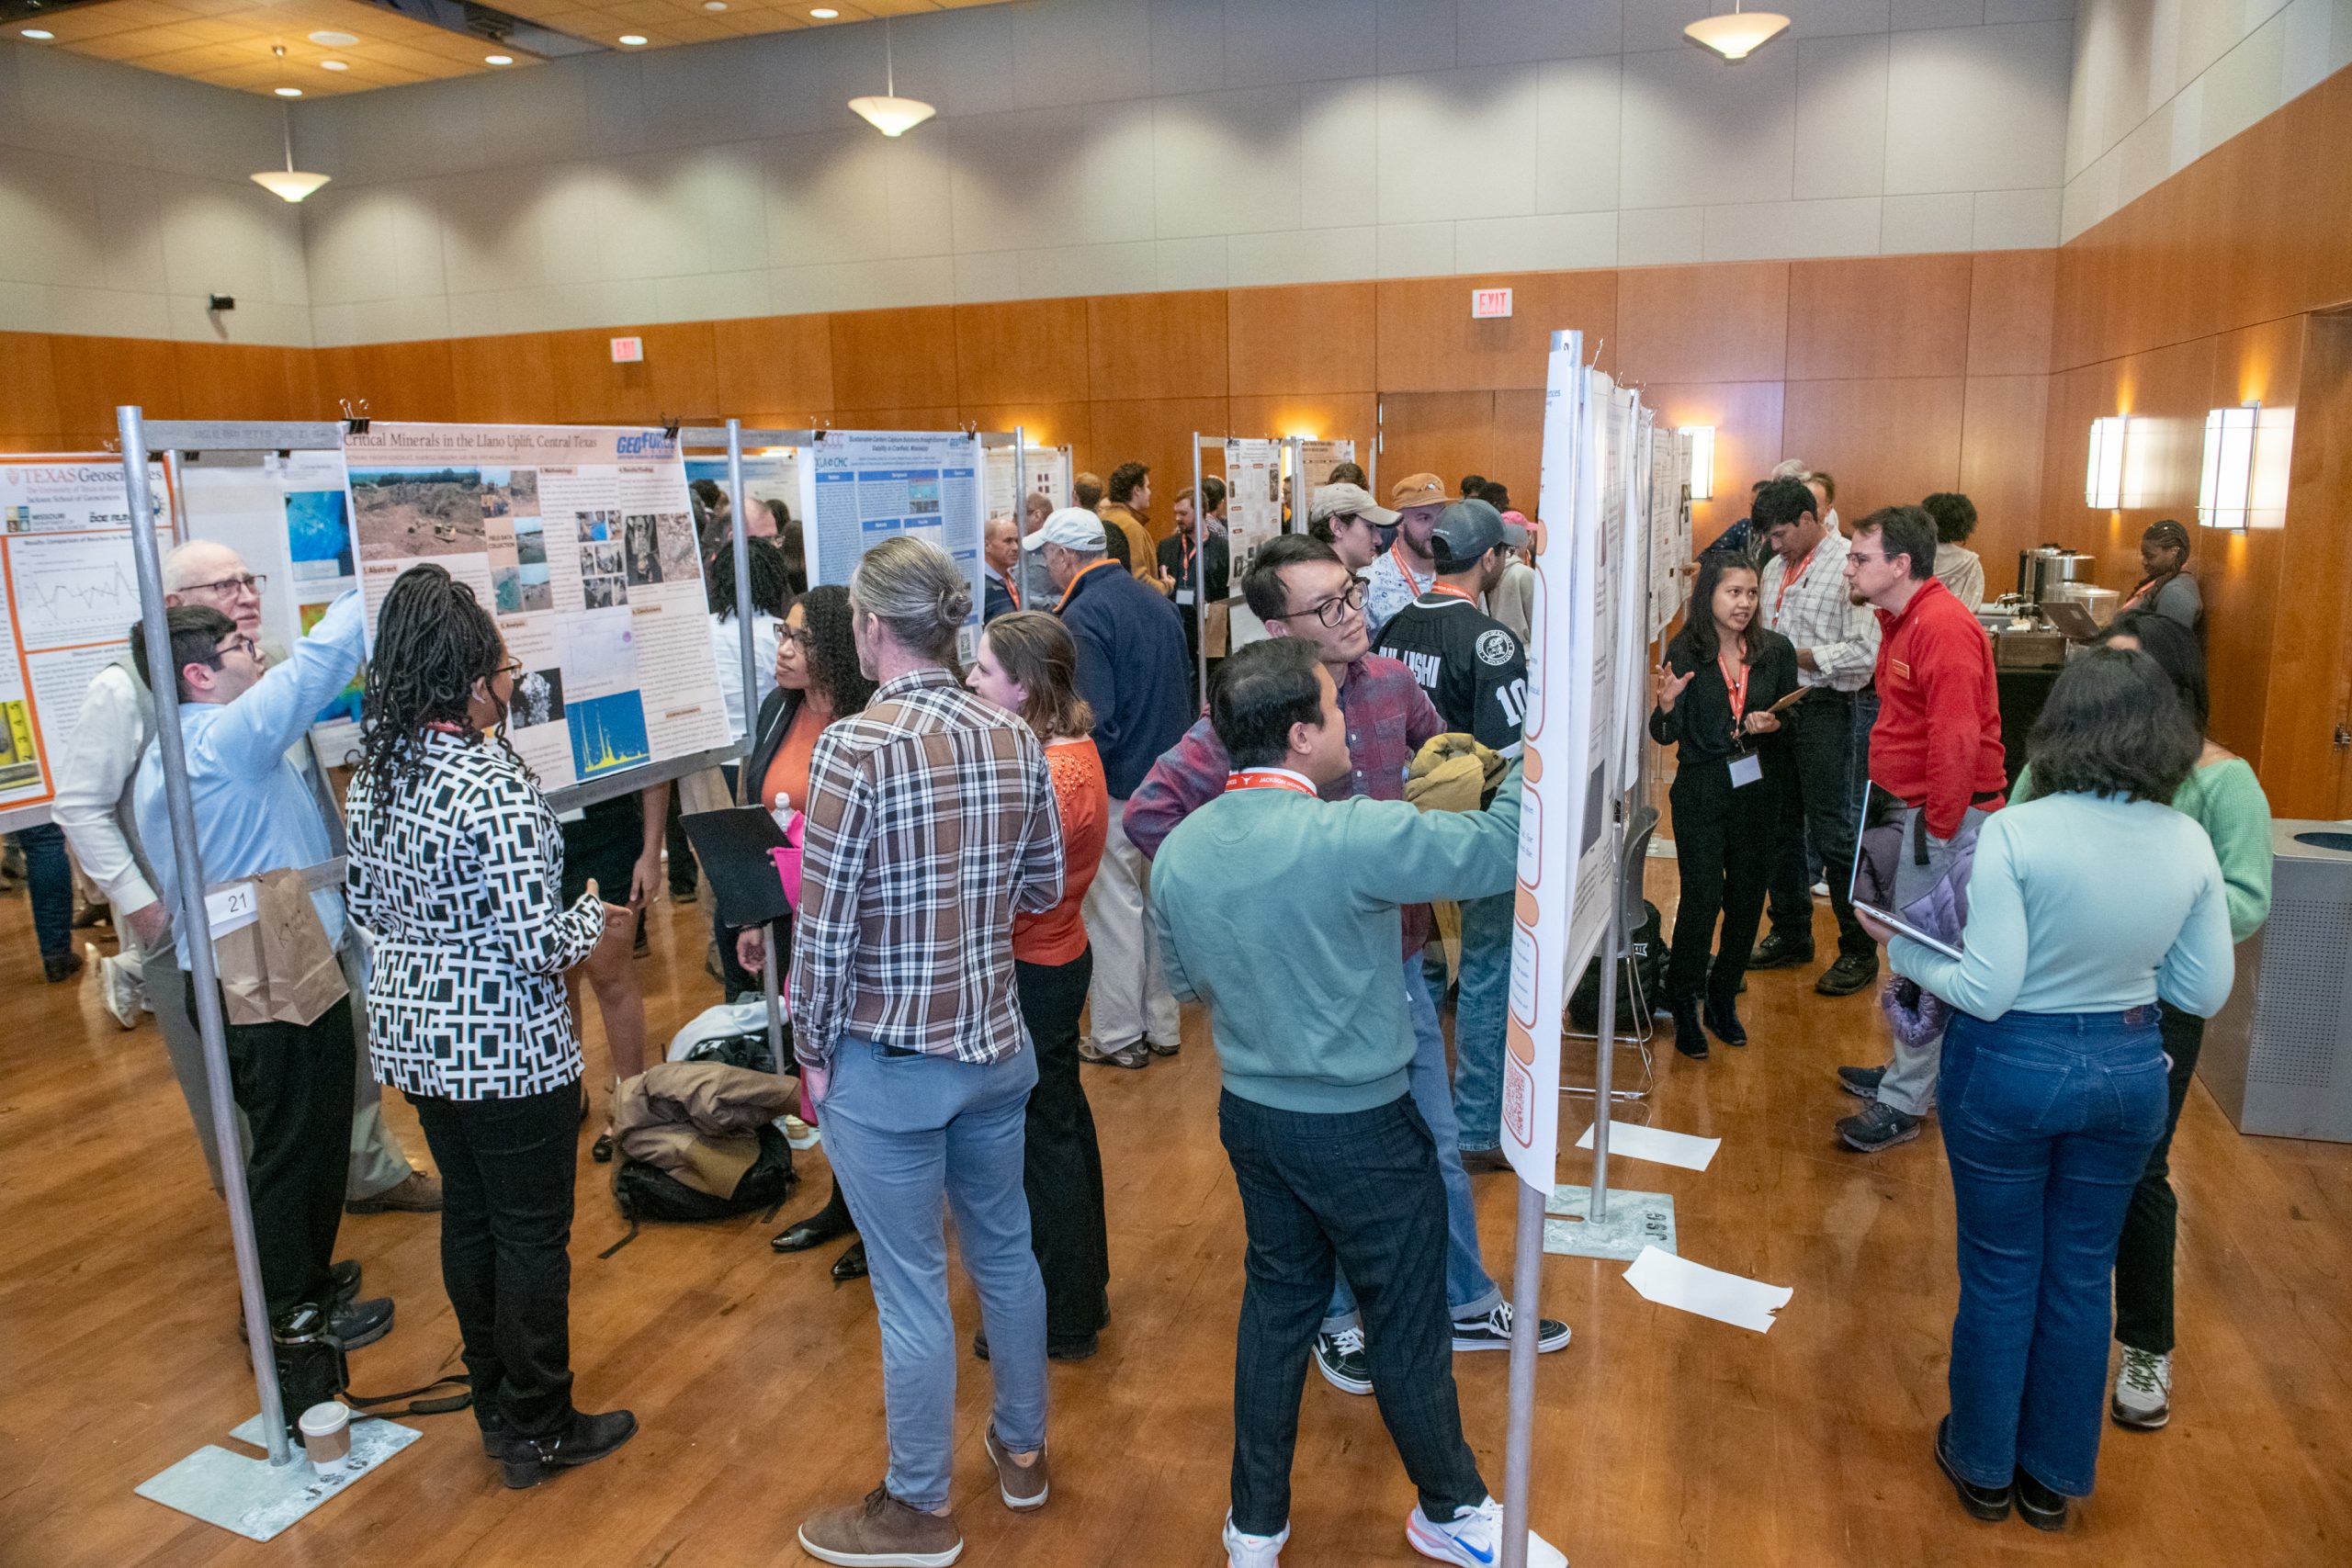
This year, 126 students presented their research at the 14th Annual Jackson School of Geosciences Research Symposium on Feb. 14, 2025.
Our presenters, attendees and judges made the event a great day of scientific exchange and discussion. Listed below are the winners in each category followed by a short Q&A with the first-place winners in each Jackson School category.
View photos from the event on Facebook.
Award Winners
High School
Sofia Magariños Vargas – Reconstructing the Laurentia-Antarctica Orientation of Rodinia by Using Uranium-Lead Dating of Zircons
Varsha Suresh – Sustainable Carbon Capture Solutions through Economic Viability in Cranfield, Mississippi
Kiri Orr – Critical Minerals in the Llano Uplift, Central Texas
Undergraduate
Danielle Zaleski – Temporal Microplastics Analysis of Lady Bird Lake, Austin Sediments: A Reflection of Austin’s Urban Growth
Caroline Mackin – Using Laser Grain Size Analysis to Investigate Changes in Surface Carbonate Producers in the Southeastern Atlantic (Walvis Ridge) across the Eocene-Oligocene Transition
Joseph Sennello – Assessment of Factors Affecting the Development of Pyrite Disease in Devonian Chondrichthyan Fossils from the Cleveland Shale in the CMNH Collection
Master’s Students & Ph.D. Aspirants
Cassandra Guzman – Preliminary Observations of Rapid Sediment Reworking of a New Inlet: Hurricane Beryl, July 2024, Texas
Jonathan Amendola – A Geophysical Analysis of Kangerlussuup Sermia and Kangerluarsuup Sermia Glacimarine Sediments, Central West Greenland
Alex Bonilla Franco – Weathering of the Archean Continents: Effect on the Lithium Isotope Composition of the Ancient Ocean
Ph.D. Candidates
Co-First Place Winners
- Madison Preece – Investigating the Structural and Topographic Evolution of the Himalayas through Landscape Analysis and Thermokinematic Modelling
- Harsh Kamath – Assessing Heat Stress Along the Paris 2024 Olympics Marathon Route
Third Place
- Jennifer Kohn – Siliciclastic Sediment Routing Driving Basin-Margin Evolution in Arid Mixed Siliciclastic-Carbonate Systems, Northern Delaware Basin
Q&A
The first-place winners of each category were asked the same three questions about their research and experience at the symposium. These responses have been edited for length and clarity.
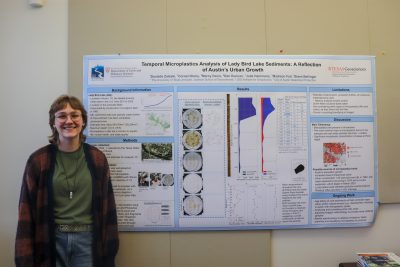 Undergraduate student Danielle Zaleski
Temporal Microplastics Analysis of Lady Bird Lake, Austin Sediments: A Reflection of Austin’s Urban Growth
Q: What is your research about? What did you discover?
A: My research focused on a sediment core in Lady Bird Lake. We separated the microplastics out from the sediments and used ImageJ, which is an image processing software, to count and characterize the microplastics we found.
We found that, generally, microplastic amounts increased throughout the core. However, there was a very specific spike in microplastics around the 70-centimeter depth, I believe where the road microplastics — which are bitumen, asphalt and tire particles — went from about 500 to about 6,000 particles per 100 grams of sediment.
We had some theories for why that is, but that’s something that we’re hopefully going to figure out in the future.
Q: What was your biggest obstacle in completing this research? How did you overcome it?
A: With the insane amount of microplastics in Lady Bird Lake, I had to develop a new counting methodology for it. So just taking inspiration from professors and other publications, for counting the road particles I used a color threshold. I would select anything (within certain color values), because those are all the dark particles.
Q: What advice would you share with other students who do this in the future?
A: It’s just kind of getting over that initial fear. I would just say, don’t be scared. Only good things are going to come out of this. You’ll connect with new people that you probably would have never talked with before. You’ll get very, very good insight on your research, which could lead to further studies.
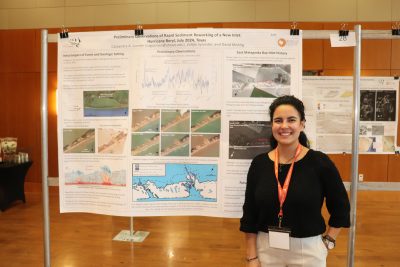 Graduate student Cassandra Guzmán
Preliminary Observations of Rapid Sediment Reworking of a New Inlet: Hurricane Beryl, July 2024, Texas
Q: What is your research about? What did you discover?
A: My research has to do with the impacts of Hurricane Beryl from last year. It basically cut an inlet into a barrier island. So we’re trying to understand how that inlet formed and why it formed. Part of that research is using longshore current sediment supply, everyday wind and water levels that occur, and how that can open or close the inlet. Also using historical data from two previous inlets in that region to understand why is it closed or why it won’t open again.
Q: What was your biggest obstacle in completing this research? How did you overcome it?
A: The biggest obstacle has definitely been using the software. As an undergraduate, I had access to a lot of research abilities, but not always software. So trying to learn Python, trying to learn how to use QGIS. Trying to use these software was my biggest challenge, and I overcame it just taking it one day at a time. That’s all you can do, is teaching yourself slowly.
Q: What advice would you share with other students who do this in the future?
A: It’s a conversation. I wasn’t really worried who was a judge or not; I just knew the main points. Just know your research really well, and that way you can just have a conversation about it and be very open.
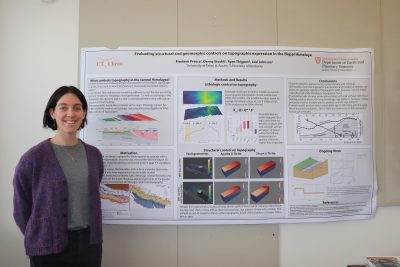 Doctoral student Madison Preece
Investigating the Structural and Topographic Evolution of the Himalayas through Landscape Analysis and Thermokinematic Modelling
Q: What is your research about? What did you discover?
A: This research was looking at how differences in rock strength may be controlling a really unique topographic break that we see in the central Himalayas. I wanted to know how much that’s playing a role in topographic expression so that I could look further into the structural controls on it and compare two competing tectonic models for how this really unique topographic feature was developed and is evolving.
Q: What was your biggest obstacle in completing this research? How did you overcome it?
A: The biggest obstacle is probably the fact that I haven’t been to the Himalayas yet to collect my samples. So all of the analyses that I’ve done here have been based off of previous publications, and it’s all been modeling. It’s been a little bit difficult to come up with a comprehensive story without actually having my own samples to analyze. But I think this sets me up really well for my field season.
Q: What advice would you share with other students who do this in the future?
A: Keep it much more big picture than you think you should. We’re all really excited about these super niche areas that we’re researching. But at a poster symposium where you’re trying to communicate the really cool research you’ve been doing, whenever you start to get down into the nitty gritty, you kind of lose people. And I think by giving a more broad overview thar’s easier to process, that kind of sparks interest in people. And then they’ll ask more questions, and then you’ll have a chance to get into the nitty gritty.
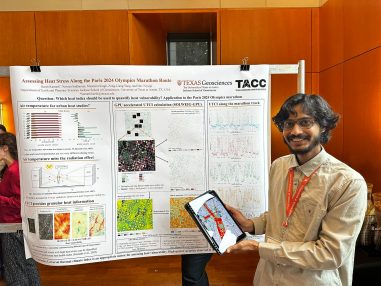 Doctoral student Harsh Kamath
Assessing Heat Stress Along the Paris 2024 Olympics Marathon Route
Q: What is your research about? What did you discover?
A: This was based on some of the work that we did for the 2024 Paris Olympics. We were the only academic institution that was participating (among other agencies). The idea was that everyone brings their models, and then we do an intermodal comparison to forecast how the weather is going to be.
As a part of this we were also worried about the heat stress of the marathon runners. On the (day prior), we created this map of the variables called the Universal Thermal Climate Index, or UTCI. This index accounts for temperature, wind speed, humidity and also radiation. This is what we forecasted a day in advance for the Paris Olympics, and that’s what this is all about.
Q: What was your biggest obstacle in completing this research? How did you overcome it?
A: There’s this model that we use, which is called SOLWIEG, that computes the UTCI. This model ran on a central processing unit. To do that for the entire marathon, which is a huge geographical area, it would take a lot of time. What we ended up doing is that we took the code and we rewrote it to make it work with graphic processing units. These are much faster — 70 times better than the CPU. So if the task was completed in, say, 320 hours on a CPU, it got completed in 4.5 hours on GPU. So that’s how we could do the day ahead forecasting. Otherwise this would not have been possible.
Q: What advice would you share with other students who do this in the future?
A: It’s very important to put the results in a simplistic way so that we can communicate it to the public. This is the fourth time I’ve participated in this symposium. My posters in the previous years have been highly technical, and it was not for the broader audience. So that’s why I decided, okay, I’m just going to make some plots, and which are very easy to understand, and then just convey the message.
The other thing is that I tried to make a poster that people could relate to. Like, if you go out and experience heat stress, that’s what these people who run the marathon experienced. When I give examples — like when you stand below a tree or next to a wall that is shading you, your heat stress is much less — then people could relate to it.