
Ride High and Seek
October 22, 2014
Texas researchers have gained an eagle-eyed view of the world thanks to a premier digital mapping tool
By Joshua Zaffos
Halloween was particularly scary in the Texas capital in 2013. An intense storm over south Austin caused Onion Creek to top its banks and flood hundreds of homes. In just 15 minutes, the creek rose 11 feet and sent walls of water and debris through nearby neighborhoods, killing five people.
In the aftermath of the flash flood, researchers at the Bureau of Economic Geology (BEG), part of the Jackson School of Geosciences, took to the sky on a “first response” effort with one of the world’s most advanced digital mapping tools. Using the Bureau’s airborne laser-based instrument system—known as lidar—scientists were able to quickly scan the disaster zone by plane to collect detailed measurements of flood erosion and debris movement, and then create high-resolution digital elevation maps.
The reconnaissance was a major assist for Lindsay Olinde, a Jackson School student pursuing her doctorate, who is comparing pre- and post-flood images of Onion Creek to recognize how different sections of the creek responded to the flash flood.
“Integrating these results with flow modeling will improve our understanding of how streams respond to flash flood conditions,” Olinde said. “The extensive resources required to collect lidar datasets are truly rare. Without the support from the BEG, especially the expertise of Kutalmis Saylam (Bureau scientist associate who oversees the lidar program), this unique record would have been unrecorded.”
The Onion Creek survey was a collaborative—and swift—success within the Jackson School. The Bureau’s state-of-the-art lidar unit is capable of very in-depth and long-term analyses and has been used on projects from the Gulf Coast to Alaska’s North Slope.
Named Chiroptera, the Latin name for bats, the Bureau’s new lidar unit can detect landforms and details on the ground and also identify underwater, or bathymetric, features, piecing together data with precision and detail that was unimaginable just a few years ago. The technology enables scientists to detect ancient archaeological sites hidden beneath tree canopies and vegetation, measure the length of coastlines and depth of lakes, and monitor and prepare for environmental changes and disasters, including flooding, land subsidence and the formation of sinkholes.
“Laser mapping provides an amazing level of detail that helps us build flow models much more accurately than was done in the past,” said Michael Young, associate director of the Bureau.
Better Than the Naked Eye
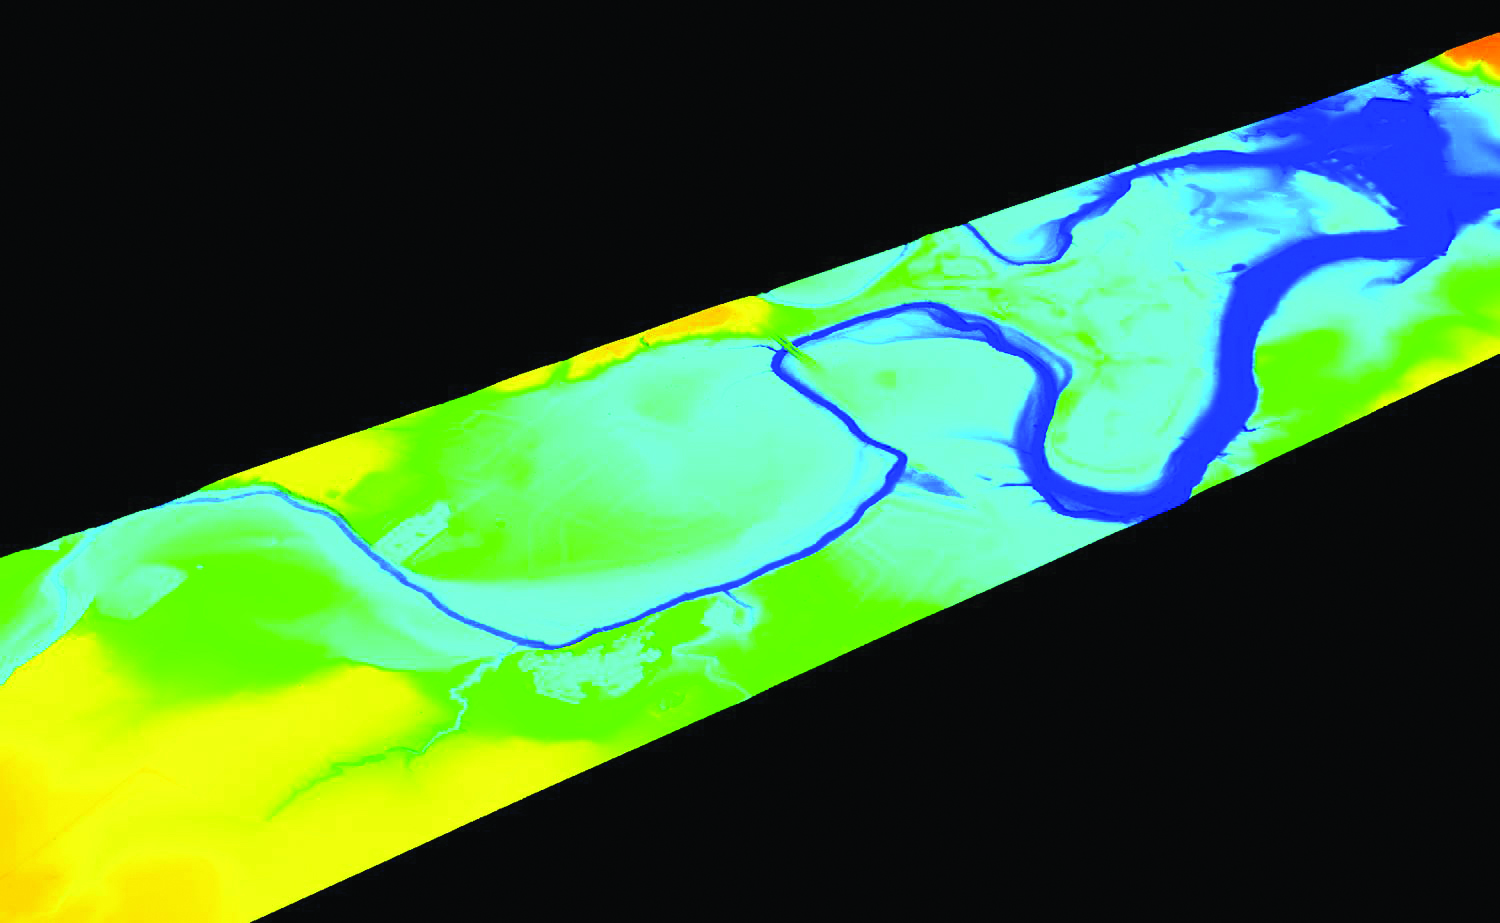
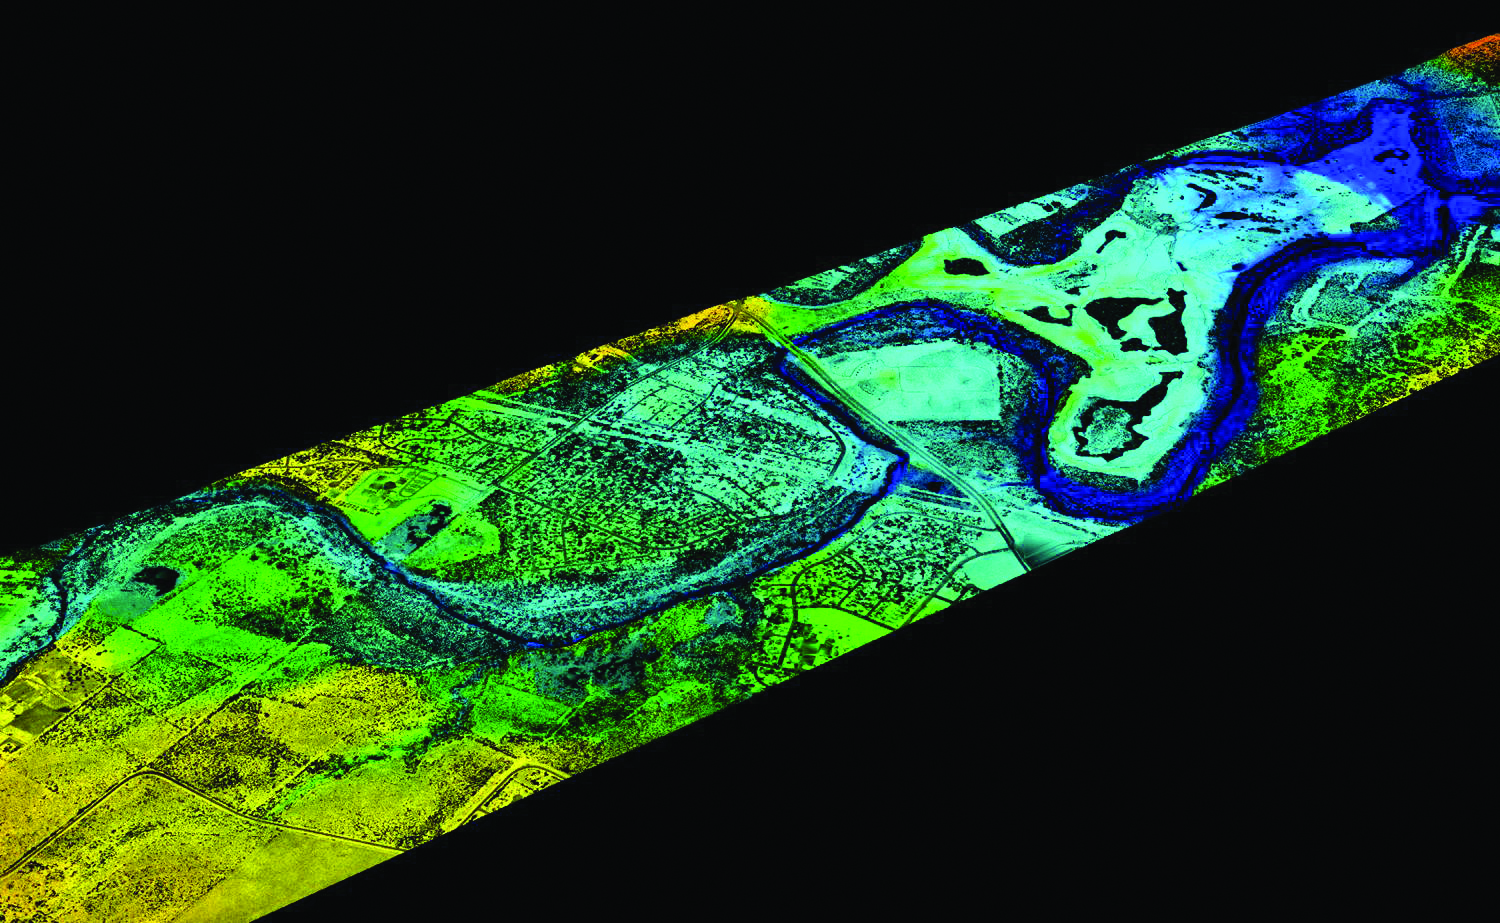
Lidar relies on laser technology, in which the instrument emits laser pulses toward ground surfaces, receives the reflected signal and stores the data. The system is mounted in an airplane, or sometimes a helicopter, and then flown at relatively low elevations, around 1,200 feet above the ground.
Near-infrared wavelengths detect topography, but the most sophisticated and newest lidar units, such as Chiroptera, also emit light in green wavelengths to measure bathymetry. The resulting digital maps and data weave together above-ground and underwater landforms and features down to an inch-by-inch resolution, and allow researchers to understand natural processes and changes at an otherwise unattainable scale.
“Lidar will show you things your eye cannot distinguish,” said Saylam.
Jackson School researchers bought the program’s first airborne lidar unit and began using the technology in 2000. The state General Land Office contracted with the Bureau to monitor the Texas Gulf Coast and measure beach erosion and recovery following hurricanes and major storms. Whereas on-the-ground surveys can take weeks, airborne lidar can gather spot-on data in just hours.
Young said the digital maps improved the pace and progress of coastal reconstruction by giving managers a relatively quick and very precise picture of geographic changes—on land, that is. The data stopped at the waterline since the original system wasn’t capable of providing bathymetric measurements, a major advance in recent years.
The school procured its new, state-of-the-art unit in 2011-2012 thanks to a grant from the General Land Office. Young and others customized the system specs to fit the Bureau’s needs, while also taking advantage of technical improvements that allow for quicker data collection and storage and greater resolution. Manufactured in Sweden by Airborne Hydrography AB, Chiroptera and its lasers and sensors fit in a square box about 2.5 feet long on each side. The unit weighs about 200 pounds, making it mobile and light enough to be used in many types of aircraft.
“We had an opportunity to push the scientific envelope, so to speak,” said Young, explaining that the new lidar system shoots up to 400,000 laser pulses per second, 20 times faster than the previous unit. “We can fly over, see right where the water line begins at the shoreline, and then measure below the water surface and stitch everything together in one image. It really changes what we can do.”
At the same time, the Bureau purchased a hyperspectral imaging system, a unit that also fits on an aircraft platform and complements the lidar in terms of data collection. Hyperspectral imaging uses reflected light at different wavelengths and intensities to collect a wide range of information, including vegetation and soil cover types, ground temperatures and mineral compositions.
Exclusively at the JSG
Saylam, a lidar remote-sensing expert who joined the Bureau to oversee lidar and surface mapping projects, said no other academic institution in the United States has a similar hyperspectral imaging unit. With the unrivaled airborne laboratory setup, Bureau and Jackson School researchers have already collaborated with federal and state government agencies, industry and other scientists eager to tap into the Jackson School’s resources—and play with its high-tech toys.
Working with industry partners in 2012, a group led by Jeffrey Paine, manager of the Bureau’s Near Surface Observatory, flew over and surveyed 490 square kilometers along Alaska’s North Slope.
A remote and ecologically sensitive area covered by permafrost, the North Slope is receiving attention for potential new energy production. The lidar and bathymetric surveys mapped and measured wetlands and kettle lakes. The rapid survey and unprecedented surface details will help managers better understand the overlap of energy and environmental resources and inform decisions on which areas to avoid or protect and which are better suited for exploration. During a previous field survey, researchers used rowboats and poles to manually collect data on 20 lakes during an entire season; the airborne lidar surveyed more than 200 lakes in six days, representing a huge advance in data collection. Another survey on the North Slope was completed this summer.
Saylam said the lidar system has since been used on nearly 20 different surveys in less than two years. In Nevada, scientists employed the system to map potential desert tortoise habitat around Las Vegas, identifying individual rock ledges and shrubs that are essential for young tortoises. Dave Mohrig, a professor at the Jackson School, teamed with the lidar group to measure the topography and bathymetry between islands within Louisiana’s Wax Lake Delta, which has been used as a case study in delta regrowth and recovery along the Gulf Coast.
In 2015, with funding from the National Science Foundation, Joseph Levy, a research associate at the Jackson School’s Institute for Geophysics, hopes to use lidar and hyperspectral imaging in Antarctica’s dry valleys to produce unprecedented, highly detailed maps that should vastly improve what scientists know about the hydrology of the freezing deserts of wind and ice.
In addition to the 2013 post-flood reconnaissance in Austin, the school’s lidar system has been used to map the growth of sinkholes in West Texas. The infamous Wink Sink 1 formed in 1980 and spans roughly 110 meters across and 34 meters deep, while Wink Sink 2 opened in 2002 and has grown to 137 meters wide and as deep as 250 meters.
Bureau researchers led an airborne lidar survey of the sinkholes and surrounding area in November 2013 and will use the data to create maps and estimate land subsidence rates around the geological hazards. The project, led by Paine, may even help scientists determine the causes behind the sinkholes and future risks.
“You can let your imagination run wild in terms of the types of questions that [lidar] can be used for, from assessing risk upfront to calculating damages after an event,” Young said. “Laser mapping as well as the imaging really increase the capacity of the school for doing research and answering science questions.”
[youtube l68ExPSnv1w?list=UU8aP7SKhS7z4YUJcc6AbsWg]
Back to the Newsletter