
Confidence Building: Computational Scientists Get a Grip on Uncertainty
June 12, 2009
“It’s tough to make predictions,” quipped baseball player and manager Yogi Berra, “especially about the future.”
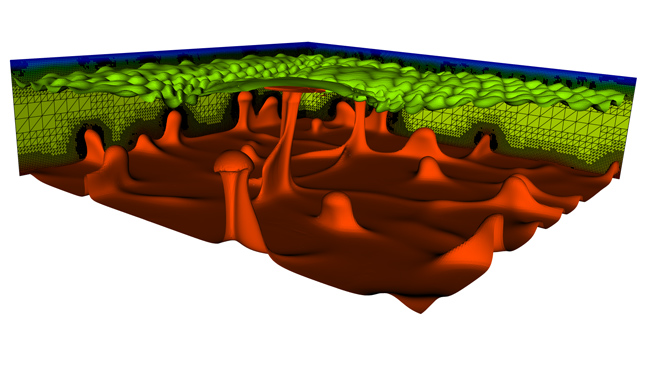
Scientists who use computer models to predict the future can relate. At every turn, they find themselves stymied by a little gremlin called uncertainty. They might be trying to predict what sea level will be 100 years from now, the effects of a hypothetical San Andreas earthquake, whether a heat shield on a spacecraft will survive reentry or where the best place is to drill for oil. Perhaps they just want to better understand some physical process such as ocean circulation or convection of molten rock deep inside Earth.
Yet uncertainty clings to their work like a sock to a staticky sweater in the drier. There are always gaps in the data that have to be filled in, biases and imprecision in the observations, a lack of understanding of the basic physics, differences of opinion on how to interpret proxy data and trade-offs made to save computing power.
Until recently, computational scientists did the best they could, they filled in missing data with what amounted to educated guesses, they nudged and jiggled and wrenched and kicked their models until finally the results seemed reasonable. They even ran the models thousands of times with slightly different inputs and averaged the results. Finally, they said, “Voila! This is the result.” Between the lines, they really meant, “This is my best guess.
| Burning Up
One of the most dangerous parts of a rondtrip mission to space is the reentry of the vehicle in Earth’s atmosphere. Ghattas is using a computer model to determine the chance that NASA’s new moon ship will survive. |
The problem is that it’s hard for the public or policy makers or even other scientists to evaluate just how much confidence they should place in a result, especially when it will be used to make tough decisions. In other words, is a particular scientist’s “best” good enough?
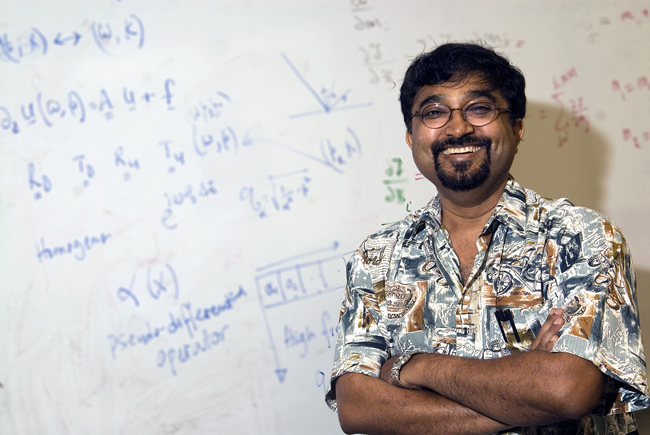
Now, scientists at the Jackson School of Geosciences including Omar Ghattas, Charles Jackson and Mrinal Sen are embracing uncertainty, looking it straight in the eye, taking its measure, tamping it down like a tourist atop an overflowing suitcase, sometimes even exploiting it to learn new things about the world.
With two of the most powerful supercomputers in the world, Ranger and Lonestar, and expertise in how to efficiently run complex geophysical models on them, they’re well positioned to do so. They say the emerging field of uncertainty quantification will give society the tools it needs to chart a course in the choppy seas of a nebulous future.
Making Models Relevant
According to Omar Ghattas, most standard geoscience computer models—called deterministic models—are designed to yield results as single numbers. For example, a result might be that sea level will rise by 1 meter by the end of the century or a certain size earthquake on the San Andreas fault will shake downtown Los Angeles with a certain maximum ground acceleration. Ghattas, a professor in geosciences and engineering and director of the Center for Computational Geosciences, says it’s extremely difficult to assess the validity of such a black and white result.
“In the geosciences, a deterministic result is not sufficient,” he says. “In fact, it’s giving the false illusion that you have perfect confidence in that number and the reality is we don’t. What decision makers really need to know is the level of confidence that we have in the predictions of the model.”
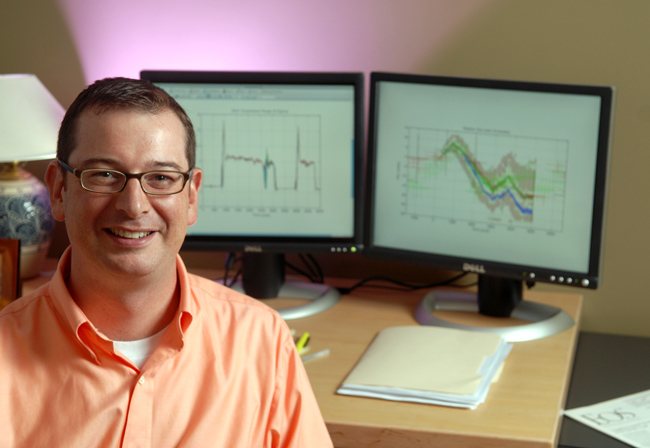
Charles Jackson, a research scientist in the Jackson School’s Institute for Geophysics, explores uncertainty in climate models. He’s particularly concerned about thresholds in the climate system, tipping points beyond which climate abruptly changes. He says ultimately he’d like to be able to make a prediction like the following: If global temperatures warm by 2.5 degrees Celsius, then there is a 30 percent chance that all of Greenland’s ice sheet will melt, leading to catastrophic global sea level rise; if temperatures warm by 4 degrees, then the risk rises to 70 percent.
“Then society has to decide what risk is acceptable or not,” says Jackson. “Do you want to not exceed the 30 percent likelihood of catastrophic sea level rise or perhaps 70 percent?”
One solution modelers have tried for assigning confidence is to compare the results of several different models, each with their own unique way of handling the same data and representing the same real world system. This approach was taken last year by the Intergovernmental Panel on Climate Change (IPCC)—an international group of climate scientists working to forge a consensus on climate research—to try and make some sense of several climate models that produced wildly divergent results for future global surface temperatures. The IPCC treated the spread of results as a measure of uncertainty.
“Unfortunately, this subjective measure of uncertainty is subject to peer-pressure,” says Jackson. “That’s more a measure of how comfortable people are to disagree. If a modeling group’s predictions are significantly different from what other groups are getting, there will be some amount of social discomfort and pressure to keep working.” He suggests a more rigorous approach to quantifying the sources of uncertainty.
Take a different example—earthquakes. The solution Ghattas is working on is to build uncertainty probabilities into the models at every step—from the rupture model, which deals with the dislocation at every point on the fault, to the propagation path and local site response, including the representation of density and stiffness of rocks. It’s an acknowledgement that there are always gaps and errors in the data and an incomplete understanding of how the world really works. Through careful study, researchers hope to understand which sources of uncertainty are the real troublemakers and which are benign. The product is known as a stochastic model.
Ghattas and his collaborators are using the method to study California earthquakes and are beginning to apply it to spacecraft reentry and to mantle convection modeling. In the future, he plans to extend the work to other problems such as modeling the flow of polar ice sheets and ocean circulation, in collaboration with scientists at the Institute for Geophysics. What makes the approach viable, he says, is access to advanced supercomputers.
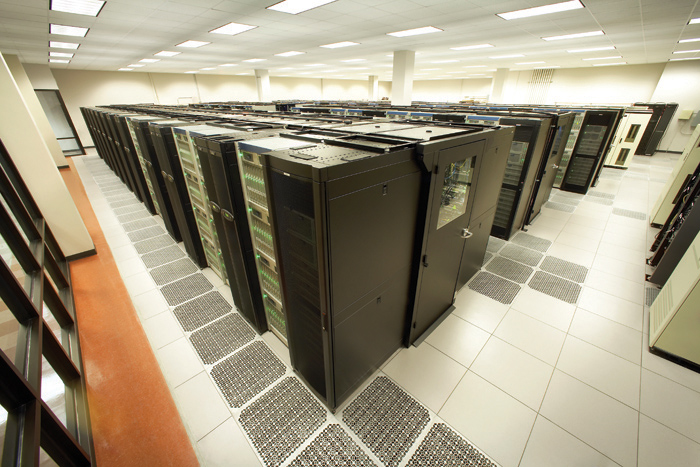
“This is going to be expensive,” in terms of computational resources, he says. “The only way to do it is by petascale computing.”
A petaflop, a measure of a computer’s processing speed, equals 1,000 trillion floating point operations per second. The university’s Texas Advanced Computing Center operates Ranger, one of the world’s most powerful supercomputers, which is capable of executing more than a half petaflop per second. As co-chief scientist for Ranger, Ghattas advises on how to make the most effective use of the computer to do science.
As Charles Jackson points out, uncertainty quantification isn’t just about assigning confidence to model results. It can also be used to sharpen our understanding of fundamental Earth processes and to make more robust models. To do that involves turning models on their heads.
Does it Hold Water?
When climate scientists began looking at ice cores drilled from the Greenland ice sheet in the 1990s, they were shocked to find evidence that during the past hundred thousand years, there were abrupt swings in climate. In just a few years, average temperatures would soar or plunge like a roller coaster by 15 degrees Celsius.
“Before then, we thought that climate changed gradually and smoothly,” says Jackson.
To explain this volatility of past climate, some paleoclimate researchers proposed that the culprit was an influx of freshwater into the North Atlantic ocean due to melting of polar ice sheets. The added freshwater would have shut down the global ocean conveyor belt, a circulation pattern carrying heat and salts on a continuous loop across the world’s oceans. If the conveyor belt stopped, so went the hypothesis, so would the heat carried to the surface of the North Atlantic, which would lead to ice age conditions in that region.
If that explanation is correct, then it could mean déjà vu all over again as the current period of human-induced greenhouse warming melts polar ice and injects more fresh water into the North Atlantic. In other words, it could mean one of the more outlandish and contradictory scenarios of global warming: a regional ice age for northeastern North America and northwestern Europe.
There was just one problem with the freshwater hypothesis: it did not seem to explain why scientists observed periods of abrupt warming in the past, also as a result of flooding the North Atlantic with melt water from polar ice sheets. Jackson and his colleagues decided to test the hypothesis.
There were two sources of uncertainty that made testing it a challenge. First, it’s hard to tell how much freshwater was going into the North Atlantic at any given time. Fossil corals give a rough idea of sea level over time and sea level changes can be attributed to changes in freshwater input. But the coral data are very sparse and scientists aren’t sure just how precisely they record sea level.
Second, there was uncertainty about how to represent with a computer model a feature of the ocean called vertical mixing, that is, the way heat moves up and down in the water column.
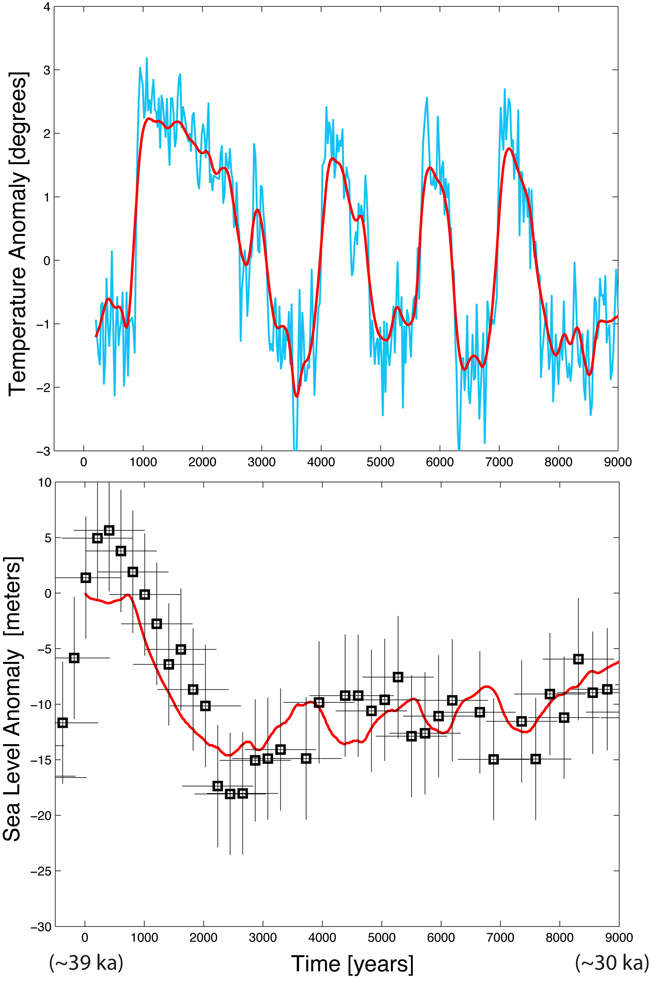
Rather than let the uncertainties stump them, Jackson and colleagues incorporated them into a simple game. It involved running a computer model of the oceans in reverse. In the technique, known as inverse modeling, the modelers start with some outcome, run the model backwards and determine what range of starting conditions could have led to the outcome. In this case, they began with some observations (surface temperatures reconstructed from 30,000 to 39,000 year old ice core layers) and used the model to derive possible inputs (sea levels) that could have led to the observations.
“You’re trying to find a freshwater forcing that agrees with your observations given a certain physics of the model,” says Jackson.
In the end, the team found that there were many possible pairs of freshwater inputs and vertical mixing variations that gave the observed temperatures. For one thing, that meant that concerns over how to represent vertical mixing in the models could be taken off the table. The uncertainties didn’t really matter much.
“We learned that vertical mixing did not impact our freshwater forcing solutions,” he says. Some researchers had feared that until vertical mixing was well understood, the freshwater hypothesis could not even be tested.
Another discovery was that sea levels could rise and fall in a way that both yielded the observed temperature record seen in ice cores and matched well with sea level reconstructions made by analyzing fossil corals.
“Low and behold, there was some agreement,” he says. “In particular where we had the greatest warming and longest time, our model agreed that sea level needed to drop 15 to 20 meters over 3,000 years.”
So, while their analysis doesn’t prove or disprove the freshwater hypothesis, it shows that it is certainly possible.
It also supports another hypothesis that might explain the abrupt warming seen in ancient climate records. Developed by Jackson’s former dissertation advisor, that hypothesis involves the way northern ice sheets behave. After an ice sheet collapses, there is a long period of rebuilding in which precipitation gets trapped and freshwater flow to the sea stops. Then once it grows beyond a stable size, it collapses and starts the process all over. There is a natural time lag in the system, but, according to the hypothesis, when the ice sheet is building up and there’s less freshwater flow to the sea, it eventually leads to a boosting of the ocean conveyor belt and a rapid warming at the surface.
A side benefit of Jackson’s analysis is that it could direct researchers where to go for more data to help reduce uncertainties. The results of the study were submitted to the journal Paleoceanography in February 2008.
Filling in the Gaps
Oil and gas explorers often find themselves searching in the dark, able only to see dimly if at all into the ground where hydrocarbons might be. Porosity, a useful indicator of their whereabouts and concentrations, is not an easy quantity to measure from the surface. Three-dimensional seismic imaging can provide a rough overview of a large region, but with very poor resolution. Wells can provide very high resolution information—from instruments lowered inside, extracted cores and production rates—but just in those thinly scattered vertical straws where they have been drilled, leaving vast gulfs in between unmeasured.
Mrinal Sen is a professor and Jackson Chair in Applied Seismology in the Jackson School’s Department of Geological Sciences and a research professor at the school’s Institute for Geophysics. Just as with Jackson’s climate work, he uses the technique of inverse modeling to tackle this problem. In this case, he runs in reverse what are essentially two models in one—a model based on the physics of seismic wave propagation and the other on the physics of fluid flow. Then he searches for the ranges of porosities that can satisfy both seismic and well observations.
It’s an iterative process. He starts by proposing a distribution of porosities that seems reasonable. Like picking numbers on a roulette wheel, the distribution is really just a guess. He inputs this distribution into the models, spins the wheel and compares the results to the seismic and well data. Depending on how well the model results match the seismic and well data sets, another hypothetical distribution is created and tried. And so on, until the results converge on a distribution of porosities that match the two data sets reasonably well. This process, called Markov Chain Monte Carlo, can be applied to many different systems.
“This is very simple,” says Sen. “This is what we do in our daily lives—we learn from experience and update our knowledge. Except for the fact that we want to quantify how much we know about a particular system.”
In the mid 1990s, Sen developed a version of this process that requires 100 times fewer steps to converge on possible solutions than earlier versions, making it possible to tackle far more complicated problems in the same amount of time. When Charles Jackson first came to the Institute in 2000 he and Sen began to use this technique to evaluate the uncertainties in climate models. Since then, the two have continued to refine the technique and apply it to new problems.
“The problem is that there is always more than one possible distribution that can fit the observations,” says Sen. “We want to know what are all the possible solutions that fit our data. That does not mean that the Earth is random. There is only one real solution. We just don’t have adequate data to pin it down.” Sen’s fast Monte Carlo technique could help indicate where more data needs to be collected in order to improve the picture of the subsurface.
Instead of presenting a reservoir engineer with one best fit distribution of porosities, he might be able to produce several good fits and give a level of confidence for each one. Armed with that information, the reservoir manager can estimate what kinds of flow rates can be expected under a certain range of uncertainties and decide where to drill, how many wells to drill and how to control the pressures.
Finally, Jackson suggests instead of trying to wish it away, scientists should make peace with uncertainty.
“My view is that it can be revolutionary to science and the way society interacts with science,” he says. “This is a necessary step for science to absorb the data it has and to improve the models and the ability to effectively communicate that knowledge to people who need to make sensible policy.”
by Marc Airhart
For more information about the Jackson School contact J.B. Bird at jbird@jsg.utexas.edu, 512-232-9623.