
Method Descriptions & Data Quality
Solution Mode ICP-MS
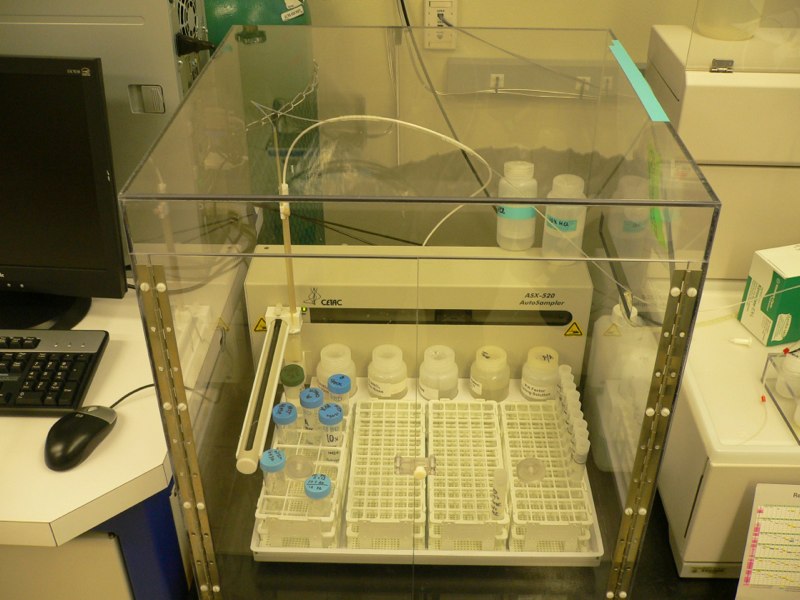
Two solution mode analytical methods were designed for this project. The first method was for analysis of major, minor, and non-REE trace elements ( Li, Mg, Al, Si, K, Ca, V, Mn, Fe, Sr, Mo, Ba, Th, and U) at both dilution levels (major and trace). The second method was for analysis of Y and the REEs and at the trace dilution level. All methods were run on an Agilent 7500ce Quadrupole Inductively Coupled Plasma Mass Spectrometer (Q-ICP-MS) with a collision reaction cell (CRC). Each of these methods was run for both the weak and strong acid digests at each dilution level indicated above. The specifics of each method are detailed below, as well as the optimized tune parameters for the instrument in each CRC mode.
Major-minor-trace elements
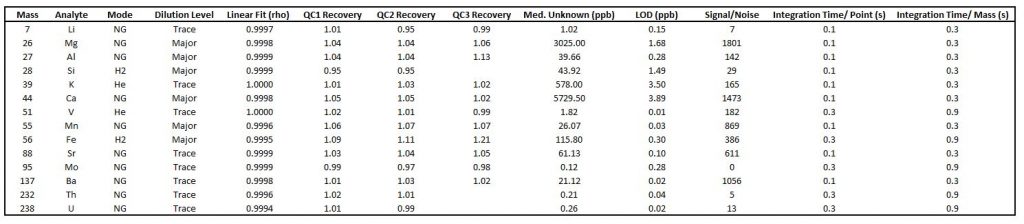
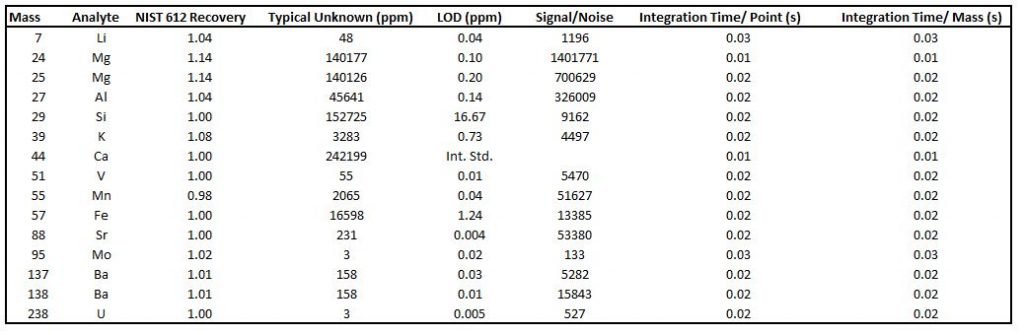
The target analytes and their integration times are listed in the table below. Also indicated is what CRC mode produced the best results (low QRSD, high signal/noise) for each analyte (No-gas, He, or H2 ), limits of detection, and the dilution level that produced the highest quality results. For a given sample, all target analytes were measured in triplicate by cycling through the targeted masses three times. The total acquisition time for each sample was 101 seconds (includes additional measurements not listed below), with a 50 second washout when switching from He to H2 mode, and a 20 second washout when switching between samples.
Solution Mode Major-Minor-Trace Target Analytes
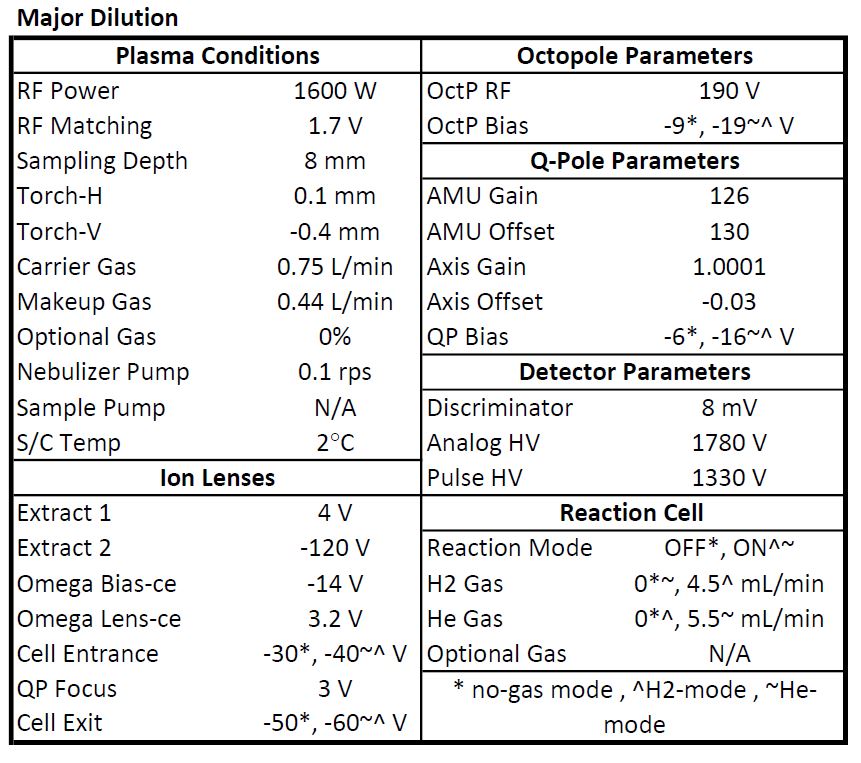
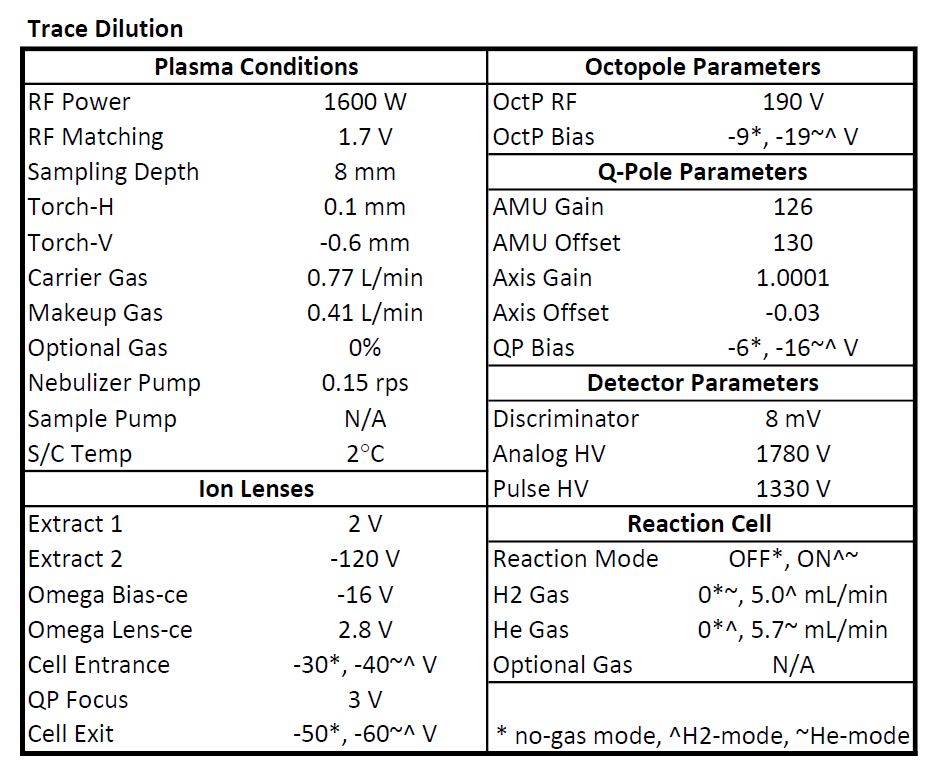
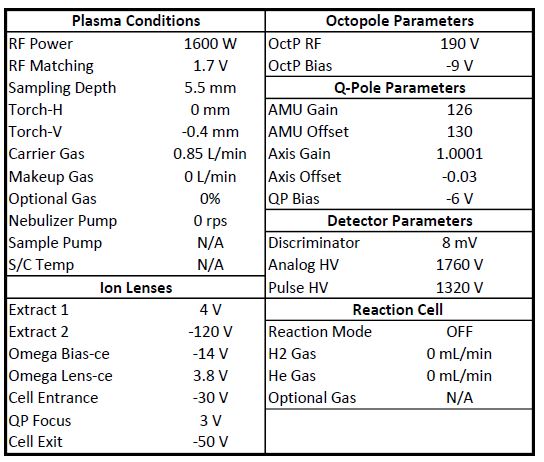
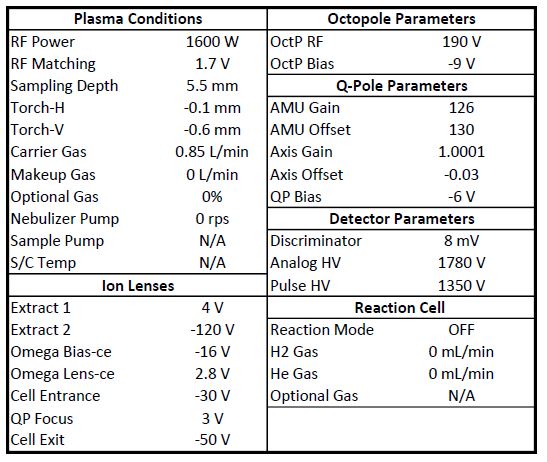
The analytical sequence consisted of running 6 calibration solutions (see “Sample Processing”), followed by three blanks, duplicate analyses of three QC/QA solutions, 2 blanks, and unknowns in batches of ten. In-between each batch of unknowns a QC/QA solution was analyzed bracketed by blanks. All unknowns were spiked with an internal standard solution consisting of Sc, Ge, In, Te, and Lu. Oxide production was monitored in no-gas-mode via the CeO+/Ce+ (156/140) ratio and minimized to be less than 1.25%. Sensitivity was optimized in He-mode such that 59Co (uninterfered) recorded 1000 counts per ppm, while reducing Ar-based interferences for 40K, and 56Fe. In H2-mode, the CRC gas flow rate was increased to reduce these same Ar-based interferences, while keeping sensitivity around 300 for uninterfered 59Co. Analyte recovery in all three quality control solutions (Q1, Q2, and Q3) was varied by ~2% from accepted values. Provided below are tables describing the ICP-MS parameters for both dilution levels, as well as a QC/QA spreadsheet.
Major-Minor-Trace Element Solution Mode ICP-MS Parameters
Solution Mode QC/QA Major-Minor-Trace Summary Workbook
Y + REE
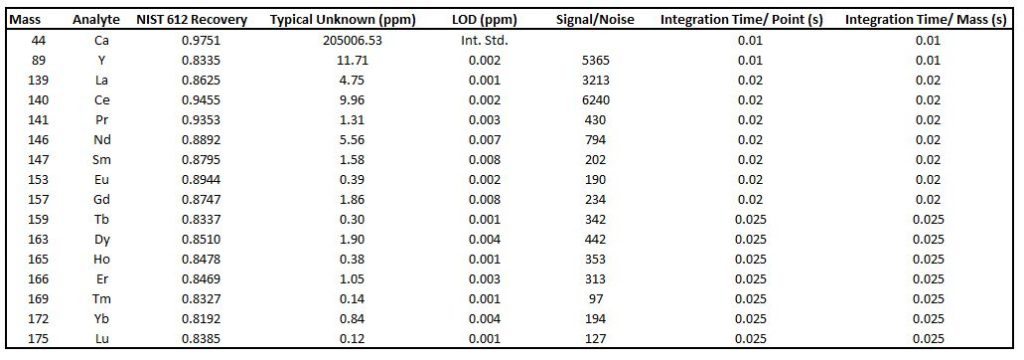
The target analytes for the Y+REE method are listed in the table below with their integration times and LODs. All target analytes were analyzed in no gas mode, and only trace diluted unknown samples were analyzed. As with the major-minor-trace element method, all masses were analyzed in triplicate through three cycles of the selected masses. The total acquisition time was 179 seconds for a given sample, followed by a 50 second wash-out period.
Solution Mode REE+Y Target Analytes
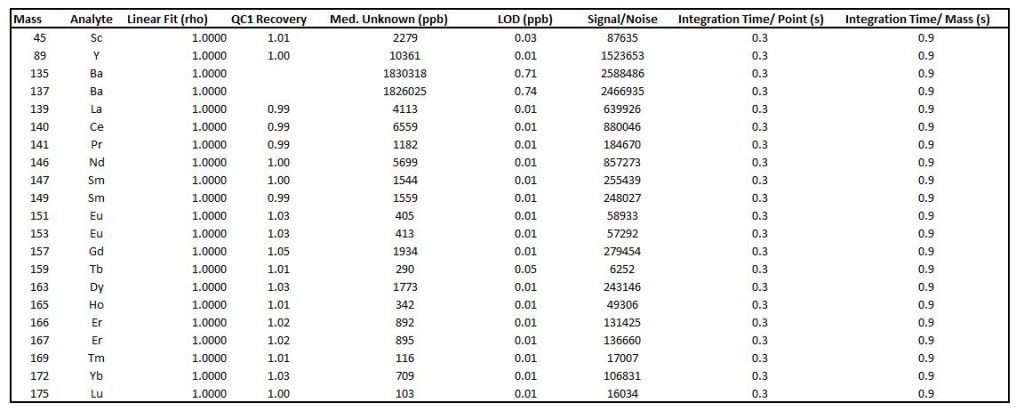
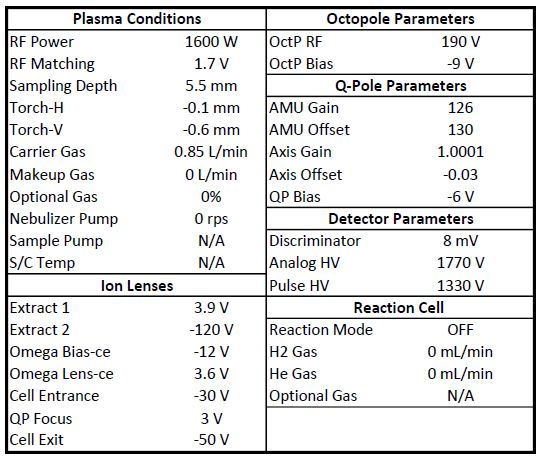
The analytical sequence for the Y+REE method had a similar structure to the major, minor, trace methods with a few differences. Only one QC/QA solution was monitored instead of three, and several 200 ppb calibration solutions of individual analytes (Ba, Ce, Pr, Nd, Sm, Eu, Gd, Tb) were also incorporated after the initial calibration solutions and blanks were run. All unknowns were spiked with an internal standard solution consisting of Ga, In, and Re. All target analytes were measured in no-gas mode, with oxide production once again monitored via CeO+/Ce+ (156/140) and minimized to be less than 0.95%. Sensitivity was optimized at ~1800 and 5100 for 7Li and 140Ce respectively. Analyte recovery in 10 ppb REE quality control solution (QC1) varied by < 1.1% for all analytes on average. Provided below is a table describing the ICP-MS conditions for the Y+REE method, as well as a QC/QA spreadsheet.
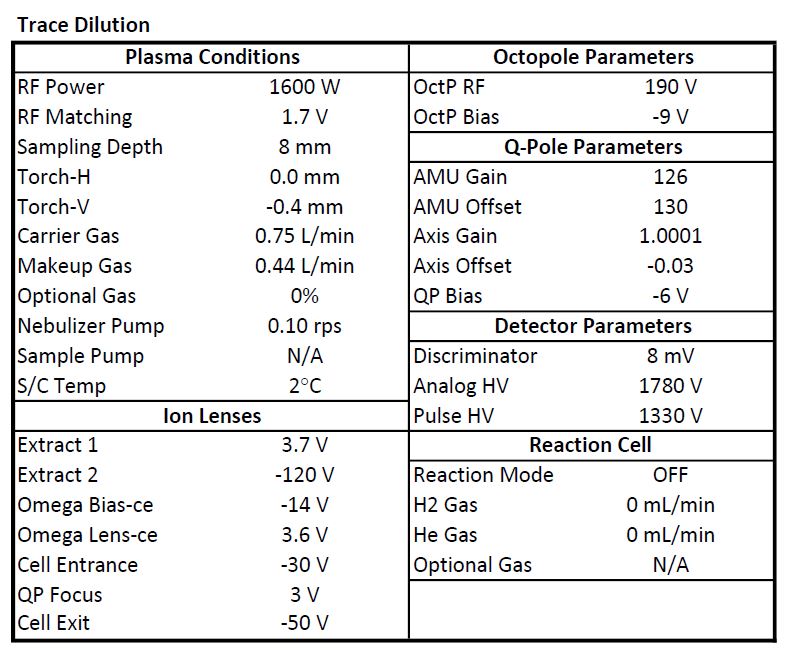
Solution Mode QC/QA REE+Y Summary Workbook
LA-ICP-MS
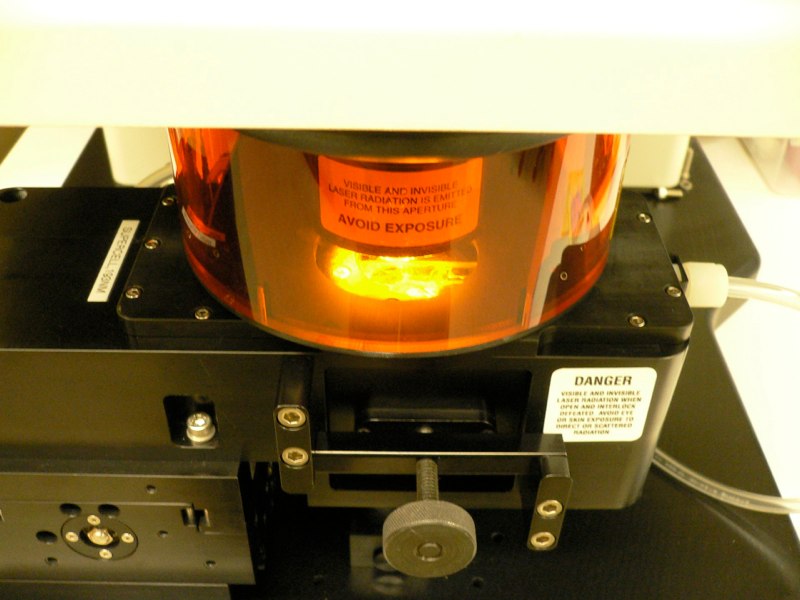
Laser ablation analyses consisted of two types: spots and line scans. Spot analyses for all target analytes (major, minor, trace, REEs) were analyzed using a single method. For line scans two methods were developed in a similar way to solution mode: one method for major, minor, and non-REE trace elements, and another method for Y and the REEs. All of these methods were run in a New Wave UP137FX laser unit with a 193 nm ArF excimer laser hooked up to an Agilent 7500ce Q-ICP-MS in no-gas CRC mode. 44Ca was measured as an internal standard for all methods. The reference value for Ca was determined from the bulk carbonate sample Ca concentrations as measured via the solution mode major-minor-trace method described above. The analytical sequence for laser ablation methods was triplicate analyses of NIST-612, triplicate analyses of MACS-3, unknowns, triplicate analyses of MACS-3, and triplicate analyses of NIST-612. MACS-3 and NIST-612 were also analyzed each in triplicate after every hour of unknown analyses. NIST-612 was used as a reference standard and MACS-3 was used as the calibration standard. The Q-ICP-MS parameters, laser parameters, and tuning process specific to each method are described below. Once collected, all data was processed using the Iolite software package to obtain the final values reported on the “Results” page (Paton et al., 2011; Woodhead et al., 2007).
Spot Analyses
Listed below are the target analytes with their integration times for spot analyses. Unlike the solution mode and laser ablation line scan methods there is not a separate method for Y+ REEs. All spot analyses were measured using the same method. Each spot designated for analysis was sampled in a single cycle of the selected masses. The total sampling period was 0.52 seconds, with 89% of that being analytical time.
Laser Ablation Spot Analysis Target Analytes
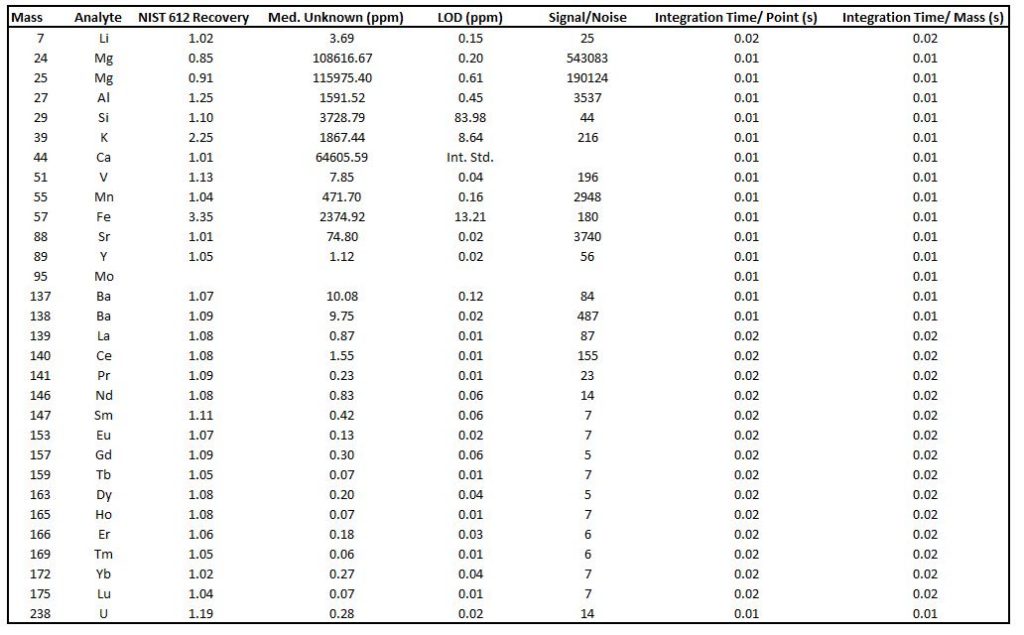
Oxide production was monitored by measuring the ThO+/Th+ (248/232) ratio and was optimized to be less than 0.35%. Sensitivity was optimized such that 141Pr+ was ~4000 counts/ppm. The laser was operated at 25% power with a fluence of ~4 J/cm2 and a laser pulse width of 10 Hz. He was introduced in the laser cell at a rate of 0.850 mL/min. The laser spot size was 100 microns. Analyte recovery in NIST-612 averaged within ~5% of GeoRem reference values, with the exception of Si, Al, and K, which are not certified in MACS-3. Fe also had poor recovery in our NIST-612 analyses. ICP analytical parameters are listed below, along with a QC/QA spreadsheet.
Major-Minor-Trace-Rare Earth Element Laser Ablation Mode Spot ICP-MS Parameters
Laser Ablation Spot Analyses QC/QA Workbook
Line scans: Major-minor-trace elements
For line scans, target analytes were split up in the same way as they were for solution mode. Each method required a slightly different instrument tune. The major, minor, and trace analytes for this first line scan method are listed below. For the major-minor-trace element method the sampling period for each analytical cycle was 0.34 seconds, 90% of which was analytical time.
Laser Ablation Line Scan Major-Minor-Trace Target Analytes
As for the laser ablation spot analyses, oxide production was monitored by measuring the ThO+/Th+ (248/232) ratio and was optimized to be less than 0.40%. Sensitivity was optimized such that 141Pr+ was ~4000 counts/ppm. The laser was operated at 30% power with a fluence of ~4.5 J/cm2 and a laser pulse width of 10 Hz. The laser spot size was 75 microns, and scanned along the designated line at a rate of 35 microns/second. He was introduced in the laser cell at a rate of 0.850 mL/min. Analyte recovery in NIST-612 averaged within ~3% of GeoRem reference values, with the exception of Si, Al, and K, which are not certified in MACS-3.
Major-Minor-Trace Element Laser Ablation Mode Line Scan ICP-MS Parameters
Line scans: Y+REE
The analytes remaining (Y+REE) were analyzed in line scans in a separate method. Ca was also included in this method because it is the internal reference standard. For the REE+Y line scan method the sampling period for one analytical cycle was o.38 seconds, 92% of which was analytical time.
Laser Ablation Line Scan REE+Y Target Analytes
Oxide production was monitored by measuring the ThO+/Th+ (248/232) ratio and was optimized to be less than 0.35%. Sensitivity was optimized such that 141Pr+ was ~8000 counts/ppm. The laser was operated at 30% power with a fluence of ~4.5 J/cm2 and a laser pulse width of 10 Hz. The laser spot size was 75 microns, and scanned along the designated line at a rate of 35 microns/second. He was introduced in the laser cell at a rate of 0.850 mL/min. Analyte recovery in NIST-612 averaged within ~13% of GeoRem reference values.
Laser Ablation Mode Line Scan REE+Y ICP-MS Parameters
The downloadable excel spreadsheet below is a compilation of the target analytes for each method with their QC recoveries, typical unknown concentrations, LODs, signal/noise ratios, and integration times listed.
References
Paton, C., Hellstrom, J., Paul, B.,Woodhead, J. and Hergt, J., 2011, Iolite: Freeware for the visualisation and processing of mass spectrometric data: Journal of Analytical Atomic Spectrometry, v. 26, no. 12, p. 2508-2518, doi:10.1039/c1ja10172b.
Woodhead, J., Hellstrom, J., Hergt, J., Greig, A., and Maas, R ., 2007, Isotopic and elemental imaging of geological materials by laser ablation Inductively Coupled Plasma mass spectrometry: Journal of Geostandards and Geoanalytical Research, v. 31, no. 4, p. 331-343, doi:https://doi.org/10.1111/j.1751-908X.2007.00104.x.