
Sample Processing
Solution Mode
Labware Preparation and Rinsing
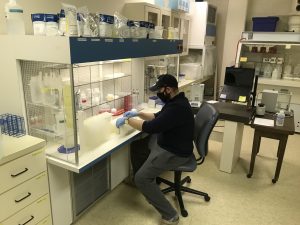
Efforts were taken to avoid operator-related contamination by using gloves, and avoiding working over or up-air flow of open sample container. To avoid labware consumable contamination during sample processing, microvials and sample tubes were cleaned thoroughly with high-quality reagents. Reagents used in this study consisted of trace metal grade acids (HNO3) and ultrapure (18.2 MOhm) water. All sample containers (polypropylene 1.5mL microvials/caps, 15mL sample tube/caps) were acid-cleaned and air-dried in a high efficiency particulate air (HEPA) filter workstation prior to usage. Acid cleaning consisted of filling 1.5mL microvials with 3N (HNO3) and then closing the vials with their caps and left untouched for 24 hours. After 24 hours, the vials are cleaned with a two percent (HNO3) solution. Once dried, they are closed until used for powder collection, strong acid digestion, collection of strong acid leachate, weak acid digestion, and collection of weak acid leachates. Larger sample tubes (15 mL) pre-filled with three percent (HNO3) are emptied and rinsed with type two, 18.2 MOhm nano-pure water, and left in a fume hood to air dry. The caps are also cleaned with two percent nitric (HNO3) and dried in the fume hood. Once dried, the sample tubes are used for strong acid trace element dilution, strong acid major element (Ca) dilution, weak acid trace element dilution, and weak acid major element (Ca) dilution.
Micro-drilling
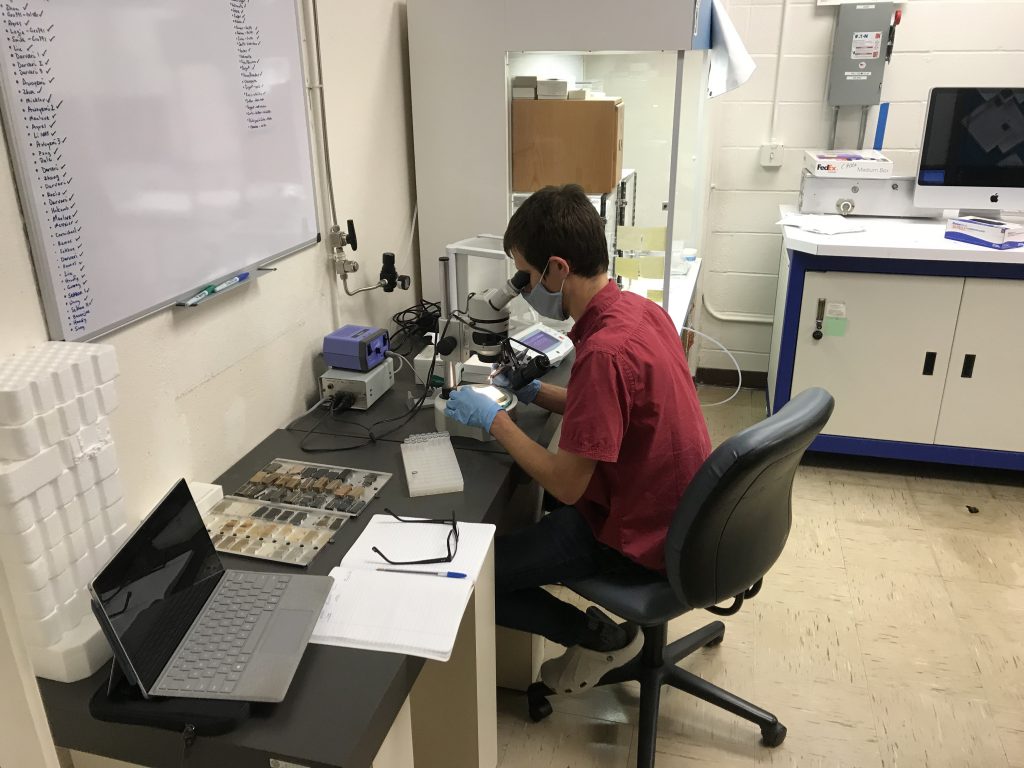
19 aliquots of at least 20 mg of powder from 13 targeted sample slabs were obtained via micro-drilling with a tungsten carbide drill bit. Navigate to the “Samples” page to see which samples were micro-drilled and exactly where powder was collected from on each. During the micro-drilling process contamination was minimized by carefully cleaning the drill-bit between usages. This involved wiping existing powder off with a Kimwipe, followed by a bath in 1 N HNO3, and a final rinse in ultrapure water. A quick blast with compressed Ar gas was then used to quickly dry off the drill bit. After cleaning, the drill bit was examined under a spectroscope for any remaining residual powder. The process was repeated until the drill bit was visually clean.
The primary strategy for powder collection was to drill a trench perpendicular to bedding planes that traversed the entire length of the slab to obtained a representative bulk carbonate composition. In some cases, areas of obvious alteration were excluded from sampling, or relatively thick homogeneous laminae were precisely targeted. A dropstone occurring is sample S5 (Rastof Formation) was also precisely targeted during the drilling process. Some samples were previously drilled and already had trenches fitting this sampling approach. Those trenches were simply re-drilled to obtained powder; whereas, new trenches were drilled in samples in which no prior drilling occurred. In both cases the areas designated for drilling were pre-drilled to condition the drill bit and remove any surface contamination. The powder obtained during this pre-drilling process was discarded, and the surface of the slab was blasted with compressed Ar gas to remove any adhering particles.
The drilling process for most samples lasted 5-10 minutes to acquire the necessary mass (at least 20 mg) of powder. Drilling motions were done consistently and evenly in an attempt to uniformly sample the entire length of the trench or area of a spot. The powder produced during drilling was typically ejected a sort distance from the trench and landed on the surface of the slab. Continued vibrations caused the powder to cascade off of the slab onto an underlying piece of weigh paper. After weighing, this powder was then transferred to a clean vial for dissolutions.
Strong Acid Leaching
To begin the strong acid leaching of samples, no less than 10 mg of each powdered sample was weighed out individually on an analytical balance and then transferred to precleaned 2 mL beakers. The recorded mass of transferred sample was the negative difference between measured mass on weigh paper and the measured mass of the weigh paper post transfer.
Then, 1.5 mL of 3N HNO3 was delivered via pipette. The samples were then loosely capped and placed on a slow rotator and allowed to digest for a 24-hour period. The following day, the samples were taken off the slow rotator and centrifuged at 13,000 rotations per minute for 5 minutes. The acid was then removed, taking care to not disturb the undissolved solid. The samples were then neutralized with 18.2 MW deionized water by adding approximately 1.5 mL to the vials then centrifuged at 13,000 RPM for 5 minutes for a total of 3 cycles. After the third cycle, the remaining water was extracted via pipette, again great care not to disturb the sediment, and placed under a fume hood to be air dried for 48 hours, at which point the weak acid phase of leaching could begin.
Weak Acid Leaching
The powdered samples (~10 mg) were weighed and transferred to pre-cleaned vials. The weight of the sample was recorded based on the difference between the weight of the vial after sample addition, and the initial weight of the sample.

The partial digestion of the powdered samples was carried by adding weak acid (0.348 M acetic acid) to each sample vial using a pipette. To target only the carbonate phase of each sample, first, the carbonate content of each sample was determined from the strong acid leaching step as the difference between the initial sample weight, and the residue weight. Subsequently the acid volume for each sample was determined by calculating the required acid addition to dissolve only ~80% of the total carbonate content of the sample. Such weakly, unsaturated acidic conditions prevent aluminosilicate dissolution, which was not a phase of interest in the current study. The estimated volume of acid was added to the sample vial using a pipette, and the vials weights were recorded after the addition of the acid. The Sample vials were loosely capped and placed on a slow rotator for approximately 24 hours, followed by centrifugation for 5 minutes at a speed of 11,000 rpm. The supernatant was recovered for ICP-MS solution mode analysis, and transferred to precleaned vials using a pipette. Insoluble residues were washed by adding ultrapure water to the vials followed by centrifugation for 5 minutes at 11,000 rpm speed, and decantation of the supernatant; three wash cycles were conducted. The samples were dried for 48 hours, and the final weights of the insoluble residues were recorded.
Sample Dilutions
The supernatant from both the strong and weak acid digests was diluted for trace and major element analyses assuming a pure CaCO3 stoichiometric composition of our samples. To prevent instrumentation damage, while also obtaining good signal for trace elements, the dilution factor for the trace element analysis was set such that Ca was ~200 ppm. This required ~2000x dilution of the leechate solutions. For the major element analytical solution an even greater dilution is required to achieve good counting statistics. A Ca concentration of 10 ppm was targeted for the major element analytical solutions, which required a dilution of~40,000x of the leechate solutions.
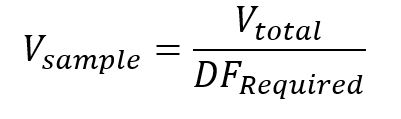
The dilution process starts with the initial dilution factor of the dissolved sample, which is described below.
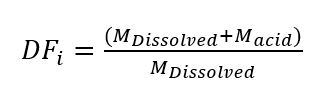 Equation 1
Where M is the mass of either the acid added to the solution or the powder dissolved in solution consistent with the assigned subscripts. The necessary additional dilution required to obtain 200 ppm for the trace element analytical solution was determined via equation 2.
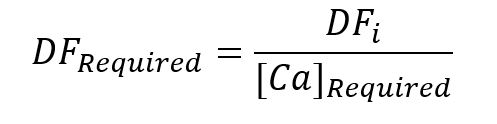 Equation 2
The final volume of each unknown solution was targeted to be 2.5 mL. Dividing the required dilution factor by this target volume results in a target volume of the leeched supernatant to mixing with 2% HNO3 to achieve the required dilution (Equation 3).
Equation 3
The targeted volume of 2% HNO3 required to dilute the sample volume is calculated using equation 4.
![]() Equation 4
Equation 4
To precisely determine how much sample and dilutant were mixed together the proportions of each transfer were gravimetrically determined with a balance precise to six significant figures. The actual volume of both the sample and dilutant transferred are calculated via mass balance with the known densities (variable D with corresponding subscripts) of acids used in the dissolution process (3 N HNO3 for strong dissolution; 0.345 N CHCOOH3 for weak dissolution) as well as the dilutant (2% HNO3).
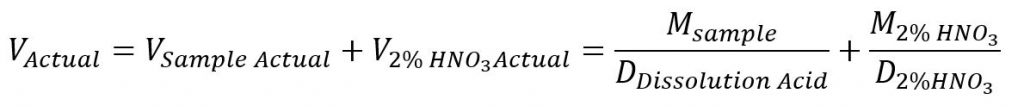
Equation 5
The actual dilution factor of the solution from the initial supernant was then determined by equation 6.
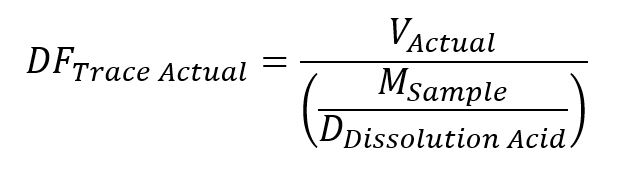 Equation 6
The net dilution factor is then the product of equations 1 and 6. This dilution process is largely the same for both the trace and major dilutions; however, there are a few differences. Since the major dilution is a further dilution of the solution prepared for trace element analysis, the starting dilution factor will be aggregate of the initial dilution factor and the trace dilution factor. Alternatively, the calculations can be carried out knowing that the trace dilution must be further diluted by 20x to get from 200 to 10 ppm Ca. Additionally, the density of the dissolution acid used in equations 5 and 6 is replaced with the calculated density of the trace diluted solution the actual volume (equation 5) and the total mass added. With these changes equation 6 will be computed as actual major dilution factor for the second set of dilutions. The overall dilution factor for the unknown major element analytical solution is then the product of the actual trace dilution factor and actual major element dilution factor.
To minimize contamination during solution transfer pipetting of solutions was done in a hepafiltered laminar flow workspace. Pipette tips for transferring unknowns were triple washed in 2% HNO3 prior to sample transfer, and discarded after use on an individual solution. Trace element dilutions were carried out first by extraction of sample from the leechate supernatant vials in the prescribed amounts. For the strong acid these aliquots were transferred using a 1000 microliter pipette in a single aliquot of ~100-200 microliters. For the weak acid dilutions the aliquots were transferred using a 100 microliter pipette to increase precision. Typically, weak acid dilutions required ~50-250 microliters of solution transfer, so some of these transfers were delivered in two segments. The transferred samples were then diluted ~2.250-2.450 milliliters of 2% HNO3 using a 5 milliliter pipette. This pipette tip was reused for all samples after an initial triple washing since it only ever came into contact with the dilutant. After the required dilution, measurements, and calculations were made the sample was mixed using an agitator. The major element dilutions were carried out by further diluting an aliquot of the trace element diluted solution following the exact same procedure.
Provided below is a downloadable excel workbook documenting all the aforementioned measurements and calculations for both the trace element and major element dilutions of the strong and weak acid leechates.
Dissolution and Dilution Workbook
Preparation of Calibration Standards
Major-Minor-Trace calibration standards preparation
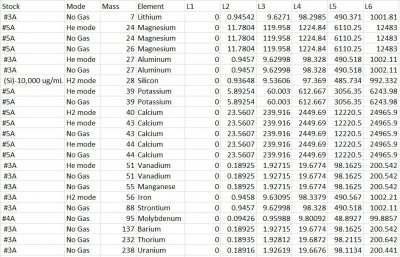
We used four different stocks obtained from VHG Labs and 2% trace metal grade nitric acid for the major-minor-trace calibration standards preparation. Stock 3A (custom 1301 standard #3A) contains concentrations of elements Ag, Al, B, Ba, Bi, Cd, Co, Cr, Cs, Cu, Fe, Li, Mn, Ni, Pb, Rb, Se, Sr, Th, Ti, U, V, Zn, and Zr. Stock 4A (custom 902 standard #4A) contains concentrations of Mo, Sb, Sn, Sb, and Ti. Stock 5A (custom 903 standard 5A contains concentrations of Ca, K, Mg, and Na. In addition, a single element heavy concentrated stock of Si was used to obtain Si standard values and was diluted 100X. Not all element concentrations were used for this project. Desired analytes are shown in (Final-Major-minor-trace-element results) spreadsheet. Taking into account information showing our samples being carbonates, our calibration range was established to 200 ppm or less of calcium. We accomplished a safe trace element dilution but had to achieve a more diluted major elements dilution.
Dilution Factors:
Si Stock: 100.30
3A Stock: 99.78
4A Stock: 200.23
5A Stock: 400.55
5 Serial dilution were created, and the sixth dilution only contained 2% nitric acid. The values obtained from the serial dilutions are shown in (Final-Major-minor-trace-element results) spreadsheet. The final major-minor-trace calibration table is shown below.
Analyte/Element Standards Concentrations
Link to the spreadsheet: Final-Major-minor-trace element results
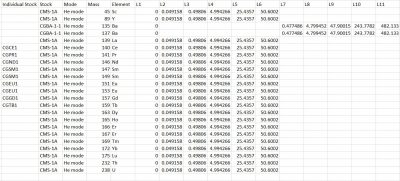
Y and REE’s calibration standards preparation
For the Y+REE calibration standards preparation, we used nine different stocks obtained from the vendor Inorganic Ventures and 2% trace metal grade nitric acid. Stock CMS1 contains concentrations of elements Sc, Y, REEs, Th, and U. The other stocks used for this project consisted of single element stocks representing the REEs and Barium. CGBA1-1 contains Barium, CGCE1 contains Cerium, CGPR1 contains Praseodymium, CGND1 contains Neodymium, CGSM1 contains Samarium, CGEU1 contains Europeum, CGD01 contains Gadolinium, and CGTB1 contains Terbium.
For stock CMS-1A, five serial dilutions were made and also filled a tube L1 with nitric acid. Dilution factors decreased from 200 to 10 as the calibration standards were made. More detailed dilution steps for this stock are shown in the (Final Y+REE element results) spreadsheet.
Stock CGBA1-1 is heavily concentrated with Barium so two dilutions had to be made first. The first was a 50X dilution, and the second was a 40x further dilution to create L11. After the initial dilutions, four more serial dilutions were made. More detailed dilution steps for this stock are shown in the (Final Y+REE element results) spreadsheet.
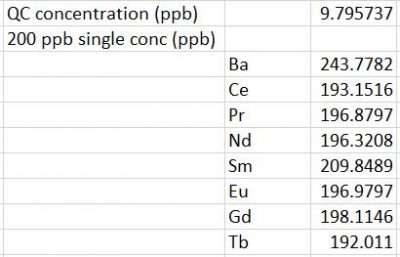
In order to make 200 ppb single element standards, two dilutions were required with the single element stocks for the REEs. The first initial dilution requires a 100X dilution, and the second dilution required half of the first dilution to make 200 ppb single-element standards. More detailed dilution steps for the single element stocks are shown in (Final Y+REE element results) spreadsheet.
Analyte/Element Standards Concentrations
Link to spreadsheet: Final-Y+REE element results
Laser Ablation
Thin sections of targeted lithologies from our localities were selected for in situ compositional analysis via laser ablation. The objective of this more precise sampling was to target areas on the microscopic scale that appear to be free of oxide or hydroxide precipitates or obvious signs of alteration. Some points in zones of obvious alteration were also designated in order to constrain how alteration may chemically affect samples where none is visually present. Additionally, line scans perpendicular to bedding (geometrically similar to the trenches drilled for solution mode analyses) were also designated for determination of microscopic stratigraphic heterogeneities. At least one thin section from each locality was selected for this analysis. For the Mirassol D’Oeste Formation no slabs were available for micro-drilling. Therefore the in-situ analyses will also be used to determine an overall bulk composition for samples analyzed from that formation. Pictured below is the sample shelf loaded into the laser cell with the location of line scans marked on each sample. Individual points selected for analysis are shown in more detail on the “Samples” page.
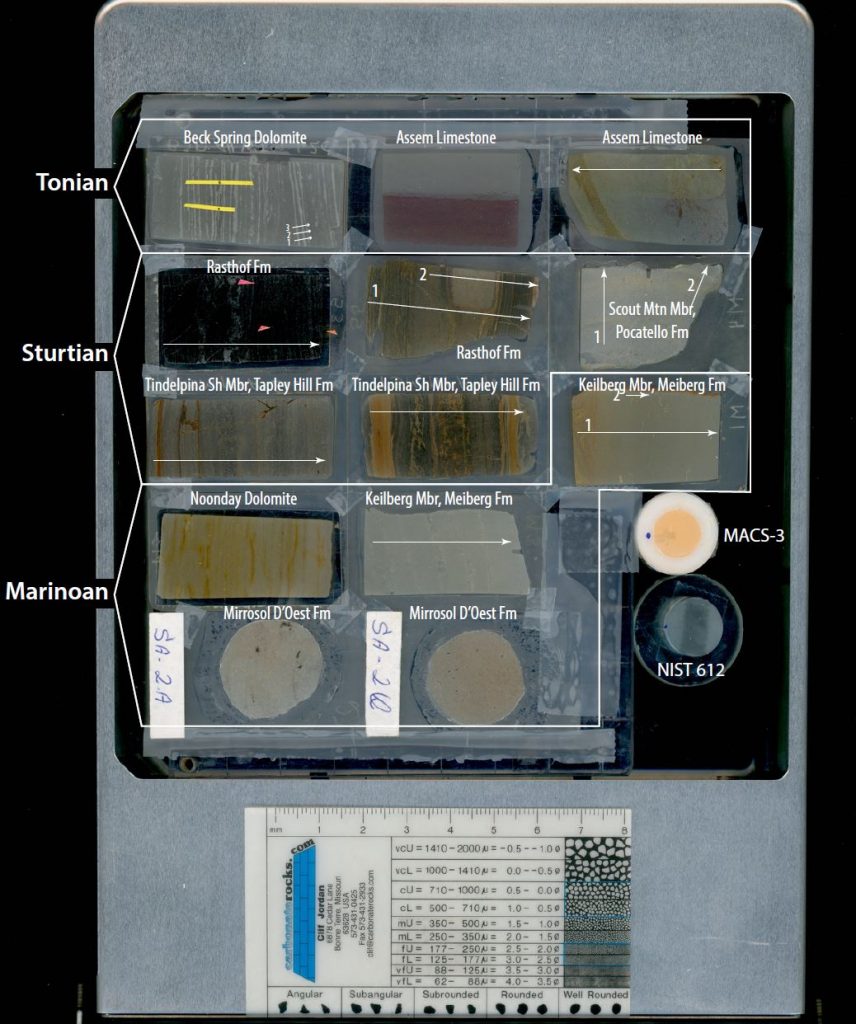
Also shown in the picture above are the two standards used for calibration: USGS MACS-3 and NIST 612. MACS-3 was used for primary calibration, whereas NIST 612 was analyzed to affirm the accuracy of the primary calibration. All designated surfaces for laser ablation were pre-ablated prior to actual measurement to removal any surface contamination that may have been present. All spots and lines designated for analysis were pre-ablated with the laser to remove any surface contamination prior to analysis.