
Results
Major and Minor Elemental Composition
Solution Mode
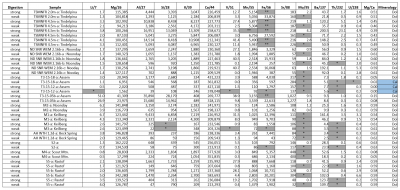
Major and minor components (in ppm) present on micro-drilled samples are shown below for solution mode ICP-MS. (*) Represents values below limit of detection, and (**) represents values above calibration range. The following cations were analyzed using the major element diluted solutions: Mg, Al, Si, K, and Ca; remaining cations were analyzed using the trace element diluted solutions. The weak acid digestion yielded an average recovery of ~65% of the soluble content of samples. The lower material recoveries (less than 80%) are attributed to slower dissolution rates associated with dolostones, the major phase of most samples.
Laser Ablation Spots
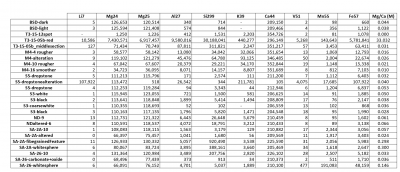
The average values for major and minor components present in laser ablated spots (in ppm) are shown below. The complete data for each spot analyzed can be found in the following spreadsheet:
REE Diagrams
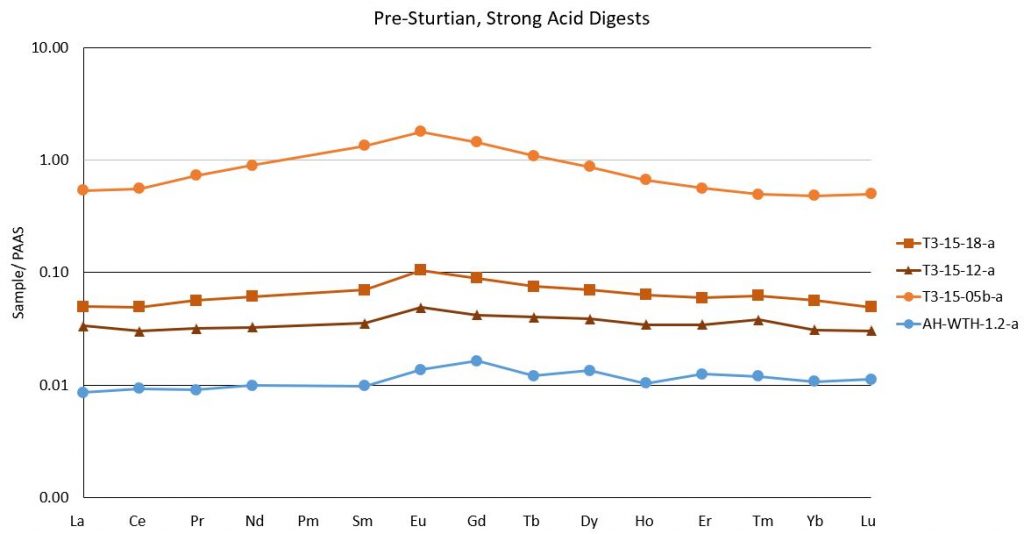
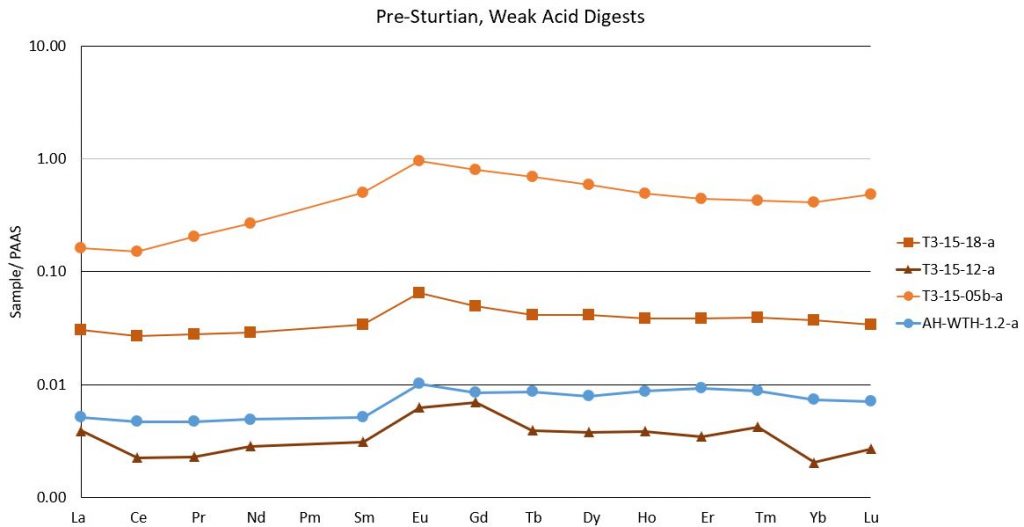
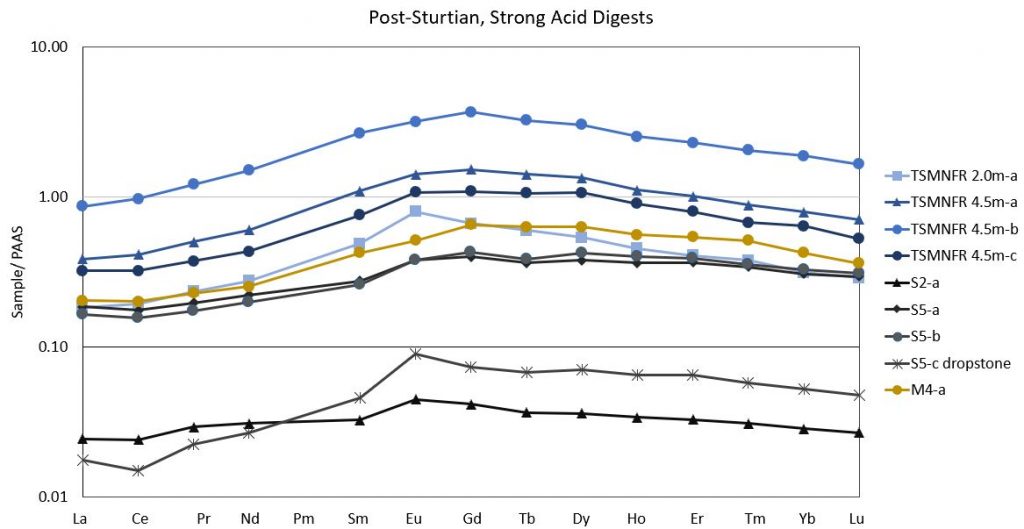
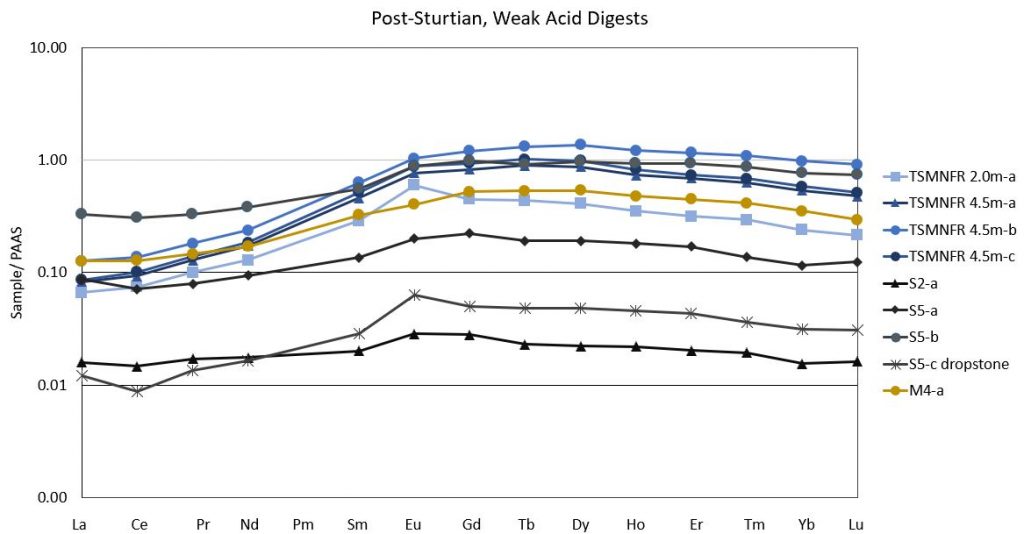
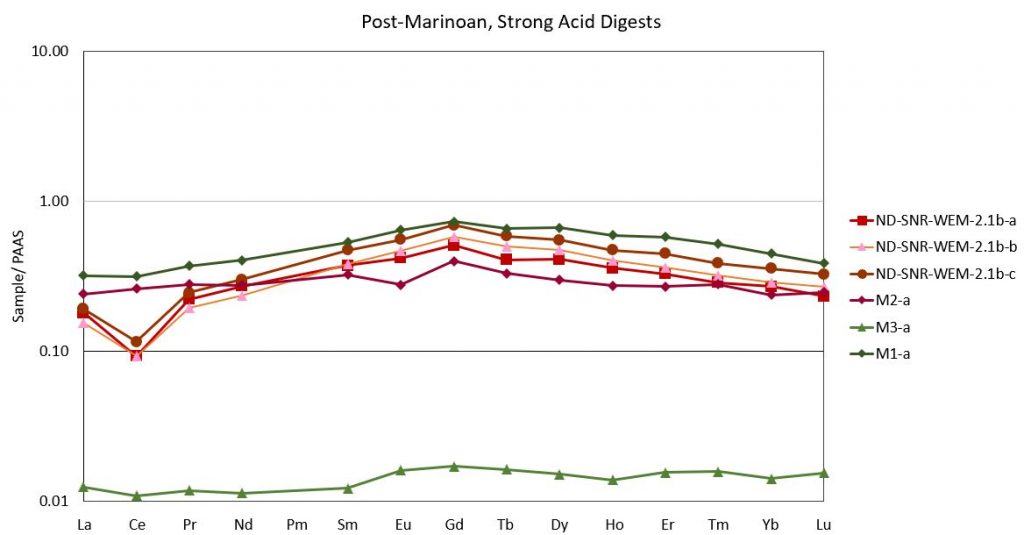
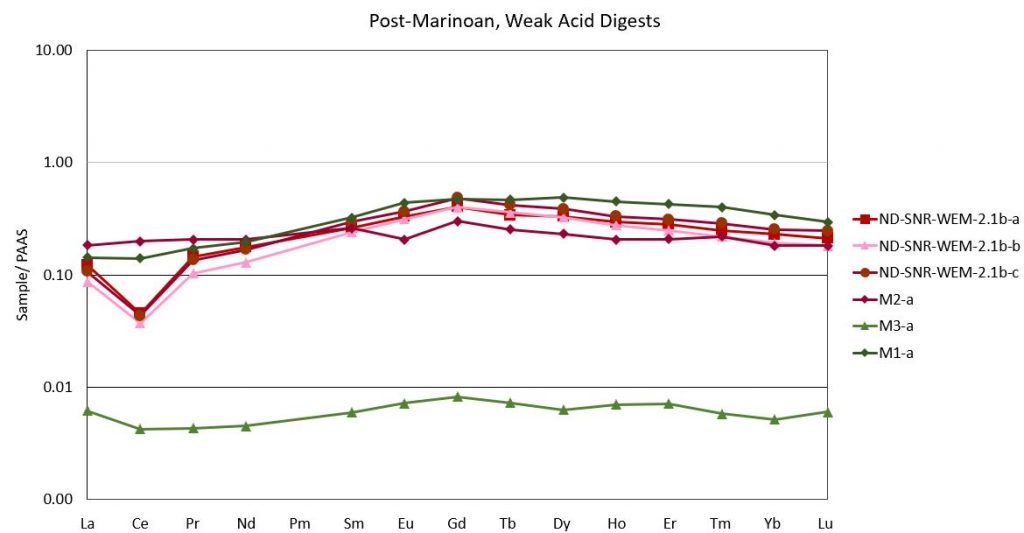
All sample concentrations are normalized against Post-Archean Australian Shale (PAAS). Solution mode data represents bulk carbonate analyses from a trench drilled across the length of the sample. Laser Ablation spot data plotted are averages of spot types for a given sample, i.e. dark laminations, light laminations, ect. The data below is organized by age group ( Pre-Sturtian, Post-Sturtian, Post-Marinoan) with each locality represent by shades of a particular color. Our interpretations of these data are presented following the figures in a given subsection.
Solution Mode
Here, values reported from both our strong and weak acid digests are reported. The weak acid digest results more accurately reflect the measured carbonate concentration, as the strong acid digests incorporated some degree of aluminosilicate material. Concentrations that were measured below the detection limit are plotted at the limit of detection value for purposes of pattern interpretation. For interpretation of these diagrams see the “Discussion” page.
Normalized Y-REE Results (Solution Mode)
Pre-Cryogenian
Assem Limestone= orange; Beck Spring Dolomite=blue
Post-Sturtian
Rasthof Formation= Black, Tindelpina Shale= Blue, Yellow= Scout Mountain Member
Post-Marinoan
Noonday Dolomite=Red/Pink, Keilberg Formation= Green
Laser Ablation Spot Analyses
Presented below are the average REE concentrations for sets of spot analyses from a particular sample. Each set of spots was designated for similar textures and/or colors that were observed microscopically. Obviously altered areas are also reported below. The main objective here is not necessarily to make correlations, but to see how the bulk rock solution mode REE patterns may have been influenced by alteration, aluminosilicates, and other contamination. An exception to this is for the Mirassol D’Oeste samples, in which the spot data is used to test for correlations with the solution mode data from other Post-Marinoan cap carbonates. A workbook with the calculated averages plotted on the REE diagrams below is provided here. Note that spot analyses are not available for all localities or samples analyzed in solution mode.
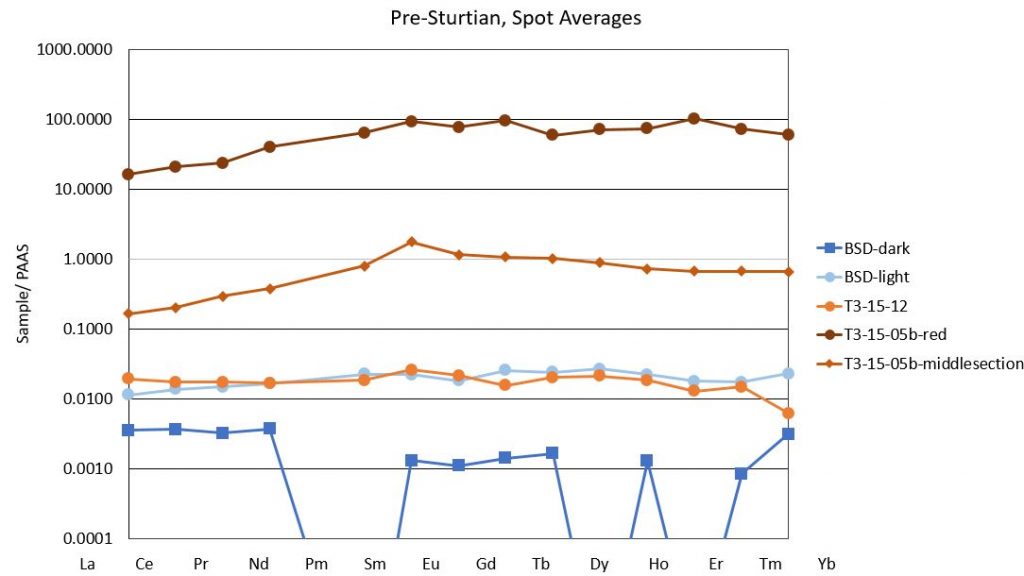
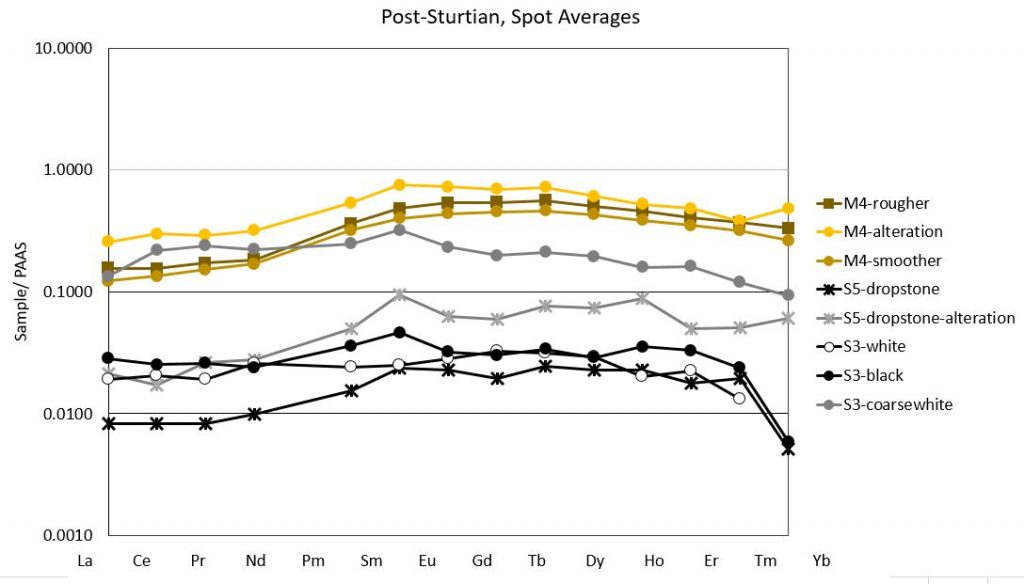
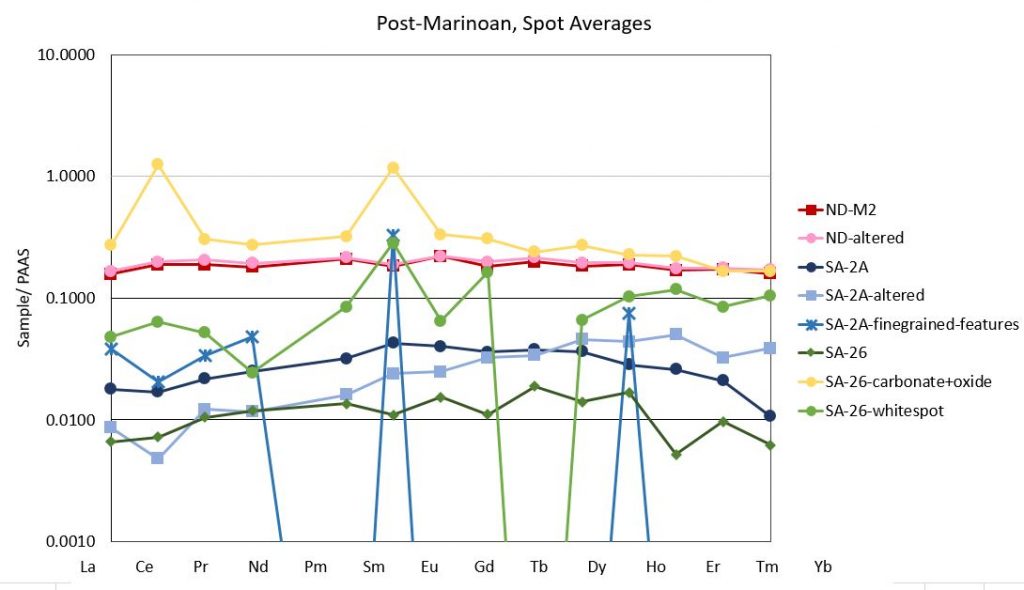
Laser Ablation Spot Analysis PAAS Normalized Averages
Pre-Sturtian
Post-Sturtian
Post-Marinoan
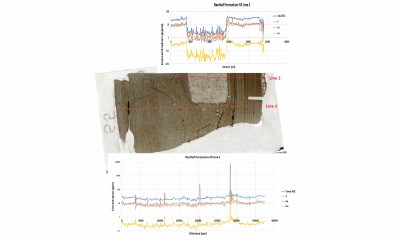
LA-ICP-MS Line Analysis Chemostratigraphy
The LA-ICP-MS method is capable of assessing spatial chemical variations in solid samples, such as elemental composition changes in laminations or in this case how the dropstone in the Rasthof Formation varies compared to the surrounding cap carbonate matrix (images below).
Rasthof Formation
Line 1 (red transect) from sample S5 (Rasthof Formation) contains a uniform distribution of REEs concentration across the ablated transect with occasional high REEs concentration peaks. These high REEs concentration peaks may represent increases in REE content or evidence of poor sample preservation in those areas/laminations. Compared to line 2 (red transect) through the dropstone, the analysis shows a notable decrease in REEs concentration in comparison to the surrounding cap carbonate matrix shown in line 1. This decrease in REE concentration is due to the dropstone containing a minor negative cerium anomaly, suggesting the shallow marine environment in which it formed was moderately oxidizing. The surrounding cap carbonate matrix does not contain a negative cerium anomaly, showing the depositional environment was likely reducing most likely due to a long period of ice cover or upwelling of deep ocean waters.
Beck Spring Dolomite
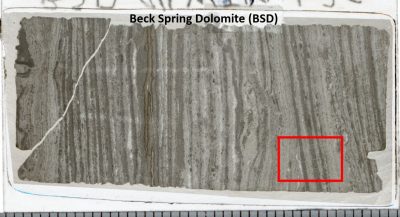
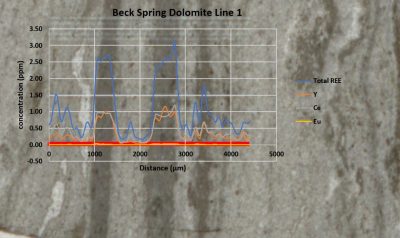
The Beck Spring Dolomite (BSD) line 1 (red transect) shows REE concentration variations in light vs. dark laminations. Darker laminations contain more Total REEs in comparison to the light laminations suggesting frequent changes in water composition in this shallow marine environment. These frequent changes in chemical composition may be due to deeper waters enriched in REEs periodically upwelling onto the shallow shelf area where there is evidence of forming microbialites.