Results

REAGENTS UTILIZED
All chemicals were of analytical grade unless noted otherwise and were used as received. Concentrated nitric acid (HNO3, 70%) and HCl, both trace metal-grade, were used for digestion of aminoboration samples. A 2% HNO3 solution prepared using nitric acid certified for trace element analysis and ultra-high purity water (18MΩxcm) were used to prepare all ICP-MS samples.
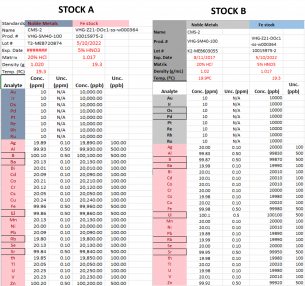
The two standard stock solutions used are shown in Table 1. Stock A was used in preparing the calibration curve while stock B was used in making the quality control. Single-element standards were used in preparing the internal standards, composed of Sc at 2000 ppb and Ge, Rh, Bi, and In at 400 pb, respectively. Images and Table 1 below show the information for each standard solution.
Table 1: Concentrations in ppm for each component in Stock A and Stock B for calibration curves and quality controls, respectively.
METHOD SEQUENCE
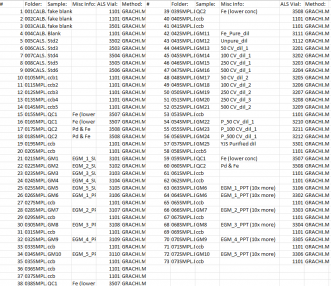
Find below in Table 2 the method sequence used during the ICP-MS operation in sample analysis. Subsequent to running the initial precipitate sample (026SMPL.D#) the concentration was determined to be >200 ppb. Therefore, the following precipitate samples (028-034SMPL.D#) were removed, and diluted 10-fold for analysis at the end of the sequence and found to contain appropriately dilute ppb content. Note also that QC1 and QC2 labels were mistakenly swapped when inputting the sequence, therefore, QC1 corresponds to that of Fe(lower conc) and QC2 corresponds to Fe & Pd.
Table 2: Method sequence for analysis on ICP-MS.
CALIBRATION STANDARDS
The analytes of interest were quantified using a calibration curve generated from multi-elemental standards and as shown in Figure 2, with plots displaying linearity with a high coefficient of determination.
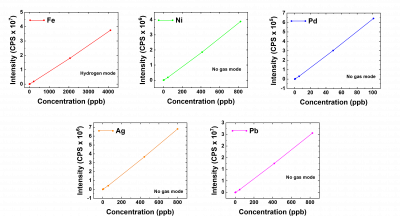
Figure 2: Calibration curves for measured analytes in varying modes. The fit parameters are summarized in Table 3.
Table 3: Determination of degree of fit for element calibration curves. The fit equation is given as Y = ax +b where Y represents the intensity (cps) and x is the concentration of the analyte (ppb). DL means Detection limit and BEC is the background equivalent concentration.
| Mass | Element | r | a | b(blank) | c | DL | BEC | Unit |
| 56 | Fe | 0.9990 | 3.34E-02 | 5.63E-03 | 0 | 8.33E-02 | 1.68E-01 | ppb |
| 56 | Fe | 0.9990 | 7.85E-03 | 1.68E-03 | 0 | 4.63E-02 | 2.14E-01 | ppb |
| 60 | Ni | 0.9991 | 1.52E-03 | 1.66E-04 | 0 | 6.12E-02 | 1.09E-01 | ppb |
| 105 | Pd | 0.9990 | 1.72E-03 | 1.31E-05 | 0 | 6.78E-03 | 7.60E-03 | ppb |
| 107 | Ag | 0.9996 | 2.51E-03 | 1.42E-05 | 0 | 6.16E-03 | 5.67E-03 | ppb |
| 109 | Ag | 0.9981 | 2.30E-03 | 1.33E-05 | 0 | 8.55E-03 | 5.77E-03 | ppb |
| 206 | Pb | 0.9991 | 2.13E-03 | 1.09E-05 | 0 | 5.05E-03 | 5.14E-03 | ppb |
| 207 | Pb | 0.9990 | 1.83E-03 | 7.44E-06 | 0 | 4.43E-03 | 4.07E-03 | ppb |
| 208 | Pb | 0.9991 | 8.38E-03 | 3.88E-05 | 0 | 5.84E-03 | 4.63E-03 | ppb |
Analytical figures of Merit
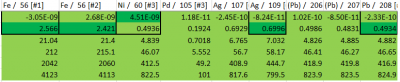
An internal standard is useful in monitoring analyte recoveries in situations of instrumental drift. The choice of internal standards is based on similarities between the mass and ionization energy of elements. In this study, the internal standard that is used for 56Fe, 60Ni, and 208Pb was 45Sc, 72Ge, and 209Bi respectively while 103Rh monitored 109Ag, and 105Pd. The recoveries of the internal standards were remarkable as shown in Table 4. Table 5 shows the range of calibration standards that encompassed each analyte, with the concentration rows corresponding to blank, then standards in increasing concentration moving down the column. While the calibration curve accounted for the 56Fe, 60Ni, 109Ag, and 208Pb, most analyte concentrations were exceedingly low and were within the range of the calibration blank and lowest concentration standard. Ideally, calibration curves for these analytes would be expanded slightly at the lower end of the concentration range to capture more of the sample concentrations, excluding the possibility of less dilute samples. Note that Pd content was not analyzed for this series of samples, and therefore the calibration ranges are not bracketed for this analyte. Additionally, the isotope system for Pb is known to be unstable, and therefore, 208Pb is reported as total lead content.
Table 4: Recoveries for internal standards used. Note that [#1] represents Helium mode, [#2]-Hydrogen mode, and [#3]-No gas mode
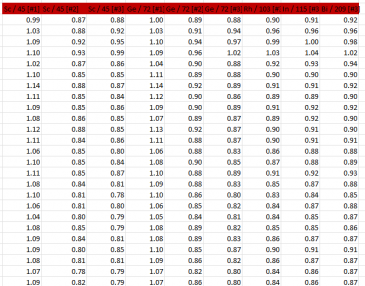
Table 5: Concentration bracketing for KOH electrolyte samples
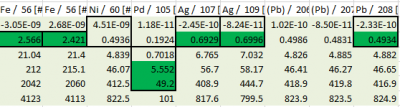
As shown by the bracketing in Table 6, the 105Pd concentrations of analyzed samples were adequately accounted for by the calibration standards. Furthermore, the dark green background cells indicate that an appropriate range of standards accounted for the median 105Pd content. Therefore, this calibration curve was successful in aiding quantification for these samples. Note that bracketing for other analytes correspond to that of electrolyte samples, and are not representative of the aminoboration samples.
Table 6: Concentration bracketing for aminoboration samples.
Data Reduction
Note that initial blank runs were excluded from the analysis for LOD. All subsequent blanks were used for this purpose, excluding that of the calibration standard blank.
Electrolytes
Table 6: Electrolyte adjusted analyte concentrations.
| Folder: | Misc Info: | Dil factor | ALS Vial: | Fe / 56 [#2] | Ni / 60 [#3] | Pd / 105 [#3] | Ag / 107 [#3] | Ag / 109 [#3] | Pb / 208 [#3] |
| 042SMPL.D# | Fe_Pure_dil | 0.62569444 | 3111 | 355957.839 | -19890.924 | 9457.79979 | 84397.6037 | 91160.8026 | 1279.31247 |
| 043SMPL.D# | Unpure_dil | 0.62847222 | 3112 | 355772.487 | -22082.798 | 8083.1509 | 39099.3963 | 42408.0804 | 901.883254 |
| 044SMPL.D# | 50 CV_dil_1 | 0.63194444 | 3201 | 354654.22 | -20974.251 | 7394.54049 | 26091.911 | 29482.4053 | 1062.54404 |
| 045SMPL.D# | 100 CV_dil_1 | 0.63541667 | 3202 | 356016.042 | -17587.192 | 4966.42378 | 21193.635 | 20296.4745 | 281.751095 |
| 046SMPL.D# | 250 CV_dil_1 | 0.63888889 | 3203 | 356828.276 | -15589.827 | 8306.96227 | 17944.894 | 17662.9997 | 743.986956 |
| 047SMPL.D# | 500 CV_dil_1 | 0.64236111 | 3204 | 356314.23 | -24136.726 | 4817.36838 | 17192.1616 | 16222.9869 | 319.186287 |
| 048SMPL.D# | 50 CV_dil_2 | 0.64583333 | 3205 | 354643.738 | -24537.8 | 24342.7462 | 15111.3697 | 14767.3652 | 112.13835 |
| 049SMPL.D# | 100 CV_dil_2 | 0.64930556 | 3206 | 354676.621 | -23433.484 | 23628.5565 | 18102.6947 | 17467.8236 | -518.8919 |
| 050SMPL.D# | 250 CV_dil_2 | 0.65277778 | 3207 | 351898.887 | -278.7743 | 22268.1616 | 21398.9713 | 21567.8828 | -585.55975 |
| 051SMPL.D# | 250 CV_dil_3 | 0.65625 | 3208 | 356047.007 | -23815.984 | 24688.2994 | 12707.3177 | 14138.6266 | 932.131064 |
| 052SMPL.D# | 500 CV_dil_2 | 0.65972222 | 3209 | 332098.66 | -25731.004 | 21875.3387 | 12838.9342 | 12161.4529 | -232.76795 |
| 054SMPL.D# | P_50 CV_dil_1 | 0.66597222 | 3210 | 352489.934 | -16052.392 | 24628.4717 | 14113.697 | 14152.4709 | 600.290358 |
| 055SMPL.D# | P_100 CV_dil_1 | 0.66944444 | 3211 | 354817.77 | -24510.812 | 20912.9593 | 18301.5006 | 20472.9853 | 1120.1597 |
| 056SMPL.D# | P_500 CV_dil_1 | 0.67291667 | 3212 | 355014.542 | -24556.356 | 19834.6625 | 12617.2168 | 11225.5598 | -48.459485 |
| 057SMPL.D# | YJS Purified dil | 0.67638889 | 3301 | 354405.267 | -24865.074 | 22022.7433 | 15044.5036 | 12857.8231 | -51.530526 |
Aminoboration
Table 7 shows the adjusted concentrations with the utilized dilution factors for aminoboration samples. It is clearly evident that the majority of Pd content was present in the precipitate samples, making the higher dilution factor necessary for their analysis.
Table 7: Adjusted concentrations based on dilution factors for aminboration samples.
| Folder: | Misc Info: | Date: | ALS Vial: | Dil factor | Pd / 105 [#3] ppb |
| 021SMPL.D# | EGM_1_SUP | 12/1/23 | 3101 | 3500.309 | 2846.451 |
| 022SMPL.D# | EGM_2_SUP | 12/1/23 | 3102 | 3522.378 | 27671.8 |
| 023SMPL.D# | EGM_3_SUP | 12/1/23 | 3103 | 3619.24 | 46724.38 |
| 024SMPL.D# | EGM_4_SUP | 12/1/23 | 3104 | 3571.783 | 22895.13 |
| 025SMPL.D# | EGM_5_SUP | 12/1/23 | 3105 | 3573.289 | 10755.6 |
| 064SMPL.D# | EGM_1_PPT (10x more) | 12/1/23 | 3302 | 35008.72 | 822354.8 |
| 066SMPL.D# | EGM_2_PPT (10x more) | 12/1/23 | 3303 | 35330.96 | 1091373 |
| 068SMPL.D# | EGM_3_PPT (10x more) | 12/1/23 | 3304 | 35537.58 | 999672.2 |
| 070SMPL.D# | EGM_4_PPT (10x more) | 12/1/23 | 3305 | 35566.6 | 1069488 |
| 072SMPL.D# | EGM_5_PPT (10x more) | 12/1/23 | 3306 | 35666.65 | 1026486 |