The Method
The 7500ce Quadrupole Inductively Coupled Plasma Mass Spectrometer (ICP-MS) with a collision reaction cell (CRC) was employed in solution mode to determine elemental MOF compositions (P, Se, Ni, and Co) and the dissolution/readsorption of Ni and other metal species on a NiFe electrocatalytic material in KOH electrolyte. Additionally, possible contaminating elements such as Ti and Fe were screened for.
Sample and Solution Preparation
All KOH samples were diluted 2000x via a three-step dilution process using ultra-high purity (UHP) water (18 MΩ×cm) and 2% HNO3 solution as the diluents (Scheme 2a). First, electrolyte samples (0.5 mL) containing 1 M KOH (~3.9 wt%. K) from an electrocatalysis experiment were diluted with UHP water to reach a concentration of 0.1 M (5 mL total). Next, diluted samples were neutralized with 2% HNO3, resulting in a total volume of 10 mL (50 mM KNO3, ~0.2 wt%. K+). Then, a 100-fold dilution with 2% HNO3 was performed to obtain a 0.5 mM KNO3 solution (~19.6 ppm K). Note: this procedure equals a 2000-fold dilution from the original 1 M KOH sample and prevents an excess of KOH from harming the ICP-MS instrument. This final solution was regarded as the “sample” for ICP-MS analysis.
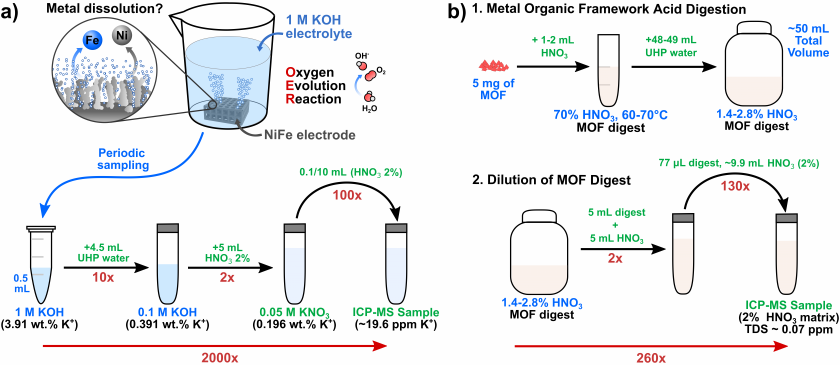
MOF samples were digested via open vessel digestion at 60-70°C using concentrated HNO3 (70%, 1-2 mL) for 15-30 minutes in a cleanroom (Scheme 2b). UHP water was added to each MOF digest to dilute the concentrated HNO3 to ~2% for matrix matching with calibration standards prepared with 2% HNO3. Each sample was then diluted 260x using 2% HNO3. Two MOF digests, those for Co-S101 and Ni-Co-S101, had to be filtered prior to the addition of UHP water due to possible precipitate formation during the digestion process. A method blank was also prepared.
Calibration standards were prepared using certified standards (stock A) containing all analytes of interest (see Tables 18 and 19 in supplementary information). The range of element concentrations for each standard were set based on semiquantitative analysis on Ni-based KOH samples and a MOF sample (see Table 14 and 15 in supplementary information). Quality control standards were prepared using an independent set of standards (stock B). A certified standard was also used as a quality control (NIST 1643f). To test the method, spiked samples of the most concentrated Ni-based KOH sample were also prepared using stock B. Specifically, 80 ppb and 40 ppb of a multielement standard were spiked into the KOH sample with the highest KOH concentration. An internal standard containing Be, Sc, Ge, and In was also used (mixed with samples using a peristaltic pump). All solutions were prepared gravimetrically.
Plasma Tuning & Instrument Optimization
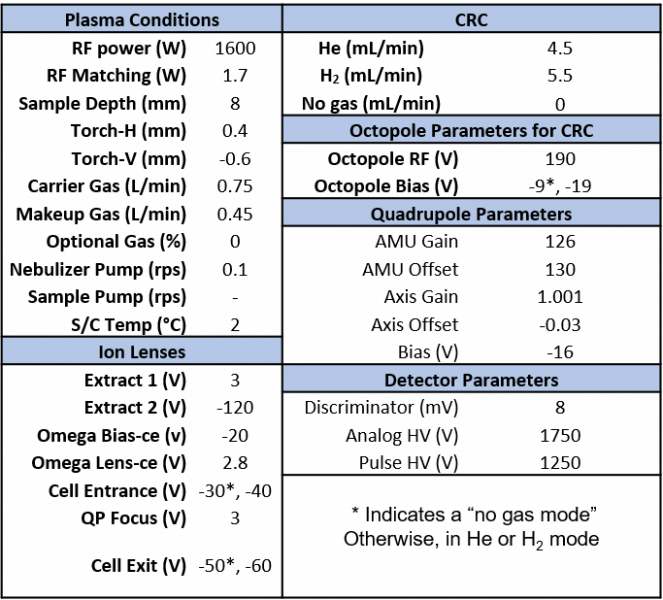
Instrument tuning was performed in no gas, He, and H2 mode using a solution of Sc (2 ppm), Te (2 ppm), Be (1 ppm), Ge (0.4 ppm), Lu (0.4 ppm), and In (0.4 ppm). The tuning metrics for each gas mode are displayed in Table 13 in the supplementary information. In no gas mode, the production of oxides, represented by the m/z ratio of 156/140, indicative of CeO+/Ce+ (Table 13 in supplementary information), was reduced to 1.207%. Tuning was also conducted in He and H2 mode to screen out polyatomic interferences as discussed in the optimization section of the proposal. In He mode, the signal at m/z = 78, corresponding to Se, was tuned to zero cps. The other isotopes of Se (m/z = 75, 80) were also reduced to ~6 cps or less. The cps were also minimized for Fe at m/z = 56 and Co at m/z = 59 (Table 13 in supplementary information). In hydrogen mode, counts for Se were also minimized, however, the counts could not be reduced to the same extent as in He mode. Additionally, background corresponding to the isotopes of Fe and Co were also higher in hydrogen mode than in He mode (Table 13 in supplementary information). The optimized instrument parameters are displayed below in Table 3.
Table 3. Instrument Parameters
Method Quality
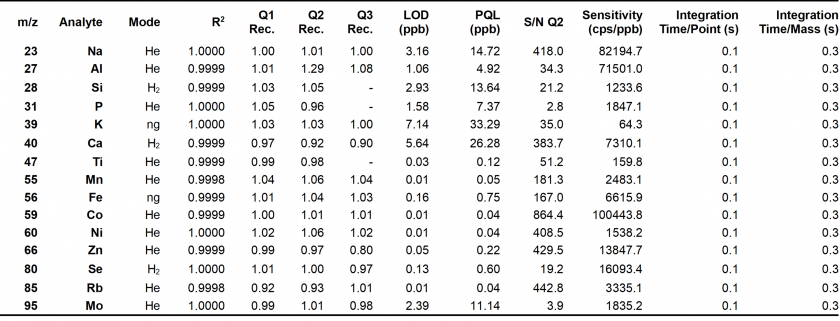
The analytes of interest, their integration times, and CRC gas modes are displayed in the table below (Table 4). These modes were selected per each analyte based on highest analyte recoveries, correlation coefficients, lowest %QRSD considerations, limits of detection (LOD), and practical quantitation limits (PQL) (see Table 27 in supplementary information for an example). The analytical sequence for the method can be found in the supplemental information section (Table 16). Between sample runs, two 50 second washouts were performed to limit analyte retention in the ICP-MS. Each analyte concentration was determined using a calibration curve corresponding to the optimum CRC mode. All element concentrations fit well within the calibration curve range with some exceptions. Specifically, the concentrations for 27Al, 47Ti, 55Mn, 56Fe, 66Zn and 95Mo were near or below the lowest concentration calibration standards as well as the limit of detection (LOD) and, especially, the practical quantitative limit (PQL). These low signals, however, are expected given these elements were only studied to gauge possible contamination from reagent stocks and sample preparation processes. Notably, Ni, Co, and Fe LODs from our method (0.01, 0.002, and 0.243 ppb, respectively) were lower than those reported by Patidar et al. (0.196, 0.061, and 1.32 ppb).26
The three quality controls used to assess the accuracy and precision of the method are Q1, Q2, and Q3. Q1 and Q2 were prepared in lab using stock B of certified standards . Q3 was a certified NIST 1643f standard diluted 10x. For each element in the quality control, high recoveries were obtained, all of which were within 10% of 1.00. There was only one exception for 66Zn in Q3 with a recovery of 0.80.
Table 4. Metrics for Method Evaluation
In addition to the high recovery fractions for each analyte in the quality controls, high recovery fractions were also found for spiked samples. These spike samples were a purified KOH electrolyte unknown containing the highest concentration of KOH (U1) spiked with 80 and 40 ppb of a multi-elemental standard (stock B standards). These spike concentrations were selected to compare our method’s performance with the results from Patidar et al.,26 who studied high concentration KOH samples following dilution with an Ar gas dilution accessory. Recoveries were calculated using Eq. (1) from the proposal. Resulting spike recoveries are shown in Tables 5 and 6, with all analytes in the ±10% range. Considering that the method reported by Patidar et al.26 exhibited recoveries within ±15%, our method can be considered reliable even without using the Ar gas dilution kit. The high precision of our method was confirmed by replicating the spiked samples three times for each spiked concentration, with all analytes showing %RSD below 2% (see Table 25 and 26 in supplemental information).
Table 5. Spiked samples recoveries for analytes from Stock 4A solution (Ni 80 ppb spike). Concentrations are expressed in ppb.

Table 6. Spiked samples recoveries for analytes from Stock 4A solution (Ni 40 ppb spike). Concentrations are expressed in ppb.

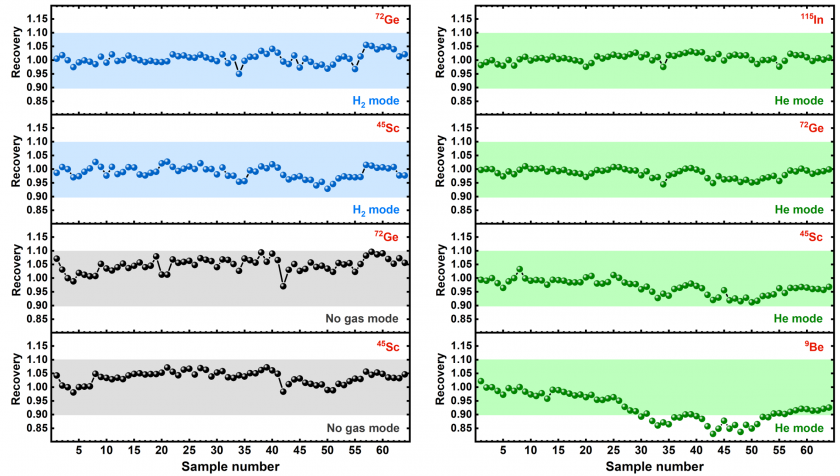
In addition, internal standard recoveries were well within the accepted range of 1.0 ± 0.6 throughout the ICP-MS run (Figure 6), indicating that the ICP-MS was performing normally throughout all runs.
Proposed Method vs. Actual Method
Timeframe and Budget
We anticipated a total cost of ~1000 dollars and a testing time of 6 hours. In practice, 39 samples were run, corresponding to a total cost of $663 dollars. The total run time on the instrument was ~12 h. Costs were a bit lower than predicted because pyrolyzed MOFs and their corresponding KOH samples could not be prepared in time for the class project due to delays in equipment delivery for MOF pyrolysis.
Sample Preparation
Dilution for both MOF’s and electrodes were changed based on semiquantitative results. The MOF’s total dilution was 260x and the electrodes total dilution was 2000x. A neutralization step using 2% HNO3 was added into the electrode sample prep due to the high concentration of KOH. Additionally, MOF digestion was carried out using concentrated nitric acid (70%) instead of 4% nitric acid.