The Proposal
Background and Relevant Work
With the advent of water electrolysis as a promising green energy source, extensive research has been done regarding the synthesis and testing of electrocatalysts, materials that reduce the intrinsic energetic barriers of water splitting.1 Among all the elements from the periodic table, noble metals (e.g., Pt, Pd, Ru, and Ir) are considered the best electrocatalysts due to their low energetic barriers. However, noble metals are limited by their scarcity and high price, hindering their widespread application. Therefore, current research in electrocatalysis aims to develop electrocatalysts that are inexpensive and made of abundant materials, while also being capable of delivering overpotentials close to noble metal electrocatalysts.
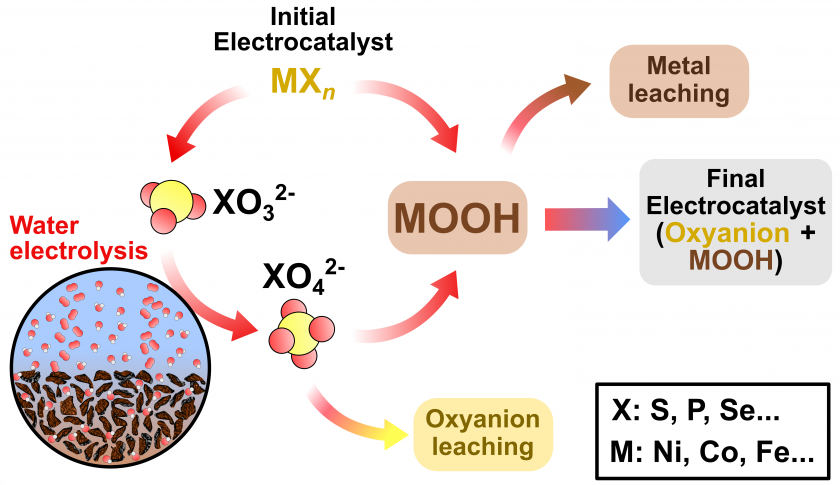
Notably, the iron triad: Ni, Co, Fe, as well as their covalent compounds with sulfur, phosphorus, and selenium, have been extensively studied as water splitting electrocatalysts due to their high conductivity, selectivity, tolerance to alkaline electrolytes, earth abundance, low cost, and overpotentials rivaling those of noble metals.2,3 Although important advances have been made to decrease the energetic barriers of these materials, their instability during prolonged electrolysis still hampers their application in commercial water electrolyzers. For instance, it has been shown that transition metal-based electrocatalysts can experience a reconstruction process known as the “pre-catalytic” effect, where the initial material transforms during electrolysis into new species, as depicted in Scheme 1.4,5 These species often include soluble oxyanions such as sulfates, phosphates, and selenates, or metal oxides and hydroxides (e.g., NiOOH, Ni(OH)2, CoOOH, Fe(OH)2, etc.).6–8
Recent studies have shown the importance of measuring elemental compositions during or after water splitting tests. The dissolution, redeposition, and localized corrosion of the materials under alkaline operating conditions have been reported for noble metals,9–16 transition metals,15,17,18 and non-metals such as Se and P.7,19–21 One category of these transition metal chalcogenide/pnictogenide electrocatalysts, are those derived from MOF precursors. These MOF-based electrocatalysts are known to undergo material dissolution, but have the added benefit of making material loss easily traceable as MOFs are prepared using known amounts of reactants and can be easily analyzed for their compositions using ICP-based techniques such as ICP-MS.19, 21, 28 Another concern is the incorporation of metals from the electrolyte or the substrate into the electrocatalyst, which has proved to be critical for understanding the activity enhancement of transition metal-based electrocatalysts.22–25 Finally, some studies have suggested that the dissolution stabilizes the material to a certain point, and an equilibrium between the reconstructed material and the electrolyte is reached, where dissolved species adsorb on the surface and stabilize catalytic centers.6,7,17 Therefore, there is a debate surrounding the implications of these processes on electrocatalytic activity and stability. In this sense, powerful multi-elemental analysis techniques are necessary to detect and monitor the species involved in such processes.
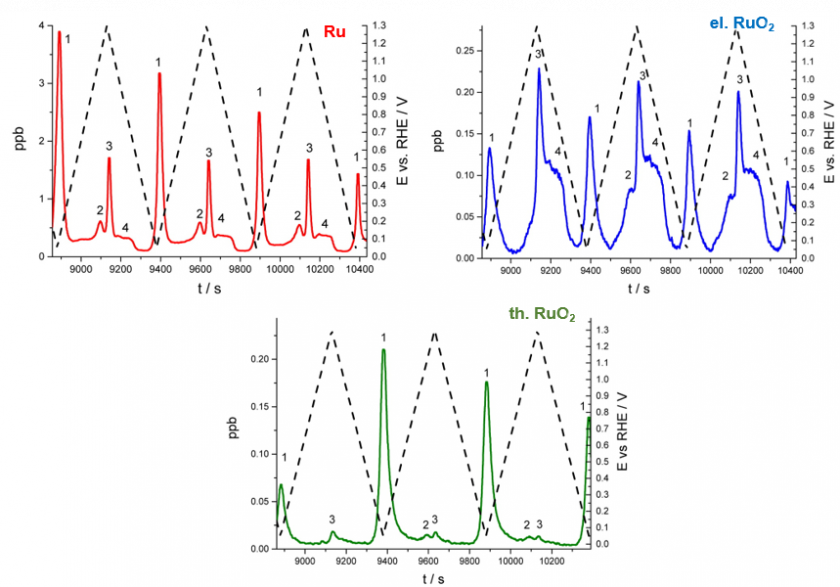
ICP-MS has been employed to measure dissolution and corrosion processes due to its low detection limits, high sensitivity, and broad analytical range. Jovanovič et al. studied the dissolution of Ir and IrO2 particles using ICP-MS during water splitting tests.9 They found that surface redox transitions triggered the electrochemical dissolution of Ir particles by measuring time-resolved dissolution profiles during testing. This behavior was attributed to the oxidation of the material that created soluble Ir(III) species. Similarly, Hodnik et al. studied the dissolution trends of Ru and RuO2 nanoparticles.11 From their analysis, the dissolution profiles comparing as-prepared Ru with electrochemically and thermally-prepared Ru shown in Figure 1 were produced. Interestingly, by performing electrochemical and thermal treatments to Ru particles, the dissolution decreased. The authors attributed the increased stability to the reduced number of defects and higher crystallinity of electrochemically and thermally prepared samples.
Despite being a powerful tool for examining dissolved species in solution, one important limitation for stability assessments using ICP-MS is the presence of potassium hydroxide (KOH), which is often used as the electrolyte for electrocatalytic tests. Commercial-grade 1 M KOH is highly alkaline and contains numerous ions, including K, Ba, Ca, Al, Cd, Cr, Mn, Pb, Zn, Sr, Mg, Fe, Co, Ni, and Cu, among other impurities.22,24 Therefore, examining concentrated KOH samples through ICP-MS poses several challenges such as contamination from glass corrosion and/or KOH electrolyte, clogging of the nebulizer, signal suppression, instrumental drift, and numerous interferences (e.g., isobaric 64Zn+ and 58Fe+ with Ni, polyatomic 40Ar16O+ with 56Fe+).26 Therefore, specific strategies must be considered to measure analytes in KOH accurately.
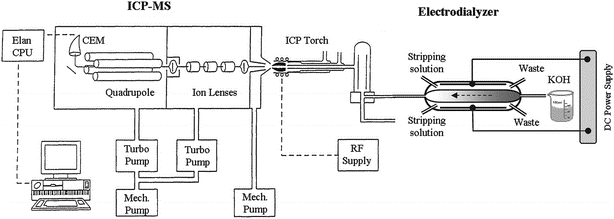
Lu and Sun proposed an online electrodialysis-ICP-MS hyphenated system that allows for the removal of K+ and OH– ions from concentrated KOH (~11 wt%) using a cation exchange membrane (Figure 2).27 Using this method, the authors determined the concentration of common KOH impurities, including Ni (4.83 ± 0.61 ppb) and Co (4.78 ± 0.28). However, despite achieving low detection limits (1.2 and 0.09 ppb for Ni and Co, respectively), the applicability of this method is limited by the expensive electrodialysis device that needs to be optimized in addition to the ICP-MS operating conditions.
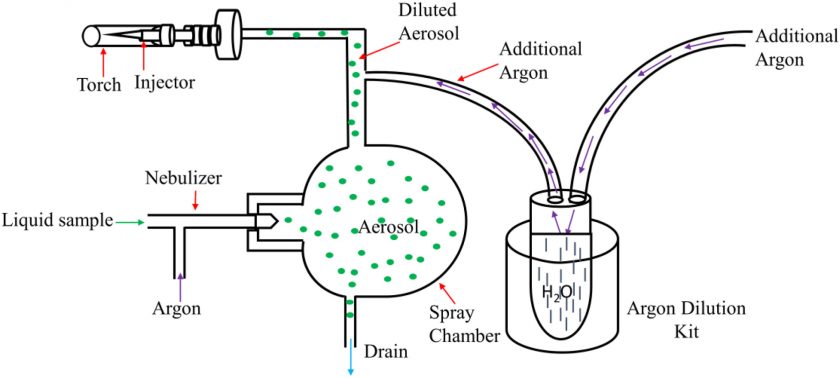
Recently, Patidar et al. proposed an ICP-MS method suitable for analyzing trace impurities in 1 wt% KOH by employing an Ar gas dilution kit (Figure 3).26 To address the high alkalinity of KOH, they neutralized 1% KOH with 1% HNO3 and used Ar to dilute the aerosol, improving matrix decomposition and reducing the plasma load. Furthermore, they used a collision cell in He mode to remove polyatomic interferences by kinetic energy discrimination. For calibrating the instrument, standards consisting of high purity KNO3 as the matrix (based on KOH and HNO3 neutralization) and analytes (i.e., Pb, Cd, Ag, Sr, Zn, Cu, Co, Fe, Ni, Mn, and Cr) in the 10 – 200 ppb concentration range were analyzed. For Ni, Co, and Fe, the detection limits were 0.196, 0.061, and 1.32 ppb, respectively. Thus, by using the Ar dilution kit, the collision cell in He mode, and accounting for isobaric Ni and Fe interferences, the authors provided a relatively simple and robust method for analyzing trace impurities in 1% KOH samples.
Significance
Several studies have confirmed the dissolution of metals and non-metals from electrocatalysts during water-splitting tests. Therefore, there is a need for understanding how these dissolution processes occur and if these stabilize once the material is transformed. Moreover, providing accurate measurements of compositional changes during synthesis and testing can be helpful for improving catalyst design and engineering.
ICP-MS is a powerful multi-elemental analysis technique that can be utilized for this purpose. As discussed in the background section, some approaches have even utilized ICP-MS for analyzing complex electrolyte media. According to the method introduced by Patidar et al., it is possible to detect Ni, Fe, and Co trace levels (around one ppb) in 1% KOH electrolyte. However, an additional Ar dilution kit was necessary to dilute the sample with high matrix conditions. Therefore, we adapt the ICP-MS method proposed by Patidar et al. for determining the concentrations of transition metal-based electrocatalysts in 1 M KOH electrolyte. Instead of using the Ar dilution kit, we plan to neutralize the KOH sample with HNO3, followed by diluting the sample (2000x). Please see the Materials and Methods section for more details on this procedure.
We hypothesize that by employing these conditions, we will develop a precise and accurate method for metal and nonmetal detection, even when diluting the 1 M KOH samples down to 25 ppm. We will examine the accuracy and precision of the approach by running an external calibration curve, evaluating spike recovery tests of Ni, Fe, and Co, internal standard recovery using Be, Sc and Ge, and replicating the measurements. Based on previous studies, we expect accuracy and precision levels below 10% RSD and recoveries ±10% on spiked Ni, Co, and Fe samples to confirm the method’s robustness. Finally, we expect detection limits to be below to 5 ppb, allowing for trace detection of our analytes.
Research Objectives
Our main goal is to accurately examine elemental composition changes (both in solid catalysts and the electrolyte) for transition metal-based electrocatalysts before, during, and after water splitting tests using a robust ICP-MS method. We consider the following specific objectives:
- To compare the elemental loadings (i.e., Ni, Co, P, and Se) of metal-organic framework (MOF) before and after synthesis.
- To examine the dissolution of Ni and Fe from porous NiFe electrodes during water electrolysis tests (24 h) by sampling the KOH electrolyte at different intervals.
- To optimize the proposed ICP-MS method for analyzing challenging 1 M KOH electrolyte samples.
- To determine the accuracy and precision of the proposed method.
- To determine the detection limits for the studied analytes.
Materials and Methods
Sample Preparation
Two types of samples will be analyzed using the proposed ICP-MS method: solid samples consisting of metal-organic framework (MOF) catalysts and aqueous electrolyte samples taken at different intervals during testing of a porous NiFe electrocatalyst. Each sample is described below.
MOF electrocatalyst samples
The MOF samples are displayed in Table 1. These MOFs will be analyzed before and after pyrolysis for their elemental compositions. The pyrolyzed MOFs are of interest as they have been shown to perform well as electrocatalysts. We plan to analyze the MOFs before and after pyrolysis to determine how elemental composition changes during synthesis and to aid in determining the degree of material dissolution in future studies following electrochemical testing. The MOF precursors (Table 1) will be given priority for this project. Following their analysis, the pyrolyzed samples will be analyzed (their preparation will take additional time as the pyrolysis of these materials has been delayed due to a wait on materials necessary for this process).
Table 1. MOF Samples
| MOF | Elements Contained | Elements to detect via ICP-MS |
| Ni-Se101 | Ni, Se, P, C, N | Ni, Se, P |
| Co-Se101 | Co, Se, P, C, N | Co, Se, P |
| NiCo-Se101 | Ni, Co, Se, P, C, N | Ni, Co, Se, P |
| Ni-S101 | Ni, S, P, C, N | Ni, P |
| Co-S101 | Co, S, P, C, N | Co, P |
| NiCo-S101 | Ni, Co, S, P, C, N | Ni, Co, P |
Traditionally, MOFs and MOF-based materials are prepared for ICP-MS using acid digestion either with sulfuric acid, nitric acid, a combination of the two, or hydrofluoric acid.28,29 For the acid digestion of our MOF samples, we will use 5 mg of each MOF sample and digest the MOF in a 4% nitric acid solution (1-2 mL). The digestion will first be attempted at room temperature. If the MOF has not dissolved within 15 minutes, the digestion solution will be heated in a fume hood at 50-70°C until completely dissolved. Granted nitric acid fails, we will attempt digestion using aqua regia. The sample will then be dried, weighed, and diluted x50 in 2% nitric acid. This drying step will be taken to account for the loss of carbon, which acts as a linker between the metals and nonmetals in the MOF precursors. Given that there is no difference in weight before and after digestion, this drying step may not be repeated for future digestions.
From previous knowledge of similarly prepared MOFs, we anticipate concentrations of the metals of interest, Co and Ni, in the low ppm range (under 10 ppm) after a x50 dilution. Thus, these samples will be further diluted to the ppb range (less than 200 ppb and above 1 ppb) for our ICP-MS setup. The dilution will be carried out using 2% nitric acid to match with the conventional ICP lab standard. To start, a 100x dilution will be performed as this would likely get all concentrations to less than 200 ppm. For example, if Co concentration in x50 diluted sample is 5 ppm, then a x100 dilution would result in a 50 ppb solution. This dilution would only require 15 mL of total volume, which is within the range of the sample preparation tubes’ volume used in the ICP-MS facility.
The 100x diluted samples will be used for semiquantitative analysis to get a better idea of the necessary dilution factor for analyte detection. From there, serial dilutions will be used as necessary. All calibration standards will also be prepared in 2% nitric acid solution. The range of calibration standard concentration will be from 10 to 500 ppm. For the blank, a 2% nitric acid solution will be used. The internal standards used for this portion of the experiment will be yttrium and scandium. In addition, spiked samples will also be prepared to check the accuracy of the method. If time permits in regard to sample preparation, then the pyrolyzed MOFs will also be prepared for analysis using acid digestion as detailed above.
Alkaline Electrolyte Samples
Electrolyte samples will be taken at different time intervals while testing a NiFe electrocatalyst in a closed electrochemical cell. Electrolyte samples will be prepared following a procedure adapted from the literature.26 The detailed procedure is shown below (sample preparation section). The electrolyte consists of a purified* 1 M KOH solution, a common electrolyte for alkaline water electrolysis.
*Note: the KOH electrolyte to be utilized in all the electrolysis tests has been purified in our lab to remove Fe impurities from commercial-grade KOH. With the purpose of examining the effectiveness of our purifying method, only three extra “unpurified” KOH samples will be analyzed as well.
Optimization
Tuning
The plasma and torch conditions will be optimized using a tuning solution to minimize oxide and doubly charged interferences. This optimization will be performed using a 7Li, 89Y, and 205Tl tuning solution. This solution will also contain analytes that could cause interferences such as S, Fe, Ni, Co, and C. The parameters that will be varied for this optimization are the plasma temperature, the time the sample is in the plasma, sampling depth, the coil voltage, and the Argon gas flow.
Interferences
In this work, MOFs (see Table 1) will be studied for their material composition and the electrolyte of Ni-based electrodes for material dissolution. In addition, pyrolyzed MOFs will also be studied for their composition and the electrolytes in which they were tested in for material dissolution, time permitting.
We will detect the following analytes of interest: Se, P, Ni, and Co for MOF catalysts and Ni and Fe for the porous electrodes. The isotopes of these elements, however, have many interferences associated with them that can make detection via ICP-MS challenging (see Table 2).
Table 2. Polyatomic interferences associated with Isotopes of Elements of Interest
| Isotopes | Relative Abundance | Possible Interferences |
| 31P | 100% | 14N16OH, 14N17O, 15N2H, 15N16O, 14N15NH2, 12C18OH, 13C18O, 13C17OH |
| 74Se | 0.89% | 36Ar38Ar, 36Ar2H2, 58Ni16O, 56Fe18O, 58Fe16O, 57Fe17O, 37Cl2 |
| 76Se | 9.36% | 38Ar2, 36Ar40Ar, 36Ar40K, 36Ar38ArH2, 60Ni16O, 58Ni18O, 59Co17O, 58Fe18O, 13C31P16O2, 12C31P16O17O |
| 77Se | 7.63% | 38Ar2H, 36Ar40ArH, 38Ar39K, 36Ar41K, 61Ni16O, 60Ni17O, 59Co18O, 13C31P16O17O, 12C31P17O2, 12C31P16O18O, 40Ar35Cl |
| 78Se | 23.78% | 38Ar40Ar, 38Ar40K, 36Ar40ArH2, 62Ni16O, 61Ni17O, 60Ni18O, 12C31P17O2, 13C31P16O18O, 12C31P17O18O |
| 80Se | 49.61% | 40Ar2, 40Ar40K, 38Ar40ArH2, 62Ni18O, 64Ni16O, 31P16O217O, 13C31P18O2 |
| 82Se | 8.73% | 40Ar2H2, 64Ni18O, 31P16O17O18O, 31P17O3, 12C35Cl2 |
| 59Co | 100% | 40Ar18OH, 41K18O |
| 58Ni | 68.077% | 40Ar18O, 40Ar17OH, 40K18O, 41K17O, 58Fe |
| 60Ni | 26.223% | none relevant |
| 61Ni | 1.14% | 12C14N35Cl |
| 62Ni | 3.634% | 13C14N35Cl, 12C15N35Cl |
| 64Ni | 0.926% | 36Ar13C14NH, 36Ar12C15NH, 36Ar12C16O, 32S16O2, 32S2, 31P16O2H, 31P16O17O, 12C17O35Cl, 13C16O35Cl |
| 54Fe | 5.8% | 40Ar14NH, 36Ar18O, 38Ar16O, 36Ar17OH, 38Ar15N, 40Ar13CH, 36S18O, 36S17OH, 37Cl16OH, 37Cl17O, 35Cl18OH |
| 56Fe | 91.72% | 40Ar16O, 38Ar18O, 40Ar15NH, 38Ar17OH, 39K17O, 40K16O, 37Cl18OH |
| 57Fe | 2.2% | 40Ar16OH, 40Ar17O, 38Ar18OH, 39K18O, 40K17O, 41K16O |
| 58Fe | 0.28% | 40Ar18O, 40Ar17OH, 40K18O, 41K17O, 58Ni |
Possible interferences pulled from data from P. Wee, Perkin Elmer, 2004, G. Keating
Phosphorous is mono-isotopic, meaning only 31P can be detected using ICP-MS. Given the many interferences that can occur at m/z = 31 (Table 2), phosphorous is normally oxidized in a CRC as follows:30
31P+ + 16O2 → reaction cell → 31P16O+ + 16O
Instead of detecting P at m/z = 31, it can, instead, be detected at m/z = 47. However, since we are not equipped to use O2 gas with our setup, we will attempt both collision and reaction mode using helium and hydrogen gas, respectively, to prevent polyatomic interferences from reaching the mass analyzer. Given only polyatomic interferences are anticipated for phosphorous in the MOF samples, it is likely that collision mode will be sufficient at preventing bulky polyatomic interferences from distorting analyte counts per second/signal.
Selenium has several isotopes, each with several associated interferences. For this project, only selenium’s most abundant isotopes, 78Se and 80Se, will be used for detection of Se for MOF-related samples. There are several reports on selenium analysis using CRCs with varying gases and gas ratios. Traditionally, the collision mode using He gas has been used to filter out polyatomic interferences using kinetic energy discrimination (KED). In addition to collision mode, reaction mode with hydrogen gas has also been used. Reaction mode is seen as advantageous for the detection of selenium as it is able to parse out both polyatomic interferences and doubly charged species and because it cuts down on the kinetic energy loss of selenium ions as hydrogen is lighter than helium and imposes less collisions.31 Additionally, a mixture of the two gases has also been used.32 Selenium has also been detected as an oxide using tandem mass spectrometry systems at m/z = 94.33 Given, our single-quadrupole ICP-MS is not equipped for using O2 gas in the CRC to produce selenium oxide, we will try to detect the selenium in our samples using both helium and hydrogen gas. Considering the majority of interferences for selenium are polyatomic (Table 2), it is likely that hydrogen and/or helium will be sufficient as these polyatomic interferences would be larger than selenium ions. Thus, they would be kept from passing onto the mass analyzer due to collisions. The gas flow will be tuned to optimize the CRC such that interferences are minimized while selenium can still be detected. We will carry out this optimization, in addition to tuning, using a certified standard containing selenium.
Carbon Interference: Enhancement Effect
In ICP-MS, carbon is known to enhance ion signals for elements whose first ionization potential are slightly lower than carbon (~11 eV). Given first ionization potentials of P and Se fall near that of carbon at 10.487 and 9.753 eV, respectively, the contribution of carbon to these elements’ isotope signals must be considered for all MOF samples prepared using acid digestion as the linkers within the MOF are entirely carbon-based.34 This enhancement can and will be accounted for using internal standard correction.35
Cobalt, like phosphorous is mono-isotopic. In this project, interferences with 59Co will be screened out using helium in a CRC (KED mode) given literature precedence.26
Nickel, like cobalt, will be screened for interferences using He/KED mode in the CRC.26 The most abundant isotope, 58Ni will be used for detection for the MOF samples. However, for Ni and Fe from porous electrode samples, given 58Fe is an interference, the second most abundant Ni isotope will be used (Table 2). 64Zn is also an interference for 64Ni. These isobaric interferences can also be overcome using the following correction equations:
58Ni = -0.00305277(56Fe)
64Zn: -0.0348659(60Ni)
Iron will also be screened for interferences using He gas/KED mode for the CRC.26 The isotope of iron used for detection will be 56Fe.
Analytes of Interest Summary
Overall, we plan to measure the following analytes through our method:
- MOF catalysts: Se, P, Ni, and Co (and Fe in the future for MOF electrolyte samples).
- NiFe electrodes: Ni and Fe
In addition, we want to track certain contaminants which are expected according to previous studies.22–25
- From electrochemical cell glassware: Ti, Si
- From KOH impurities: Na, Al, K, Ca, Mn, Zn, Rb, Mo
Therefore, we will analyze a total of fifteen different analytes through our method. These analytes will be included in our calibration standards for accurate quantitation.
Finally, we will examine other possible contaminants that may come from the synthesis of MOF precursors using the initial semi-quantitative run: B, S. Note: we will decide if the concentration of B is high enough to be included in standards for quantitation. If it is detected, we expect it to have very low signal. Then, S is expected to only be present in the MOF samples in Table 1 containing S. There is the possibility of S-interference (Table 2), however, these interferences are polyatomic and will, therefore, likely be removed via collisions in the collision reaction cell.
Data Quality
To ensure our results are both precise and accurate several steps will be taken. Specifically, spike recovery tests will be carried out by spiking unknown samples with standards. Unknowns will be spiked with either Ni, Fe, Co, or a combination of the metals throughout the concentration range (50 and 250 ppb each). The recovery will be calculated using the following equation (Eq. 1):26

This calculation will also be carried out for the internal standards used. The precision of our data will then be determined by calculating the relative standard deviation for each sample type. In total, three replicates will be performed per each sample type. In addition, we will account for possible mass drift, which may occur when the ICP-MS is used for extensive periods of time, by running blanks and quality control standards in-between the experimental sequence.
A preliminary semi-quantitative run will be performed to devise the calibration range. Nevertheless, based on the results from Patidar et al.,26 we expect a calibration concentration range from 10 to 500 ppb for both sets of samples.
Experimental Setup
For this project, an ICP-CRC-MS system will be used. For electrolyte samples, only He mode at a flow rate of 4.2 L min-1 will be used.26 For MOF catalyst samples, depending on the element being detected, the gas used at the CRC will be varied from either He, or H2 (see optimization section).
For additional instrumental parameters, such as plasma power and auxiliary gas flow, the parameters set out in the above-referenced literature will be used as starting points.
All measurements will be collected using solution mode on an Agilent 7500ce (Figure 4), at the Jackson School of Geoscience, The University of Texas at Austin.
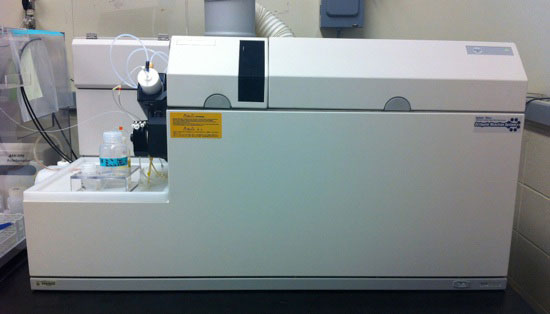
The 7500ce ICP-MS consists of a nebulizer (not shown) that generates droplets from a solution. The droplets are led into the ICP torch using a flow of argon, the same gas used to sustain the torch. The analytes are then ionized and led into the vacuum portion of the mass spectrometer through the sampling and skimmer cones. A series of ion optics are used to remove unwanted material like neutral gas molecules, photons, and electrons. This is done by redirecting the path of positively charged ions through DC potentials. Neutrals and photons, on the other hand, will hit a barrier, and electrons will diffuse away from the ion packet due to the drop in pressure. At the reaction cell, additional interferences like polyatomic ions can be removed through collisions or reactions with He or H2. The ions are then sent to the quadrupole mass filter, which scans through the mass range one amu at a time. By the time ions reach the detector there should ideally be no other species that have the same amu as the analyte of interest (Figure 5).
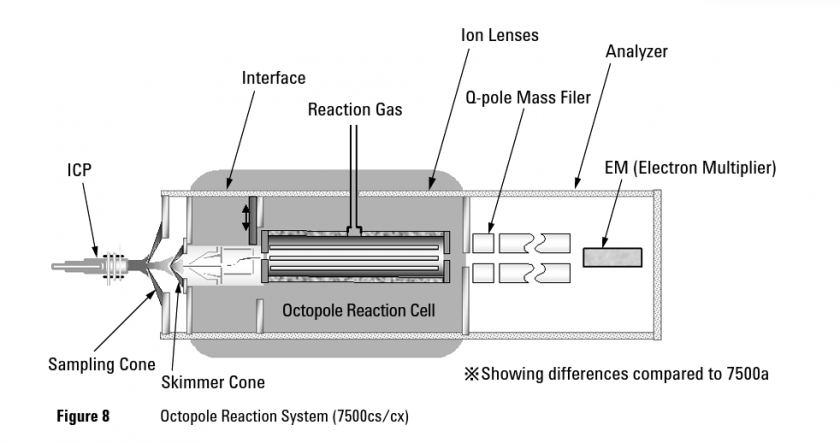
Figure 5. Schematic of 7500cs/cx ICP-MS, which has a similar design to the 7500ce ICPMS. (Image from Agilent 7500 Series ICP-MS Hardware Manual, ref. 37)
Timeframe and Budget
All samples will be run in solution mode, and the budget is estimated on $17 per solution, for a total of $986. Accounting for our projected number of samples and possible repeats during optimization, we anticipate a total time of analysis of 6 hours.
Blanks (x3)
- 2% nitric acid for Purified KOH electrolyte samples and MOF samples
- MOF digestion method blank
Calibration standards (x6)
Multielement calibration standards using ICP-MS grade standards (stock solution A) in the range 0.5 – 1000 ppb. Analytes: Na, Al, Si, P, K, Ca, Ti, Mn, Fe, Co, Ni, Zn, Se, Rb, Mo.
Quality controls (x10)
Three sets of quality control samples (from stock solution B) in 2% nitric acid:
- Q1 (x5): Ni, Co, Ti, Mn, Zn, Se, Mo (50 ppb), Al, Fe, Zn (250 ppb).
- Q2 (x3): Ni, Co, Ti, Mn, Zn, Se, Mo (5 ppb), Al, Fe, Zn (25 ppb).
- Q3 (x2): NIST 1643f 10x (more details on NIST.gov)
MOF unknowns (x12)
- MOF precursors (x6)
- MOF-based electrocatalysts, after synthesis (x6)
- MOF electrolyte samples (x4, if time permits)
Electrolyte samples unknowns (x16)
- Electrolyte samples during potential cycling (x6), by triplicate.
- Purified 1 M KOH electrolyte (x3)
- Unpurified 1 M KOH electrolyte (x3).
Ni and Fe spiked samples for accuracy and precision (x12)
- Electrolyte samples spiked with 80 ppb Ni and 400 ppb Fe (x3)
- Electrolyte samples spiked with 40 ppb Ni and 200 ppb Fe (x3)
Expected Outcomes
For the MOF precursors, we anticipate that, in the samples containing both Ni and Co, the ratio of Ni to Co will be 1:1. We also anticipate a ratio of metal:nonmetal in the Se- and P- containing samples to be 3:2, where metal = Ni, Co, or Ni+Co and nonmetal = P or Se. In addition, we anticipate the ratio of P:Se to be 1:1. In the S- and P-containing samples, we anticipate the metal: P ratio to be 3:2.
Given there is sufficient time in the semester to both pyrolyze the MOFs and study them using ICP-MS, we anticipate the ratios discussed above to be maintained. Following electrochemical testing, again, given there is time, we expect to find P, Se, Co, and Ni in the electrolyte at concentrations in the low ppm range (less than 20 ppm).
We expect to observe Ni and Fe in the electrolyte during testing of the NiFe electrocatalyst, with concentrations increasing as tests progress. We anticipate metal concentrations < 20 ppm. Moreover, we anticipate that, with time, this dissolution will reach its maximum and terminate. Such measurement will provide us with an estimate of the catalytic stability, which is essential for the commercial application of this material. Furthermore, by measuring the dissolution rates of both metals, we could provide guidelines on the synthesis and design of these electrodes (e.g., by varying Ni:Fe ratios).