Supplemental Information
Chemicals Used
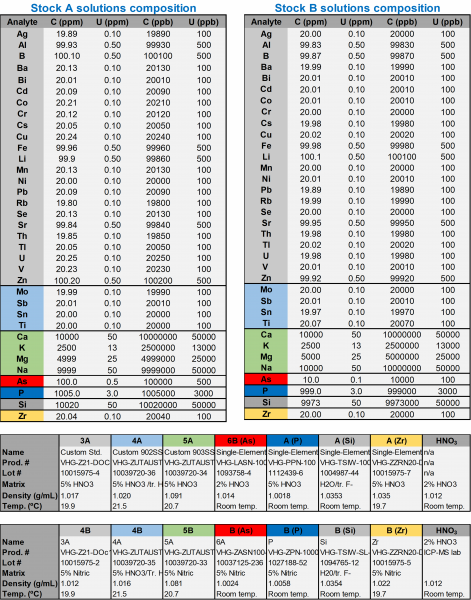
All chemicals were of analytical grade unless noted otherwise and were used as received. Potassium hydroxide (KOH, certified 91%) was obtained from Sigma-Aldrich. Concentrated nitric acid (HNO3, 70%) was used for MOF digestion. A 2% HNO3 solution prepared using nitric acid certified for trace element analysis and ultra-high purity water (18MΩxcm) were used to prepare all ICP-MS samples. Two standard stocks (A and B, see Table 12) were used to prepare the calibration curve standards and quality controls. In addition, a certified third party quality control standard, NIST 1643f, was used (for more details please see: https://www-s.nist.gov/srmors/view_cert.cfm?srm=1643F). Spikes of the most concentration KOH sample were prepared using standard 4B from stock B (Table 10) at 40 and 80 ppb. For all runs an internal standard containing Be, Sc, Ge and In was used. Instrument tuning was performed using a solution of Sc (2 ppm), Te (2 ppm), Be (1 ppm), Ge (0.4 ppm), Lu (0.4 ppm), and In (0.4 ppm).
Table 12. Properties and compositions of stock solutions utilized in this method.
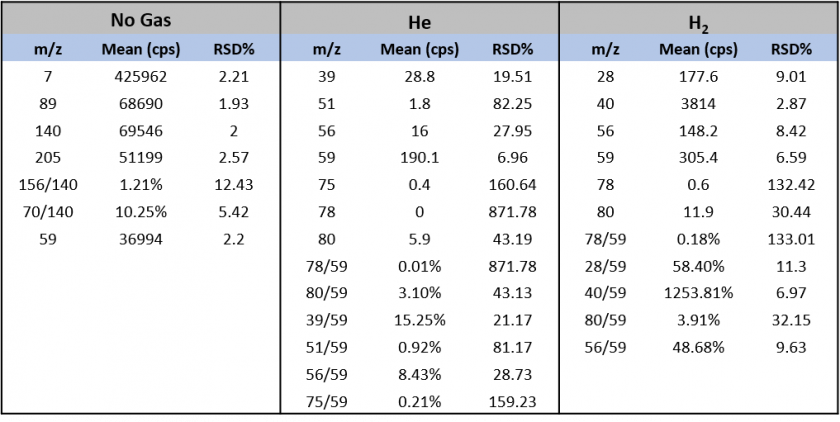
Plasma Tuning and Instrument Optimization: Tuning Metrics
The m/z values and ratios monitored during tuning for limiting interference from polyatomic species per each gas mode are displayed below.
Table 13. Instrument Parameters And Tuning Metrics per Gas Mode
Semiquantitative Analysis
Semiquantitative analysis was performed to 1) determine necessary dilution factors given total dissolved solids (TDS) considerations and 2) determine the range of calibration standard concentrations. This analysis was performed using a NIST 1643f standard and a quality control standard prepared from stock B standards (Table 12). Semiquantitative analysis was performed on four KOH samples (U-KOH, U-NiFe, U-3DP, and U-Fe free) diluted ~2000x and one MOF sample (Ni-Se101) diluted ~2x following instrument tuning. Only one MOF sample was used as the additional MOF samples were prepared such that they have similar metal and nonmetal concentrations. The TDS for both the diluted KOH and MOF samples were less than 25 ppm, falling well below the upper limit of 200 ppm (Table 14). In addition, the complete semiquantitative data analysis is displayed in Table 15. The recoveries were 30-40% in error, as expected for semiquantitative analysis.
Table 14. TDS in Diluted Samples
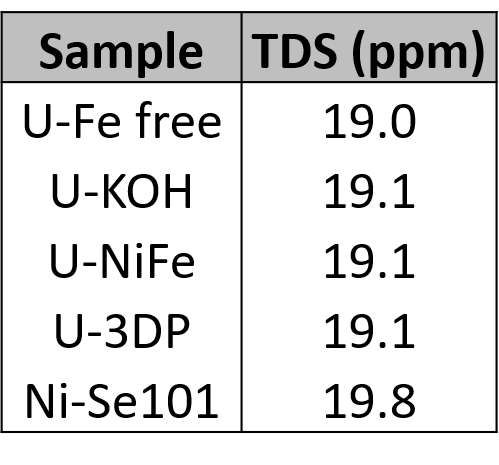
Table 15. Data analysis of the semiquantitative run of a purified KOH electrolyte sample.
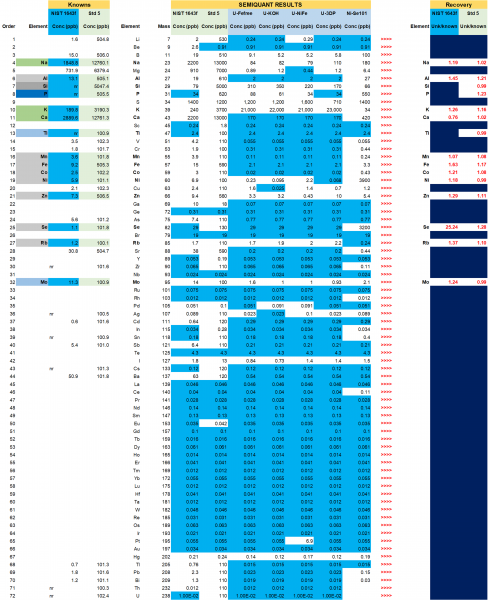
Blue filled boxes under “semiquant results” indicate the maximum semiquant estimate.
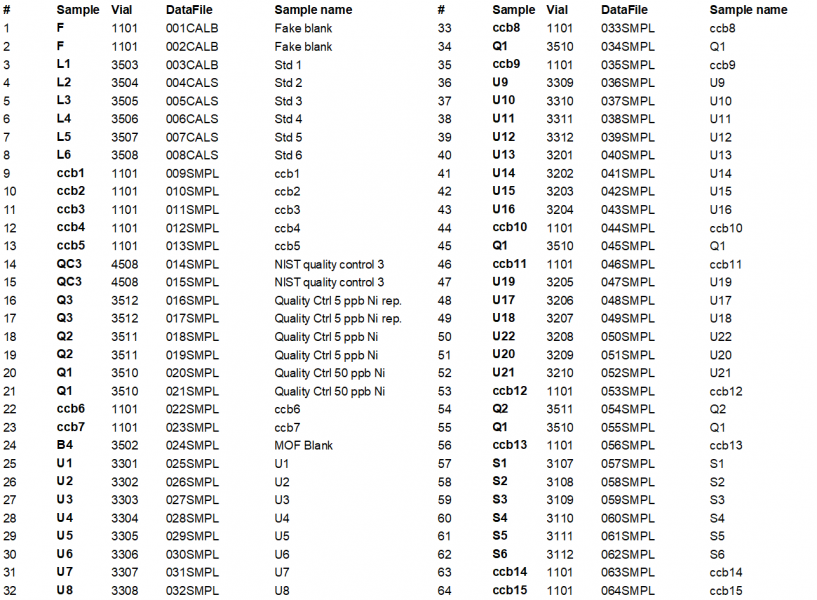
Method Sequence
The analytical sequence is displayed below.
Table 16. Analytical ICP-MS sequence utilized for this method.
Calibration Curves, Quality Controls, and Spike Samples
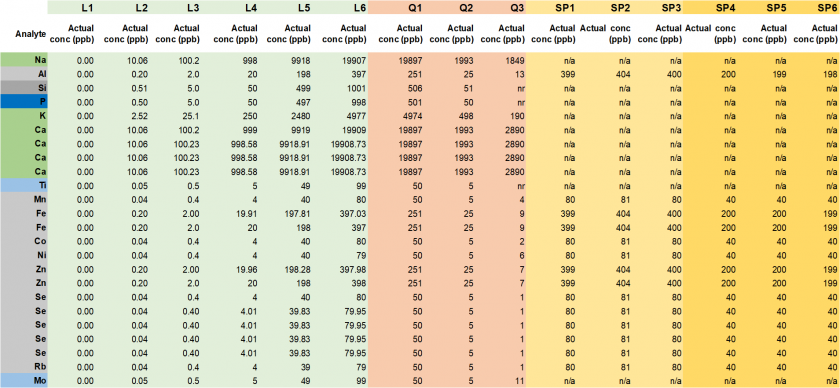
The selected calibration curves for analyte quantification are shown below. Target calibration standard concentrations and actual concentrations are displayed in Table 18 and 19, respectively. In addition, the target and actual concentrations for the quality controls and spike samples are also displayed in Table 18 and 19.
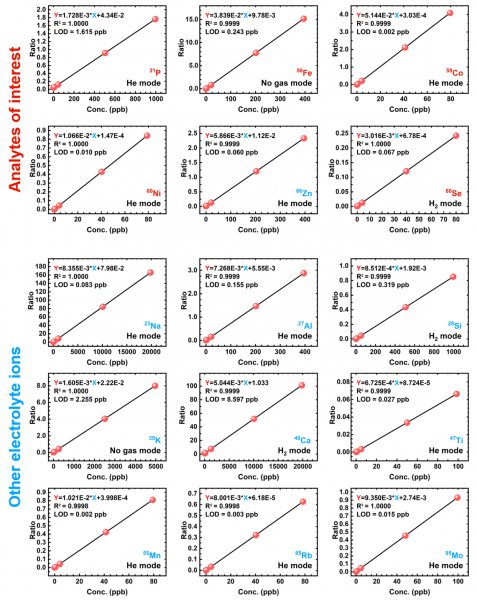
Table 17. Summary of linear fitting coefficients, adjusted correlation coefficients, and detection limits for the studied isotopes.
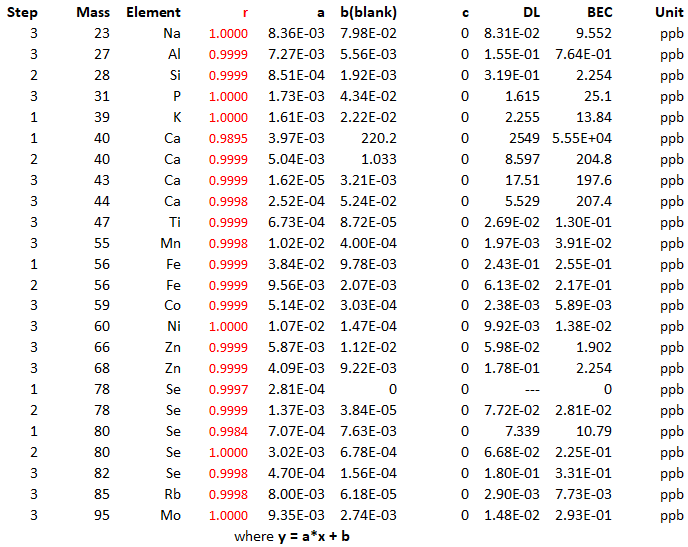
Table 18. Target concentrations (in ppb) for calibration standards (L1-L6), quality controls (Q1-Q3), and spiked samples (Ni 80 ppb: SP1-SP3, Ni 40 ppb: SP4-SP6).
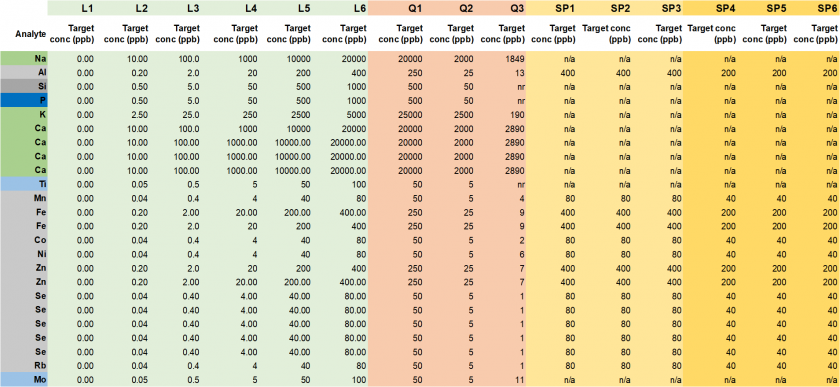
Table 19. Actual concentrations (in ppb) for calibration standards (L1-L6), quality controls (Q1-Q3), and spiked samples (Ni 80 ppb: SP1-SP3, Ni 40 ppb: SP4-SP6).
Data Reduction Summary
Table 20. Concentrations for calibration curve standards .
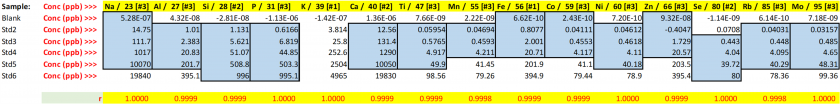
Table 21. Concentrations for blanks and resulting LODs and PQLs.
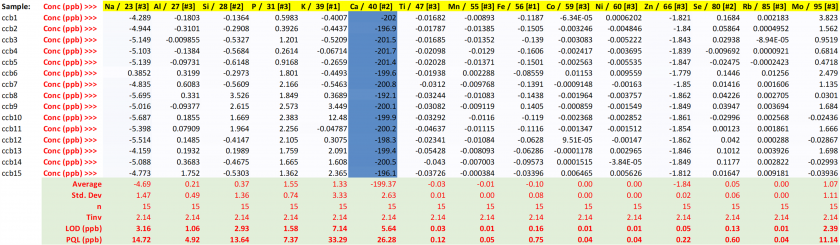
Table 22. Concentrations for the Q1 quality control with resulting performance metrics.
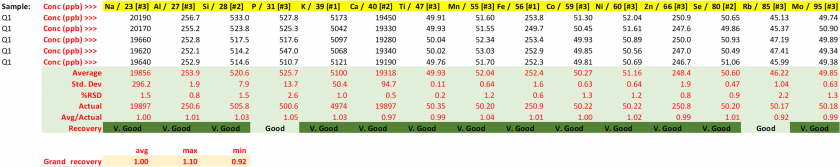
Table 23. Concentrations for the Q2 quality control with resulting performance metrics.
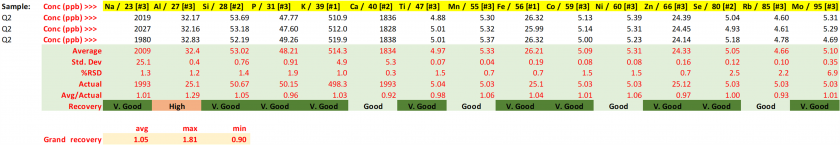
Table 24. Concentrations for the Q3 quality control (NIST) with resulting performance metrics.
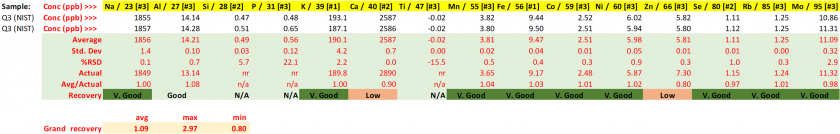
Table 25. Concentrations for spiked samples (Ni 80 ppb) with resulting performance metrics.

Table 26. Concentrations for spiked samples (Ni 40 ppb) with resulting performance metrics.

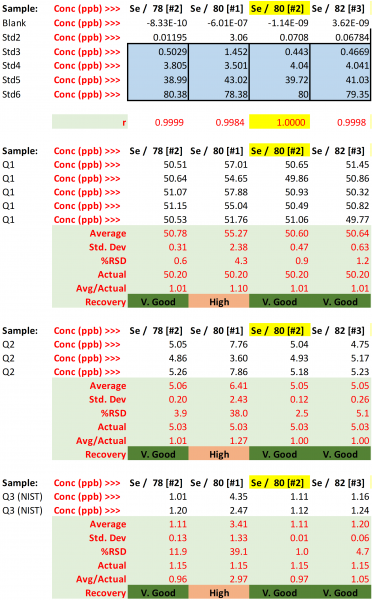
Selenium Isotope Selection
Table 27. Resulting concentrations and performance metrics for the studied Se isotopes.