LA-ICP-MS method to analyze trace element content in zircons to identify trends in magmatic conditions following catastrophic super-eruptions in Valles Caldera, New Mexico.
LA-ICP-MS method to analyze trace element content in zircons to identify trends in magmatic conditions following catastrophic super-eruptions in Valles Caldera, New Mexico.
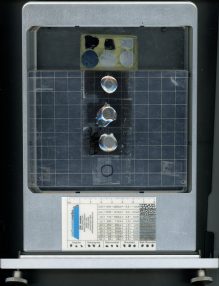
Image was taken by Nick Meszaros, 2020. Photo is facing the northeast within the Jemez Volcanic Field, looking at the Cerros del Rio Volcanic Field. Samples presented for analysis in this method are sourced from this area.
I. LA-ICP-MS method to analyze trace element content in zircons to identify trends in magmatic conditions following catastrophic super-eruptions in Valles Caldera, New Mexico
II. Executive Summary
Between and following the Toledo (1.61 Ma) and Valles (1.25 Ma) super-eruptions, periods of minor volcanism persisted for 105 years (Spell et al. 1996). This period is marked by two distinct magma types – a fayalite-bearing and a biotite-bearing magma. These minerals, biotite and fayalite, are stable at distinct magmatic conditions from each other, especially with respect to oxygen fugacity. When these eruptions occur, fayalite-bearing magma dominates (low oxygen content) followed by a mineralogical shift to biotite-bearing (high oxygen content) after eruptions (Loucks et al. 2018). Understanding the pattern between fayalite and biotite magmas and their respective indications of relative time in an eruptive cycle will offer insight into both how these systems changed prior to eruption and what might happen before the next super-eruption at Valles.
Our minimal knowledge of the pre and post-super-eruption storage conditions makes it difficult to understand the implications of both the present-day occurrence of a partially liquid magmatic body underneath the Valles Caldera and the region’s tectonic activity. The Valles super-eruptions are characterized by two magma types – a fayalite-bearing and a biotite-bearing magma. During a Valles super-eruption, there is only fayalite-bearing magma (plausibly low oxygen fugacity) whereas after, only the biotite-bearing magma is present (high oxygen fugacity). I hypothesize that this volcanic system operates as a cycle as the magma resets to pre-super-eruptive conditions.
III. Research Objective
The purpose of this study is to develop a LA-ICP-MS analytical method to obtain elemental geochemistry to understand magmatic storage conditions. This study’s objective is to examine the temperature and oxygen fugacity of the surrounding magma recorded by the crystallized zircons. By analyzing the elemental content of Cerium, Titanium, REEs, and other major elements in these zircon grains from both magma types of the Bandelier Tuff, I will deduce the oxygen fugacity these grains crystallized in during and immediately after a super-eruption. In the case of the light REEs, the concentration of Ce relative to La and Pr is controlled by oxygen fugacity and is therefore a good recorder of redox state during petrologic processes. Ce is an element whose concentration in zircon is dependent upon oxygen fugacity. As the oxygen fugacity rises, more Ce will partition (substitute) into zircons as they crystallize (Trail et al. 2012).
This method will specifically analyze all REEs. To measure the influence of contamination from accessory minerals in the zircons, the choice of Fe, P, and Ca. Pr and La will be used as bracketing elements to help calculate the Ce anomaly because the concentration of Ce relative to La and Pr is controlled by oxygen fugacity. Ti will be used for the Ti-thermometry in zircon to track temperature (choice of Ti isotope is discussed in review of relevant work). Ce will give insight into the redox conditions of the magma. Si will be run as an internal standard to correct for variability between the samples and the calibration standards. These calibration standards are silica glass NIST SRM 610 and 612 which will ensure accuracy of measurements and maintain low oxide production. Discussion of choice of analytes is included in Review of Relevant Work section.
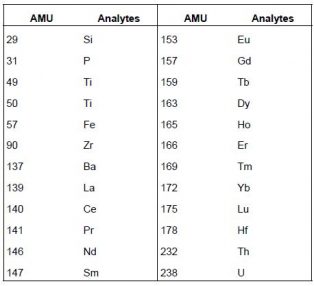
Analytes
IV. Discussion of significance or need (justification)
To prove that the magma under these systems is resetting to pre-super-eruption conditions, I will sample volcanic rocks from both the super and minor eruptions that occurred immediately after the Valles and Toledo super-eruptions. For the Toledo eruption, this includes the Otowi pumice and the Paso del Norte. For the Valles, I will sample the Tsankawi pumice, Rodondo Creek, and Santa Rosa rhyolites. This sample suite will allow me to both create a time sequence of varying oxygen fugacities following the super-eruptions at Valles and apply this data as a guide to understand the possibility of the next eruption.
Simplified discussion of accuracy and precision is presented below through the use of specific standards.
V. Review of relevant work
Yuguchi et al. 2020 applies the previous contributions to simultaneously determine zircon U-Pb age and titanium concentration in granitic samples. This will produce both age and temperature of zircon crystallization. In this zircon method, I will be focusing only on the experiments this paper ran for Ti-in-zircons. To measure titanium for thermometry, Yuguchi et al. employed two approaches. Both approaches use a quadrupole mass spectrometer equipped with a collision reaction cell. The first method used a MS/MS mass-shift mode with oxygen reaction gas which provided a consistent measurement of titanium as 48Ti16O+. The second method proceeded in no-gas mode to measure the intensity of 49Ti. The CRC, through kinetic energy discrimination (collision) or chemical reactivity (hydrogen, oxygen, helium, methane through reactions). Evaluation of titanium in an oxygen-flow CRC generates a consistent measurement of 48Ti16O+ but is not an available option of analysis at the Jackson School of Geoscience. Therefore, the second method (non-gas mode) would be best adaptable to the resources available. Titanium has five stable isotopes: 46Ti (8.25% in isotope abundance ratio), 47Ti (7.44%), 48Ti (73.72%), 49Ti (5.41%), and 50Ti (5.18%). Common interferences include bivalent ions of zirconium (92Zr++, 94Zr++, and 96Zr++). Isobaric interferences 48Ca, 50V, or 50Cr for 48Ti+ and 50Ti+. If these isobaric interferences cannot be removed, focus on 49Ti must ensue.
Burnham et al. 2012 considers ideal locations for ablation spots and what information the grains are actually recording based on their elemental compositions. Contamination due to accessory minerals may have low concentrations and are therefore difficult to identify as a source of contamination. Adding specific elements as indicators for their respective minerals will allow for better identification of contamination when looking at the elemental abundances (Watson and Green, 1981). Zhong et al. 2018 presents the effects even < 0.1% contamination by allanite, apatite, xenotime, apatite, monzonite, or titanite can have on the apparent Ce/Ce* of zircon. To understand if these minerals are present and will therefore interfere with other analytical values, I will measure Ca, Fe, and P. This paper further demonstrates the need to understand contamination in zircon grains due to accessory minerals. Using the same instrumental conditions and measurement procedures as those presented in Hou et al. (2009), U-Pb analysis was carried out through LA-ICP-MS. Cathodoluminescence was used to determine the necessary spot size analysis needed. Hou et al. 2019 focuses on U-Pb dating through LA-SC-ICP-MS. Dramatic crystal zoning will allow information from individual zones to be analyzed to reveal the complex magmatic history of the crystal. Learning from early LA-ICP-MS studies from the 1990s, (Hirata et al. 1995) U-Pb analysis among other uses for laser ablation has been improved by the transition from a visible and infrared beam to the presently used 193 nm ArF Excimer ultraviolet beam.
Equations to solve for the Ce anomaly are established by the anomalous concentration relationship Ce ahs with its neighboring elements, La and Pr. This equation is used from the Trail et al. 2011 and 2012 equations to better understand the cerium redox equilibria in silicate melts (Smythe et al. 2016).
VI. Materials and methods
a. Sample preparation
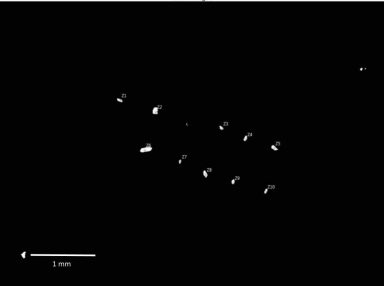
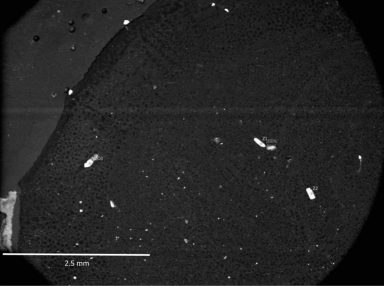
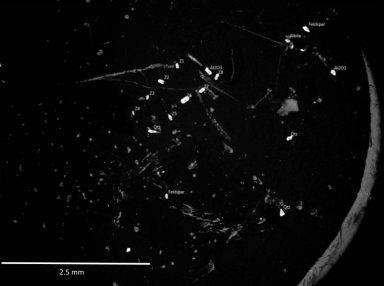
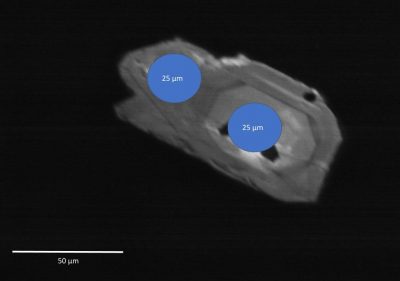
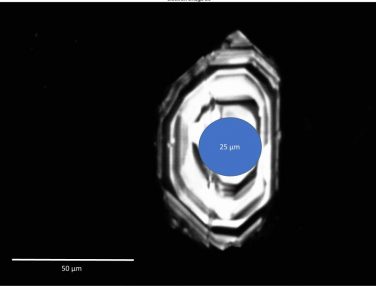
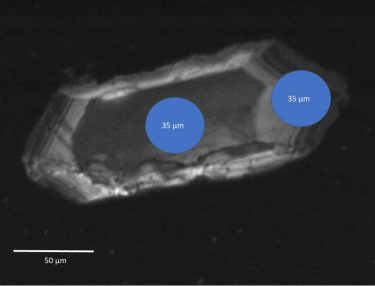
Rock samples were collected from Valles Caldera volcanic field in New Mexico. Pumice rocks were crushed and sieved with 250 µm, 500 µm, and 1mm meshes. Zircons are found in the smallest mesh size. Smallest constituent component is run through the Gemini water table to separate this crushed pumice based on density; zircons will separate into the heavy fraction. Then, the denser minerals were placed in a separatory funnel where a heavy liquid, bromoform (density = 2.84 g/cc), flows through. After the mixture has had time to sit and separate, the heavier minerals (zircon) were transferred onto weighing paper and washed. Next, Frantz magnetic separation produced zircons collected in the 1.8 Amp magnetic fraction. This step is followed by a heavy fraction separation again but with methylene iodide (density = 3.32 g/cc) to get a pure zircon separate. The zircon grains were mounted on glass thin sections by epoxy and polished to return an even, flat surface for analysis. Additional zircons from a zircon-rich sample (RCC-E) were mounted as “sacrificial” grains for method development. A scanning electron microscope was used to create backscattered maps of the mounted zircon grains to label and locate grains on the LA-ICP-MS instrument. Cathodoluminescence images were taken to record zoning within the grains. These images were used to assign separate core and rim spots. Initially, mounted samples were carbon-coated for optimizing cathodoluminescence images. For streamlining the analysis process, the effects of carbon-coating are insignificant and will not be used in future sample preparations. Final prepared slides included samples Otowi, PC3-D, and CSI-3 with 8, 11, and 2 mounted zircons, respectively. Eleven sacrificial grains for method development are from the unit RCC-E.
Images
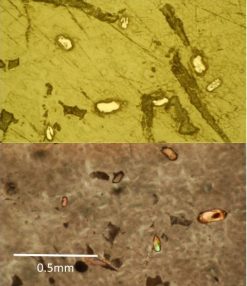 Microscopic image of Otowi Pumice zircon grains in PPL (top) and XPL (bottom)
|
|
|
|
|
|
|
|
b. LA-ICP-MS Tuning
Initial project tuning and sample setup occurred on November 18, 2021. Completion of laser ablation occurred on November 23, 2021. Final data reduction using Iolite software occurred on December 2, 2021. Elemental concentrations of the zircons were measured by LA-ICP-MS at the University of Texas at Austin (Jackson School of Geosciences) using a New Wave Research UP193-FX fast excimer (193 nm wavelength, 4–6 ns pulse width) laser system coupled to an Agilent 7500ce ICP-MS. This laser system is equipped with a two-volume cell with fast washout times (<1 s), minimizing spatial carryover. The analytical sequence for laser ablation methods was triplicate analyses of NIST-616, 614, 612, and 610, followed by unknowns for up to an hour. Previous NIST standards were analyzed in triplicate after every hour of unknown analyses. NIST-614 and 616 were run as unknowns as extra reference standards.
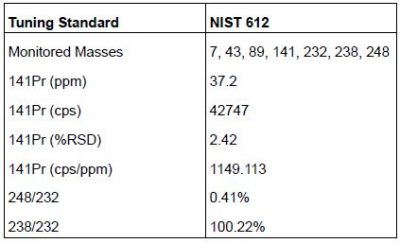
Tuning Parameters
c. LA-ICP-MS Parameters
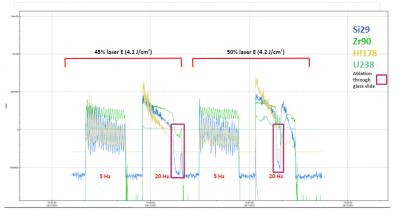
Primarily, an adaptation from Yuguchi et al. 2020 will be a guide for preliminary LA-ICP-MS parameters, focusing on the common interferences with 48Ti (74% abundance), 49Ti (5.5% abundance), and 50Ti (5.18% abundance). Initial tuning was run for pulse/analog configurations. Laser ablation parameters were optimized by using sacrificial zircons from RCC-E unit. Grains which were carbon-coated were pre-ablated under parameters of 45% laser energy, 4.1 fluence variation (J/cm2), 2 Hz repetition rate, 50 μm spot size.
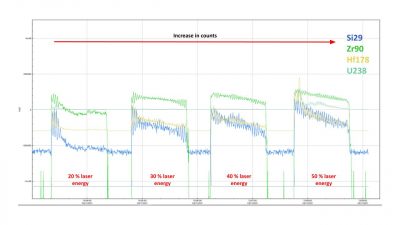
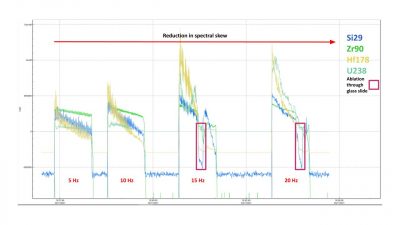
Initial Method looked at four sacrificial grains of unit RCC-E under parameters: 10 Hz, 25spt, 60dw, 800 mL/min of Ar&He with incremental increase in laser energy (%) of 10% (20-30-40-50%). After Initial Method, two major problems arose: spectral skew and low recorded counts of titanium and light rare earth elements. To fix these, the repetition rate was increased from 10 to 20 Hz, incrementally, and the integration time was increased from 0.01 to 0.02 s, respectively (S.P., init. = 0.2872 s, S.P., fix = 0.3772 s). Revised Test 1 had four zircons under 5, 10, 15, and 20 Hz repetition rates to understand the reduction in spectral skew with an increase in repetition rate. An increase in integration times for titanium and LREEs (0.02 s), 35μm spot, 50% laser energy were altered as well. Test 2 retained the Test 1 parameters but varied energy levels between 45% and 50%; 50% returned the best data. Final ablation parameters were 50% laser energy, 4.1 J/cm^2 fluence variation, 20 Hz repetition rate, and 25 and 35 μm spots according to zircon size. More explanation is provided underneath each Method/Test image.
d. LA-ICP-MS Method Development Tests
Initial Method
Test 1
Test 2
e. LA-ICP-MS Final Method Development Parameters
Parameters for LAICPMS
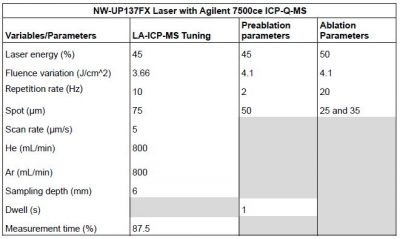
In light of previously mentioned tests, parameters were condensed into the above table. The ICP-MS operated at an RF power of 1600 W and an average Ar carrier flow of 8 L/min. Oxide production rates as monitored by ThO/Th for NIST 612 were 0.413%. Sensitivity was optimized such that 141Pr was ~1150 counts/ppm. The quadrupole time-resolved method involved measurement of 24 masses (29Si,31P, 49Ti, 50Ti, 57Fe, 90Zr, 137Ba, 139La, 140Ce, 141Pr, 146Nd, 147Sm, 153Eu, 157Gd, 159Tb, 163Dy, 165Ho, 166Er, 169Tm, 172Yb, 175Lu, 178Hf, 232Th, 238U) using a 0.01 s and 0.02 s (49Ti, 50Ti, and LREEs) integration times. The analytical sampling period of 0.3772 s correspond to a 87.5% measurement time.
f. Data Reduction
To turn the time-resolved intensities into concentration (ppm), the Iolite software (Univ. Melbourne) was used with 29Si as an internal standard. Calculations for limits of detection within Iolite were based on Longerich et al. (1996). Reduction of data resulted from viewing line scans and excluding data from peaks in analytes indicative of accessory minerals such as phosphorus. Exclusion includes averaging data pre- and post-phosphorous peak. Analyte recovery in NIST-610 averaged within ~3% GeoRem reference values, with the exception of 50Ti. This anomaly is described below. Analyzing the difference in performances of the 49Ti versus 50Ti revealed that there could be an overlap interference from 50Cr or 50V. This interference could explain why the values for recovery on 50Ti (7.57) are significantly higher than that of 49Ti (1.00) as seen in recovery table below. Another possibility of increased Ti50 concentrations could be sourced from interference from Cr in the NIST glass.
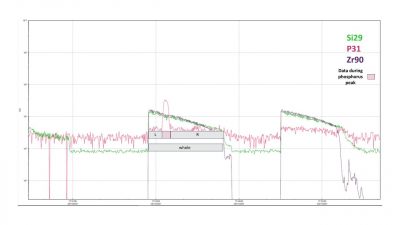
Phosphorous (Apatite) Peaks
 |
 |
 |
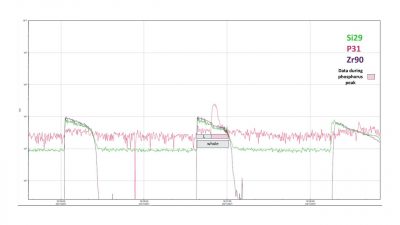 |
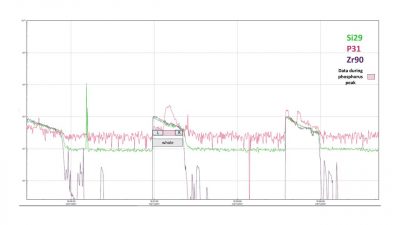
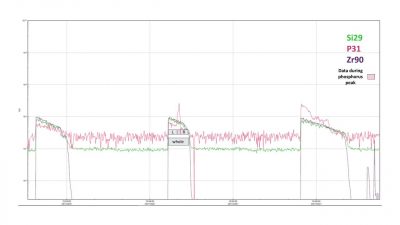
Zircon Grain data scans. While there were six zircon ablations affected by phosphorous content, only four are reported as an example for the calculation of analyte concentrations (ppm). The center peak set of each figure has a phosphorus peak. This is indicative of apatite, a common accessory mineral in zircons. To remove the data altered by the presence of apatite (pink box), averages of pieces of the data (grey boxes) are recorded in place of a full spectral value. The data containing the phosphorous peak (pink box) is removed from the data. The remaining data is averaged and recorded. “Whole” grey box refers to the data that would be collected if the phosphorous peak was not present.
For analytes and their concentrations from data reduction
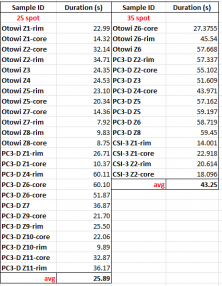
Variation in Ablation Duration and Spot Size
Recoveries for NIST 610 as Compared to GeoRem Values
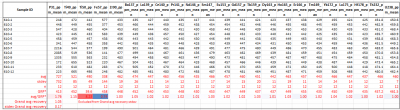
Concentrations, LOD, and Signal-Noise for Unknowns and Standards
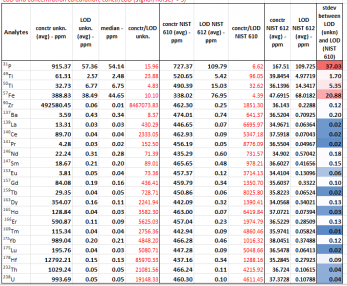
Analyte Concentrations, Limits of Detection, and Uncertainties
g. REE Diagrams
All sample concentrations are normalized against Orgueil (CI chondrite) according to Nakamura (1974) and Palme and Jones (2005). The data below is organized by F-type and B-type rocks in addition to rim and core spot analyses. F-type rhyolites are found to have zircons with ~60% having Ce/Ce* below ~20 (FMQ: fayalite-magnetite-quartz) – 110 (above NNO: nickel-nickel oxide). Whereas B-type zircons have a smaller range where the median is shifted to a higher Ce/Ce* and therefore fO2. Further, rims record the most recent crystallization. So, if F-type rhyolites formed from the reduction of B-type, then F-type grains might have oxidized cores, but reduced rims. Displaying the intersection between F- and B-type with the core and rim data is the best option for representing the data. As discussed in future work, fO2 values have not been calculated yet. Previously stated data assumptions of fO2 relationships with Ce/Ce* come from previous studies.
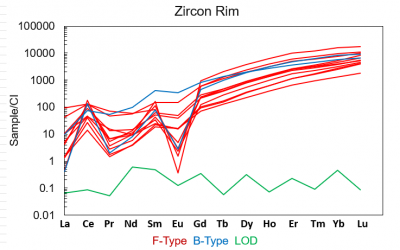
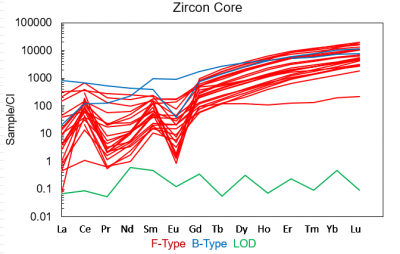
Above graphs record concentrations of Rare Earth Elements (REEs) from zircon laser ablation. These results are viable because they are above detection limits for these unknowns. Worksheet of detection limits and concentrations for REE analyte unknowns is downloadable below.
VII. Discussion of possible outcomes
Data acquisition will provide values to calculate oxygen fugacity and Ti-thermometry in zircons. Comparing these values of the three units of rocks against each other, I expect to see a variation in the oxygen fugacity throughout eruption history (pre- and post-eruption). Through finding the oxygen fugacity, I will calculate the cerium and europium anomalies as proxies for oxidation states in the magmas use equations from Trail et al. 2012.
a. Future Work
The ppm concentration data produced from this method are normalized by Palman Jones Chondrite values and applied to create a Ce/Ce* cerium anomaly (through two different La/Pr and Nd/Sm). REE diagrams are produced comparing Sample/Chondrite (normalized values) with Lu values. Future work will include calculating crystallization temperatures from Ti values. With this, I would like to calculate the fO2 from Trail et al. 2012. These values will be plotted against temperatures to then be plotted against buffer curves to understand the cut off between oxidized and reduced conditions. Considerations for measuring 50V and 50Cr in future LAICPMS methods for zircon analysis will help measure the interferences affecting 50Ti.
VIII. Timeframe and budget
Initial budget: LA-ICP-MS will require 144 zircon spot analyses plus 29 standardization processes. 12 zircons per unit (6) results in 72, 2 spots per grain (1 rim and 1 core) results in 144 spot analyses. Each spot analysis requires 2.25 minutes resulting in ~7.5 hours of LA-ICP-MS time for $73/hr, budgeting $547.50.
Final budget: Method required 39 ablation spot analyses plus 48 standardization processes. 23 zircons in total. Total analytical time was 2:14:22 analytical hours with plasma on at 9:40a (11/23/21) and off at 6:04p (11/23/21). Internal academic hourly cost is $73. This method development required ~$146 for the duration of laser firing. For total set-up and analysis time ~$580.