
SEM CL Lab | Structural Diagenesis
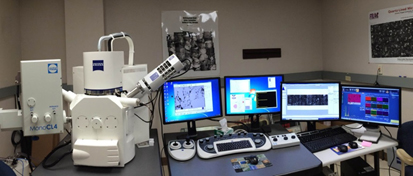
The Structural Diagenesis Initiative’s main microstructural imaging instruments are housed in the Bureau of Economic Geology’s Core Research Center in north Austin. The SEM lab contains our Zeiss Sigma field emission instrument and the FEI Nova Nano 430 Field Emission SEM. In separate laboratory space the Core Research Center also houses the initiative’s Fluid Inclusion Laboratory and the experimental Hydrothermal Laboratory.
Esti Ukar and S. E. Laubach manage the SDI SEM facility. Sara Elliott is the chief SEM operator for the program, responsible for leading imaging studies and for supervising training. Stephanie Forstner is another trained analyst in the lab. Andras Fall conducts imaging in association with fluid inclusion and hydrothermal lab studies. Kitty Milliken and Rob Reed have also participated in SDI studies and remain involved in some aspects of our research, particularly high-magnification studies.

Sara Elliott
About The Analysts | Sara Elliott is a Research Scientist Associate II, working with the Structural Diagenesis Initiative and the Fracture Research and Application Consortium.
Elliott’s research employs scanning electron microscopy to investigate diagenesis and porosity structure of deformation bands in sandstone, as well as pre-, syn-, and postkinematic cements in fractures in siliciclastic and carbonate rocks.
She also operates and maintains the SEM facility, and trains graduate students and outside researchers on the Zeiss SIGMA Field Emission Scanning Electron Microscope. Elliott also coordinates sample preparation and archiving for the SDI program.
Elliott received her BS in geological sciences and biology from the University of Miami in 2010 and earned her MS in geosciences from Pennsylvania State University in 2012.
Some of Elliott’s current work is summarized in the following report:
Elliott, S.J., Eichhubl, P., Landry, C.J., 2014. Effects of coupled structural and diagenetic processes on deformation localization and fluid flow properties in sandstone reservoirs of the southwestern United States. AGU, Fall Meeting Abstracts 1, 4336. | view
Please contact Elliott about access to the SEM and for training.
Publications featuring CL images
Many publications from the Structural Diagenesis Initiative feature images collected using three generations of SEM CL instruments or data derived from those images. Most recent papers rely on images collected with our Philips XL30 SEM, which was retired in 2014.
The following papers illustrate results obtained with our older SEM CL instruments.
- Ukar, E., Laubach, S.E., 2016, Syn- and postkinematic cement textures in fractured carbonate rocks: Insights from advanced cathodoluminescence imaging, Tectonophysics, v. doi: 10.1016/j.tecto.2016.05.001 | view
- Fall, A., Eichhubl, P., Bodnar, R.J., Laubach, S.E., Davis, J.S., 2015, Natural hydraulic fracturing of tight-gas sandstone reservoirs, Piceance Basin, Colorado. Geological Society of America Bulletin 127/1-2, 61-75. doi:10.1130/B31021.1 | view
- Becker, S.P., Eichhubl, P. Laubach, S.E., Reed, R.M., Lander, R.H., and Bodnar, R.J., 2010, A 48 m.y. history of fracture opening, temperature, and fluid pressure: Cretaceous Travis Peak Formation, East Texas basin. Geological Society of America Bulletin 122/7-8, 1081-1093; doi 10.1130/B30067.1 | view
- Gomez, L.A., Laubach, S. E, 2006, Rapid digital quantification of microfracture populations. Journal of Structural Geology 28, 408-420. | view
- Laubach, S.E., Reed, R.M., Olson, J.E., Lander, R. H., Bonnell, L.M., 2004, Coevolution of crack-seal texture and fracture porosity in sedimentary rocks: cathodoluminescence observations of regional fractures. Journal of Structural Geology 26/5, 967-982. | view
- Milliken, K.L., Laubach, S.E., 2000, Brittle deformation in sandstone diagenesis as revealed by scanned cathodoluminescence imaging with application to characterization of fractured reservoirs: Chapter 9, Cathodoluminescence in Geosciences, New York, Springer Verlag, 225-243.
- Laubach, S. E., 1997, A method to detect natural fracture strike in sandstones. AAPG Bulletin, v. 81, no. 4, 604-623. | view
Zeiss SEM and Gatan CL system
The following text describes our Zeiss Sigma High Vacuum Field Emission SEM with an Oxford X-Max 50 Silicon drift detector (SDD) and Gatan MonoCL4 system.
Automated High-Resolution SEM Imaging
Our scanning electron microscope and CL detector are designed to collect high-resolution structural diagenesis information over wide areas of rock. The Zeiss Sigma High Vacuum Field Emission SEM with an Oxford X-Max 50 Silicon drift detector (SDD) and a Gatan MonoCL4 system is specifically configured for large-area SE, BSE, EDS, and CL imaging of geologic samples.
Zeiss Sigma Field Emission SEM
The Zeiss Sigma HV FE SEM is equipped with a GEMINI column designed to work at low kV to minimize sample damage. The large chamber with a 5-axes cartesian stage is capable of covering a 5’’ x 5’’ travel distance for large area mapping. The BSE detector is mounted on the pole piece allowing for rapid transition from SE to BSE imaging.
The Oxford X-MAX has a SDD size of 50 mm2 providing a superb resolution and low energy detectability.
This instrument also has two independent modes for ‘CL like’ imaging: The MonoCL4 system provides crisp monochromatic, panchromatic, and colored-CL images with high spatial and spectral resolution. The Zeiss VPSE detector allows for secondary electron imaging variable pressure at low magnification. This VPSE detector will be enhanced with an Indigo CL detector to facilitate imaging of specimens containing carbonates without artifacts.
Aztec and Digiscan software allow for automated imaging and stitching of large areas.
Detectors
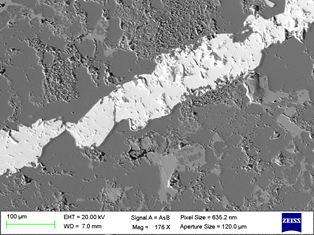
In AsB, grayscale is related to the atomic number (the lighter the higher the Z). Image of barite-filled vein in sandstone.
AsB (Angle-Selective Backscatter) detector
This detector is mounted in the pole piece. The number of backscattered electrons produced in an elastic collision between electrons and particles (atoms) depends on the atomic number (Z). BSE provides Z-contrast, channeling contrast (crystallographic and strain information), and qualitative compositional analysis.
Secondary electron (SE)
InLens detector (SE1)
Secondary electrons are emitted from the top 10nm of the sample surface by initial interaction with the sample . Therefore, this detector provides surface details at low energy. It provides high resolution images because it used at very short working distances.
This detector is designed to work at a range of beam energies, between 0.02-20 kV.
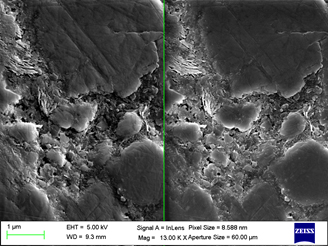
SE1 signal (right) and SE2 signal (left) of the same area. Compare the topographic information of the SE2 detector to the surface detail information of the SE1 detector.
Everhart-Thornley detector (SE2)
Secondary electrons are emitted after interacting with the topmost layer of the sample. This type of signal provides surface topographic information. This detector is designed to work at working distances between 5-12 mm and a range of beam energies, between 0.02-20 kV.
X-ray energy-dispersive spectroscopy (EDS)
The EDS detector is used to separate the characteristic X-rays emitted from the excited sample into an energy spectrum. From this spectrum, the chemical composition of materials can be determined as well as the abundance of specific elements.
Compositions can be acquired for micron-sized spots or displayed as elemental maps.
Variable-pressure secondary electron detector (VPSE)
This detector collects photons that are produced when a gas molecule is ionized, therefore it is designed specifically to work in a gaseous environment. VPSE imaging shows how different areas of a sample dissipate charge. It detects defects in a similar way to CL, but the signal is generated from a smaller interaction volume (higher resolution) and no photons are involved.
This device allows rapid large-area imaging.
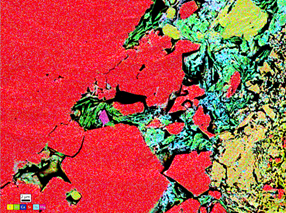
EDS map showing different elements in different colors.
Monochromatic CL spectra
Our MonoCL4 detector can be set to spectrum-imaging mode. Each material emits a characteristic spectrum that can be used to distinguish between materials. The intensity of the photons emitted at each wavelength is recorded.
Examples are shown at the bottom of the page.
Cathodoluminescence (CL) MonoCL4 detector
CL signal is produced when atoms bombarded by electrons return to the ground state and emit photons. CL signal depends on composition, lattice structure, and lattice damage. CL is useful for discerning cements and microfractures.
This mode of imaging is capable of unprecedented high resolution. Examples are shown at the bottom of the page.
Color CL
Color CL images can be constructed by combining three images of the same area collected using a blue, green, and red filter. Color CL can distinguish differences in grains and cement that aid in image interpretation. The process is discussed in Milliken and Laubach (2000).
Mapping
| Large-area mapping (SE1, SE2, AsB, VPSE, CL, and EDS) Large-area mapping enables the collection of high resolution images automatically. Aztec software (Oxford Instruments) is used for large-area EDS mapping, whereas Digiscan (Gatan) is used for CL images collected with the MonoCL4 detector. Either one of the two methods can be used for large-area mapping of the Zeiss detectors (SE1, SE2, AsB, VPSE). Simultaneous maps can be collected in a single run. The sampling and image processing procedures for large area imagine are described in: Gomez, L.A., Laubach, S. E, 2006, Rapid digital quantification of microfracture populations. Journal of Structural Geology 28, 408-420. | view |
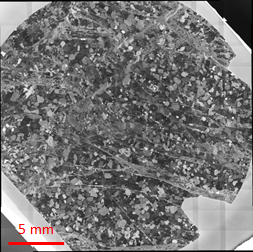 Whole-rock image of sandstone cataclasite outcrop plug acquired using VPSE. |
Selected recent papers illustrating large-area mapping
- Fall, A., Eichhubl, P., Bodnar, R. J., Laubach, S. E., Davis, J. S., 2015, Natural hydraulic fracturing of tight-gas sandstone reservoirs, Piceance Basin, Colorado. Geological Society of America Bulletin. v. 127, no. 1-2, p. 61-75. doi:10.1130/B31021.1
- Laubach, S.E., Eichhubl, P. Hargrove, P., Ellis, M.A., Hooker, J.N., 2014, Fault core and damage zone fracture attributes vary along strike owing to interaction of fracture growth, quartz accumulation, and differing sandstone composition. Journal of Structural Geology, v. 68, Part A, 207-226. doi: 10.1016/j.jsg.2014.08.007
- Hooker, J.N., Laubach, S.E., and Marrett, R., 2014, A universal power-law scaling exponent for fracture apertures in sandstone. Geological Society of America Bulletin, v. 126, no. 9-10, p. 1340-1362. doi: 10.1130/B30945.1
EBSD
Our Zeiss SEM currently has electron backscatter diffraction (EBSD) mapping capability, on loan from another JSG lab from Spring 2015. Our previous studies used the Oxford Instruments Nordlys detector attached to a Philips XL30 environmental scanning electron microscope (ESEM) in the Jackson School SEM lab. EBSD patterns are acquired at low vacuum on rectangular grids by moving the electron beam at regular step sizes between 5 µm and 10 µm, with an electron accelerating voltage of 30 kV, and a working distance of 21.5 mm. The overall indexing in the EBSD maps exceeds 70%. EBSD patterns are indexed and post-processed using CHANNEL 5 software from Oxford Instruments.
Selected Research Projects Underway using SEM CL
A wide range of studies are underway that take advantage of the resolution and large-area imaging capabilities of our instruments. Most of these studies aim to understand aspects of the overarching challenge of understanding how and why fractures form in the subsurface with the aim of doing a better job of predicting fracture attributes.
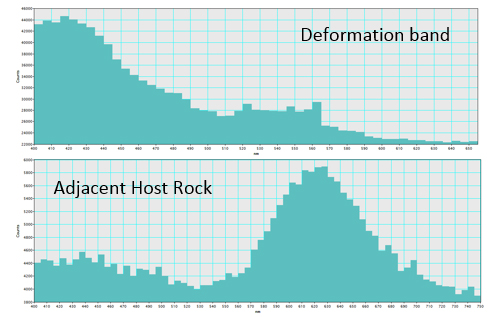 Comparison between CL emission spectra within a deformation band and adjacent undeformed host rock |
|
Fault Rock Diagenesis and Fault Zone Attributes
Fractured Carbonate Rocks Program