Results
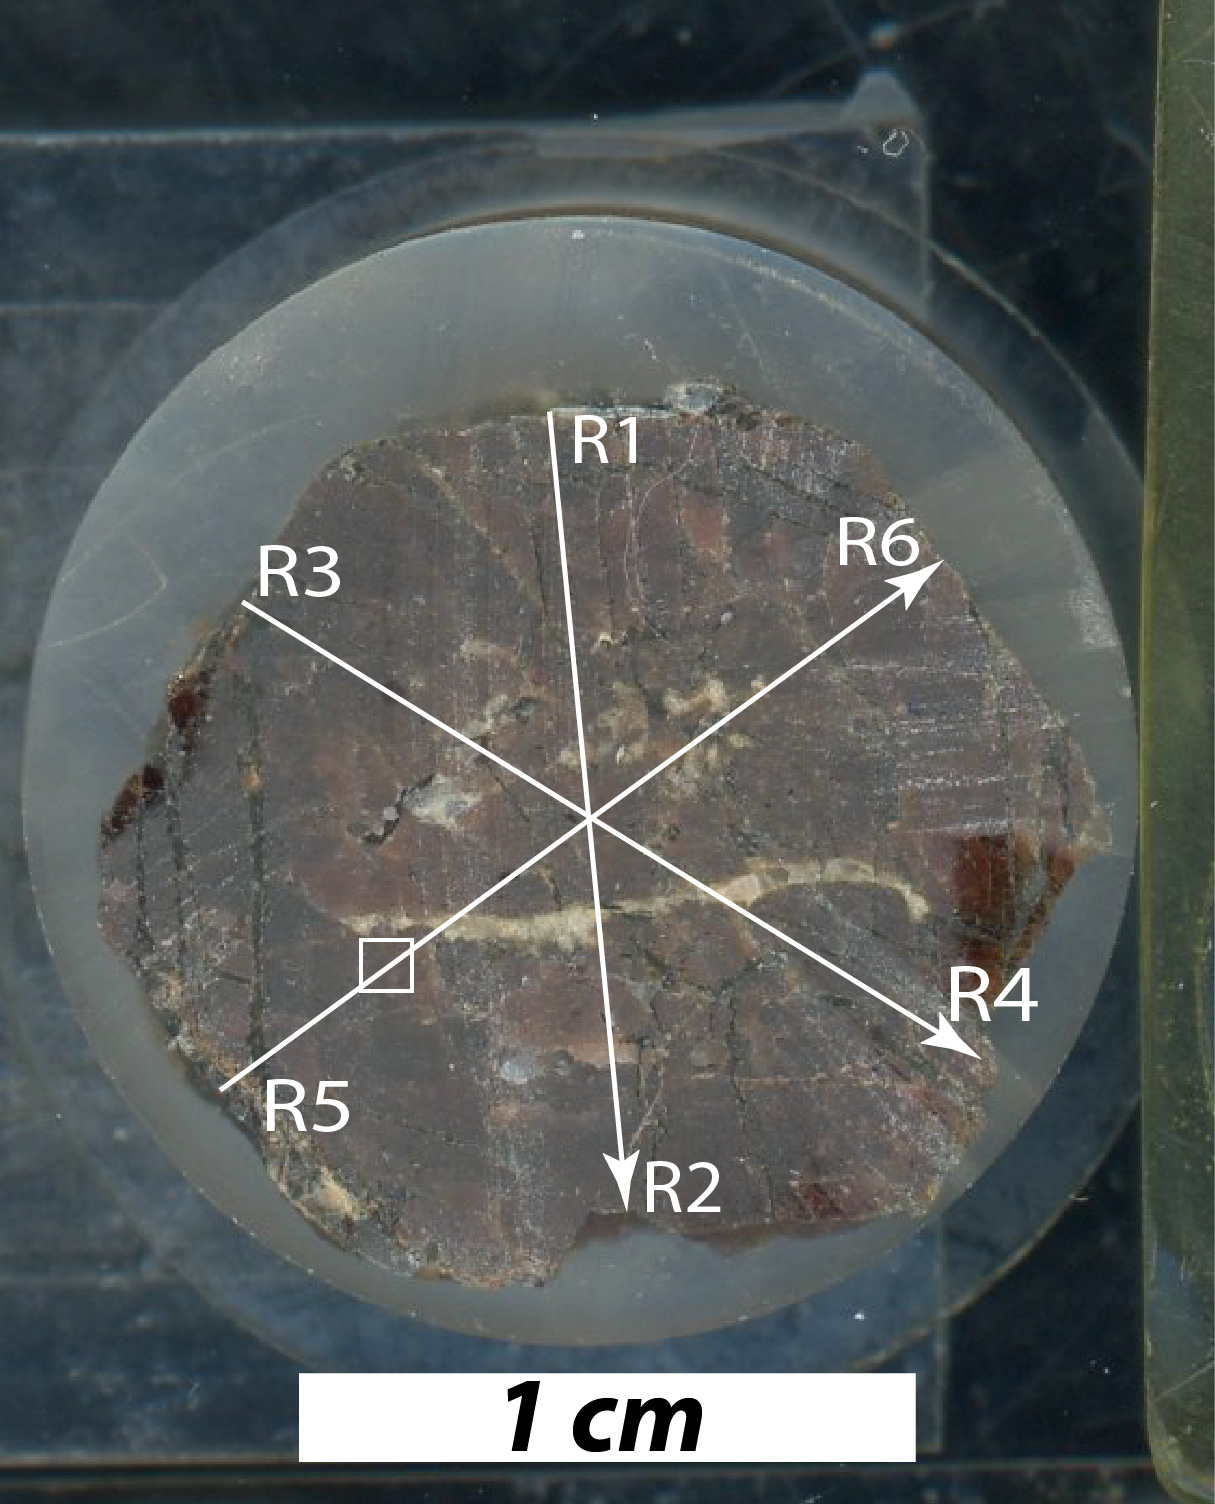
The three line scans were analyzed across the garnet grain from R1 to R2, R3 to R4, and R5 to R6 approximately shown in the picture below. The area that was mapped is delineated along the R5-R6 transect by the white square.
Linescans
As described in the methodology section, the final plots displayed below for each transect are the 7 point average for each analyte. Each transect is a rim-core-rim traverse across the garnet (see above picture).
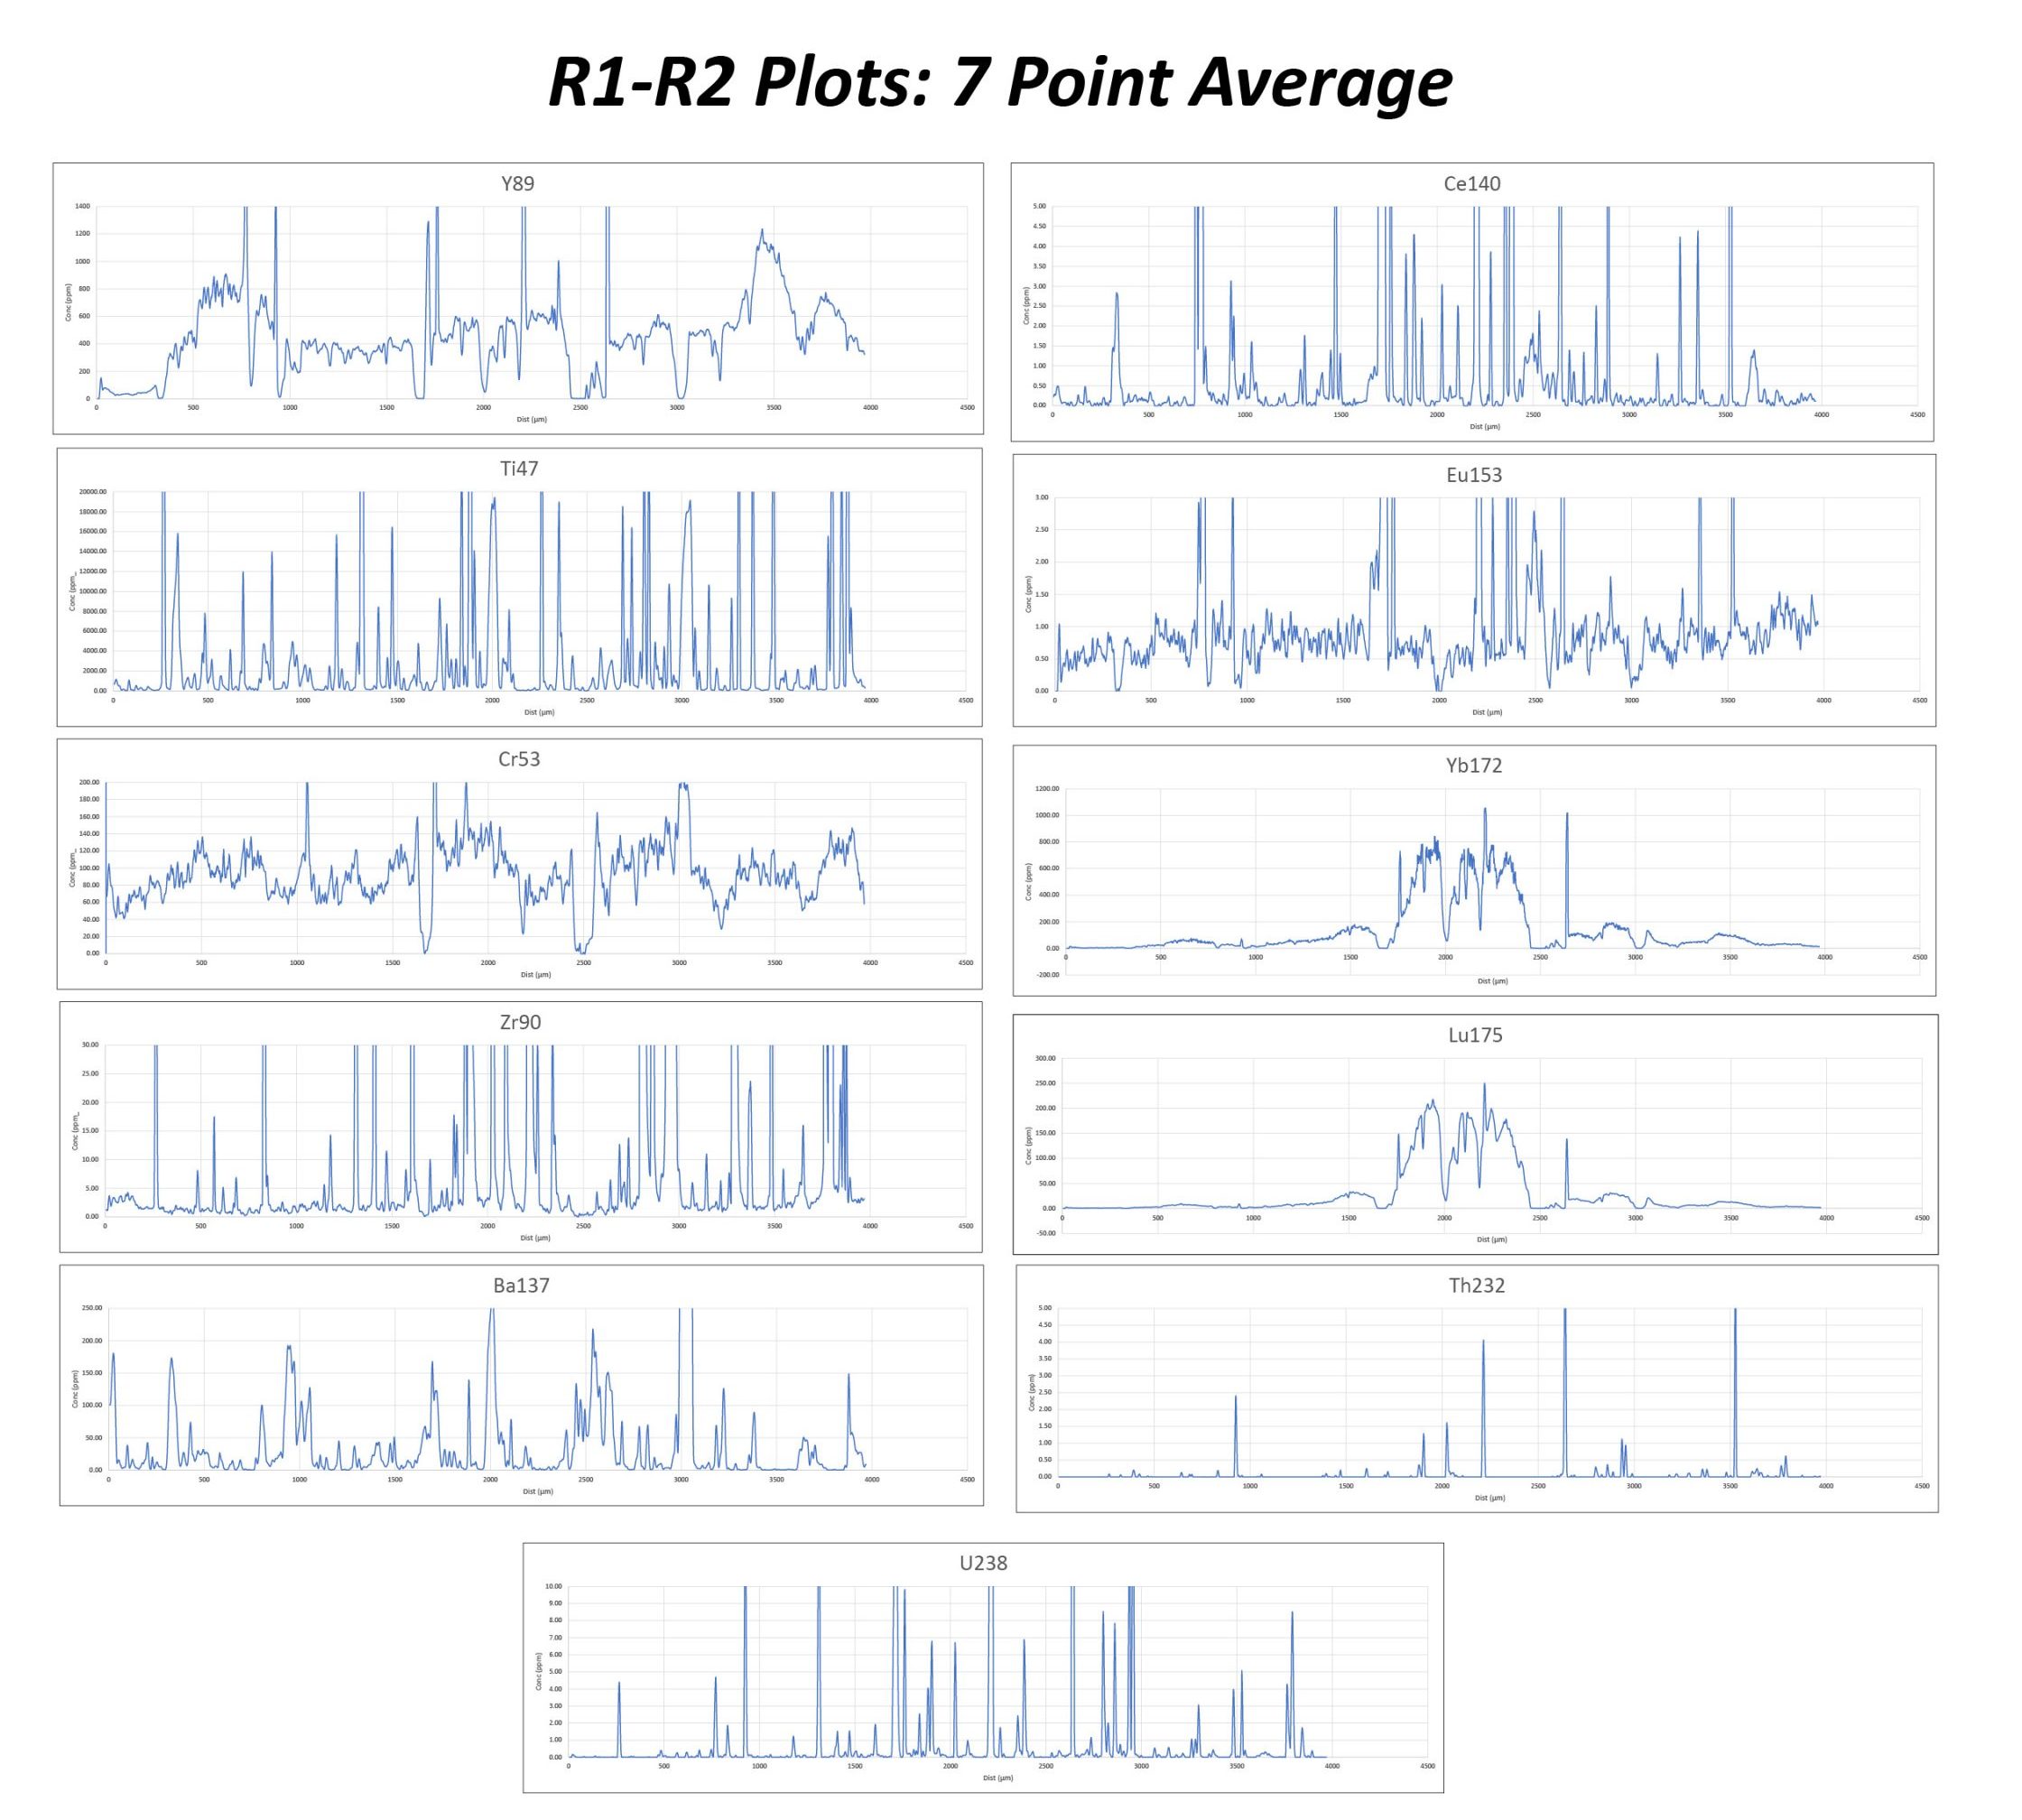
The most clear trends are seen in Y, Cr, Eu, Yb, and Lu. Y and Cr display a similar ‘M’ shaped pattern showing a core to rim depletion, enrichment, and depletion. Yb and Lu are also similar and show a less complex core to rim depletion (core = high in Yb/Lu; rim = low in Yb/Lu). Eu shows a weak core to rim enrichment. The other plots do not appear to show any meaningful trends.
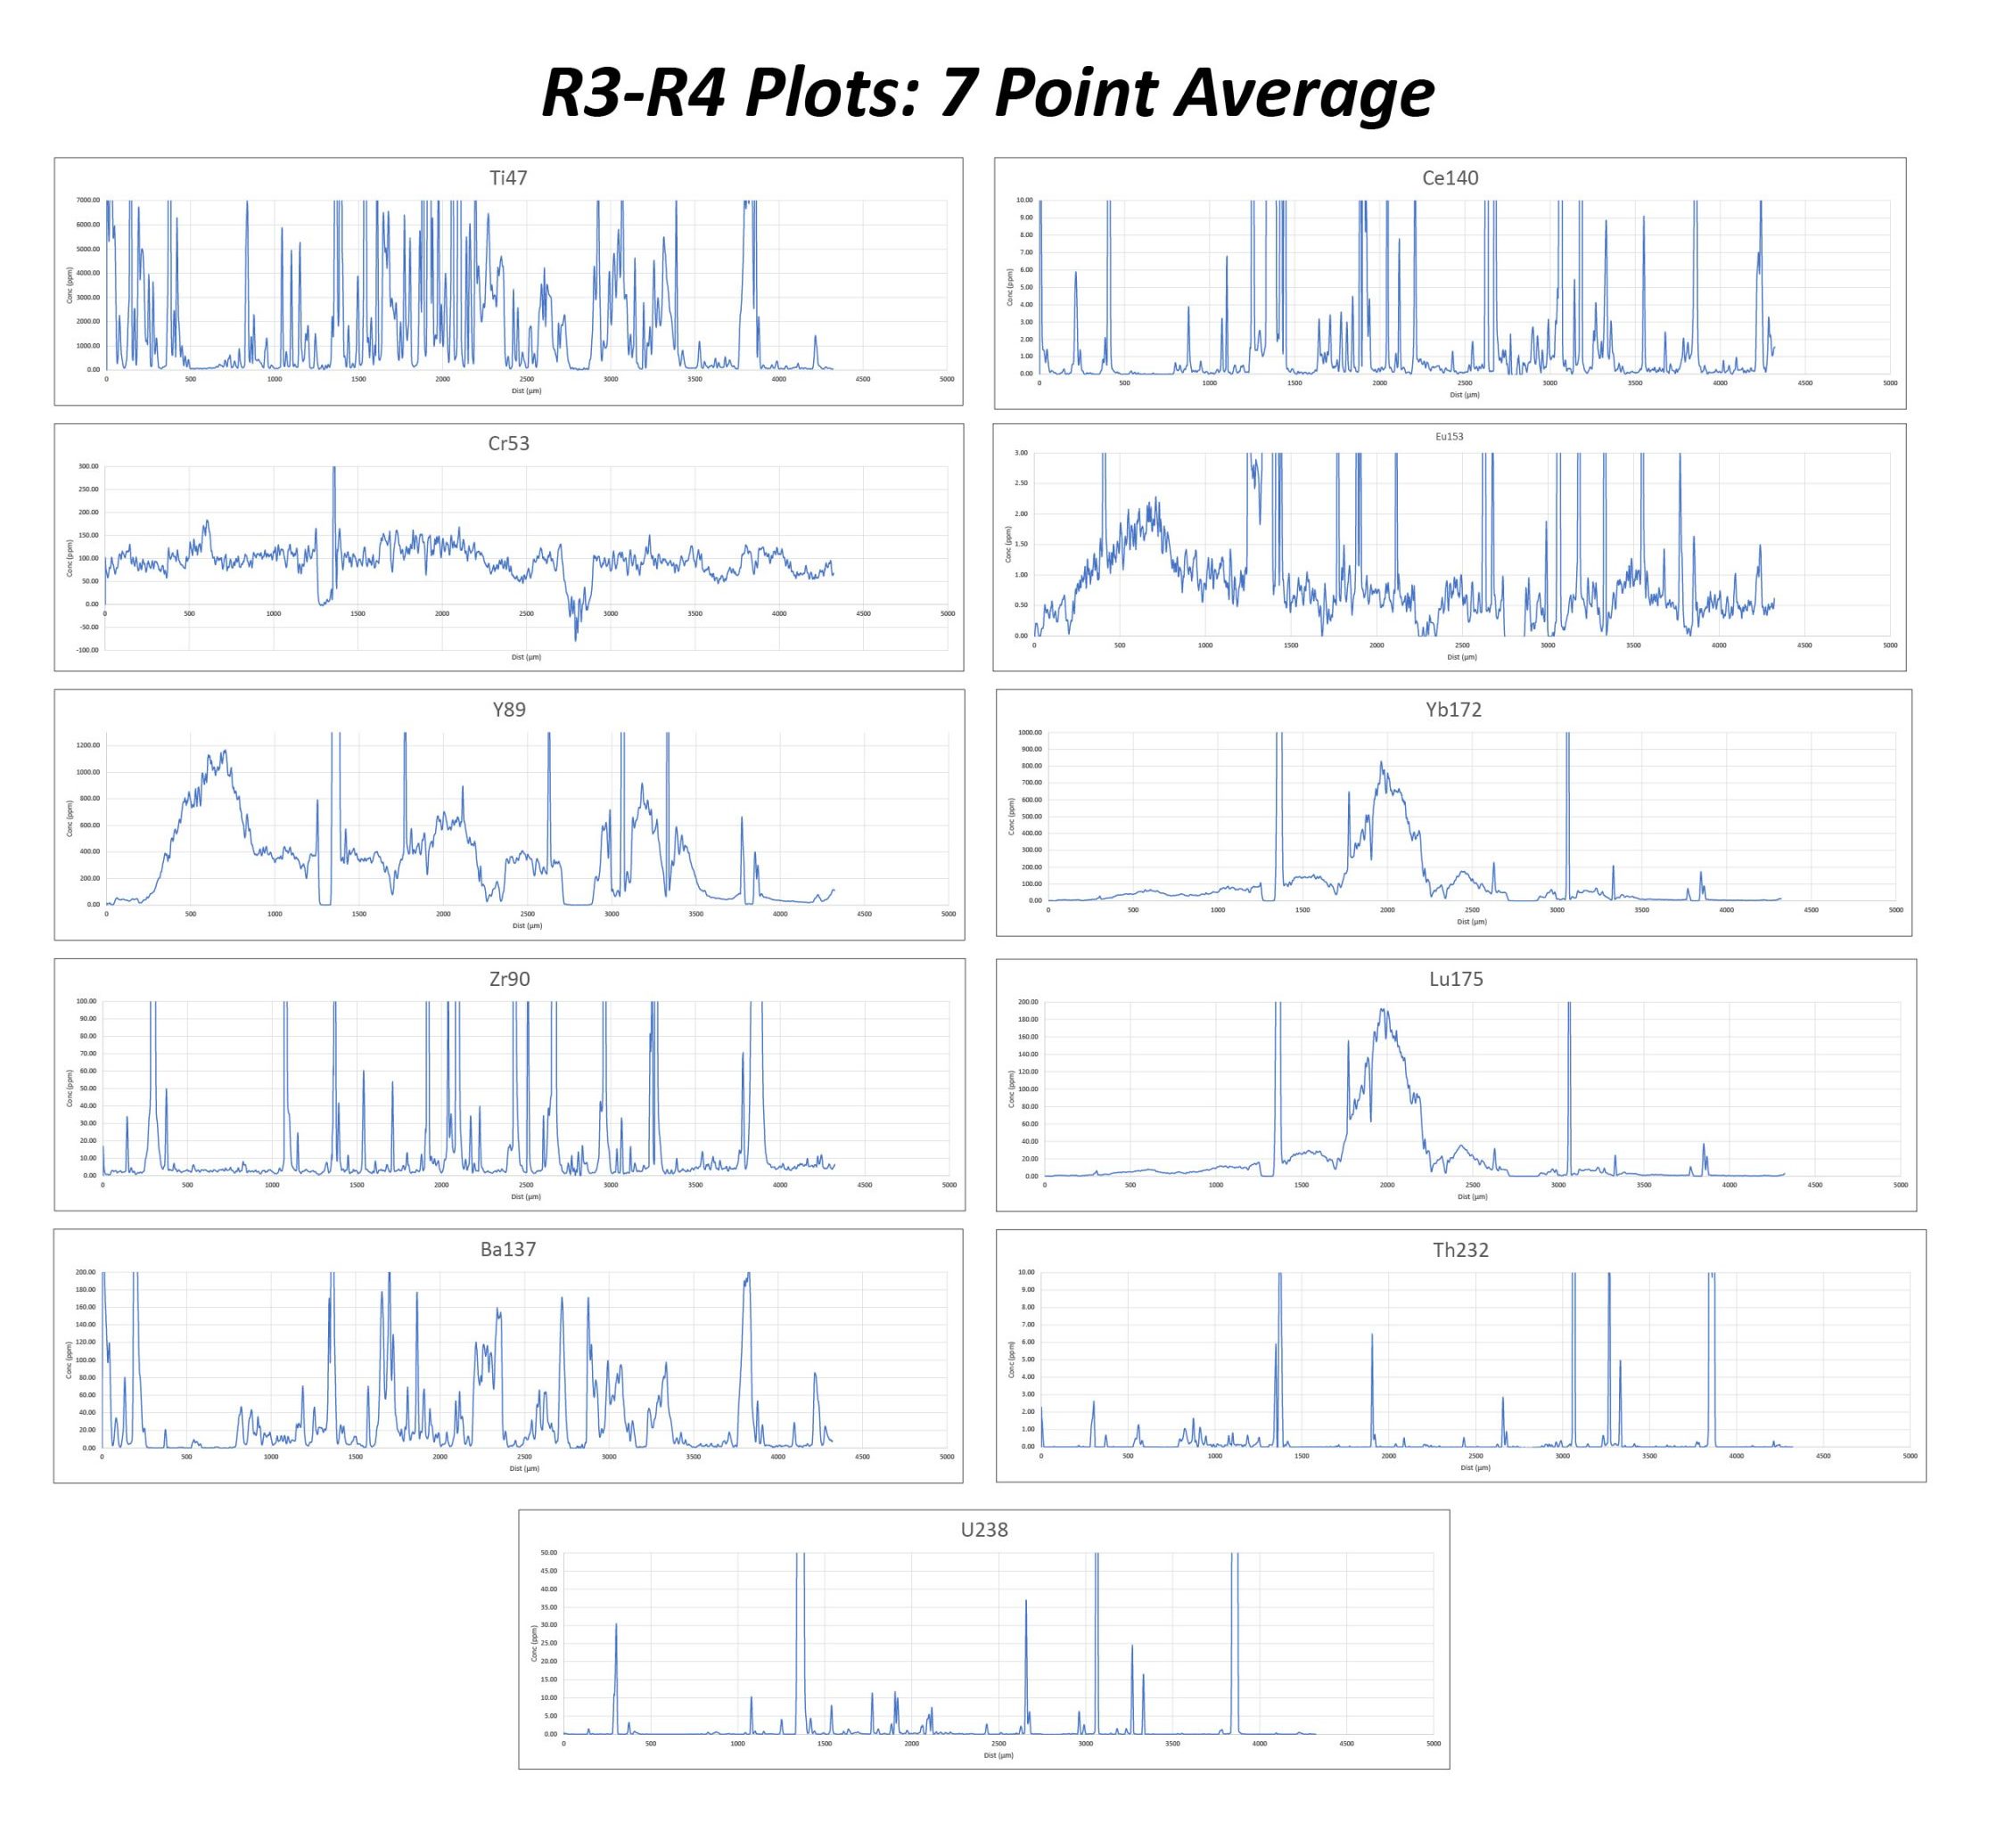
The plots from R3-R4 are similar to R1-R2, but show a few differences. The Cr trend is not defined as it is in the first transect. However, Y, Yb, and Lu are comparable to the R1-R2 transect. The Eu plot shows more of a ‘M’ pattern than in R1-R2.
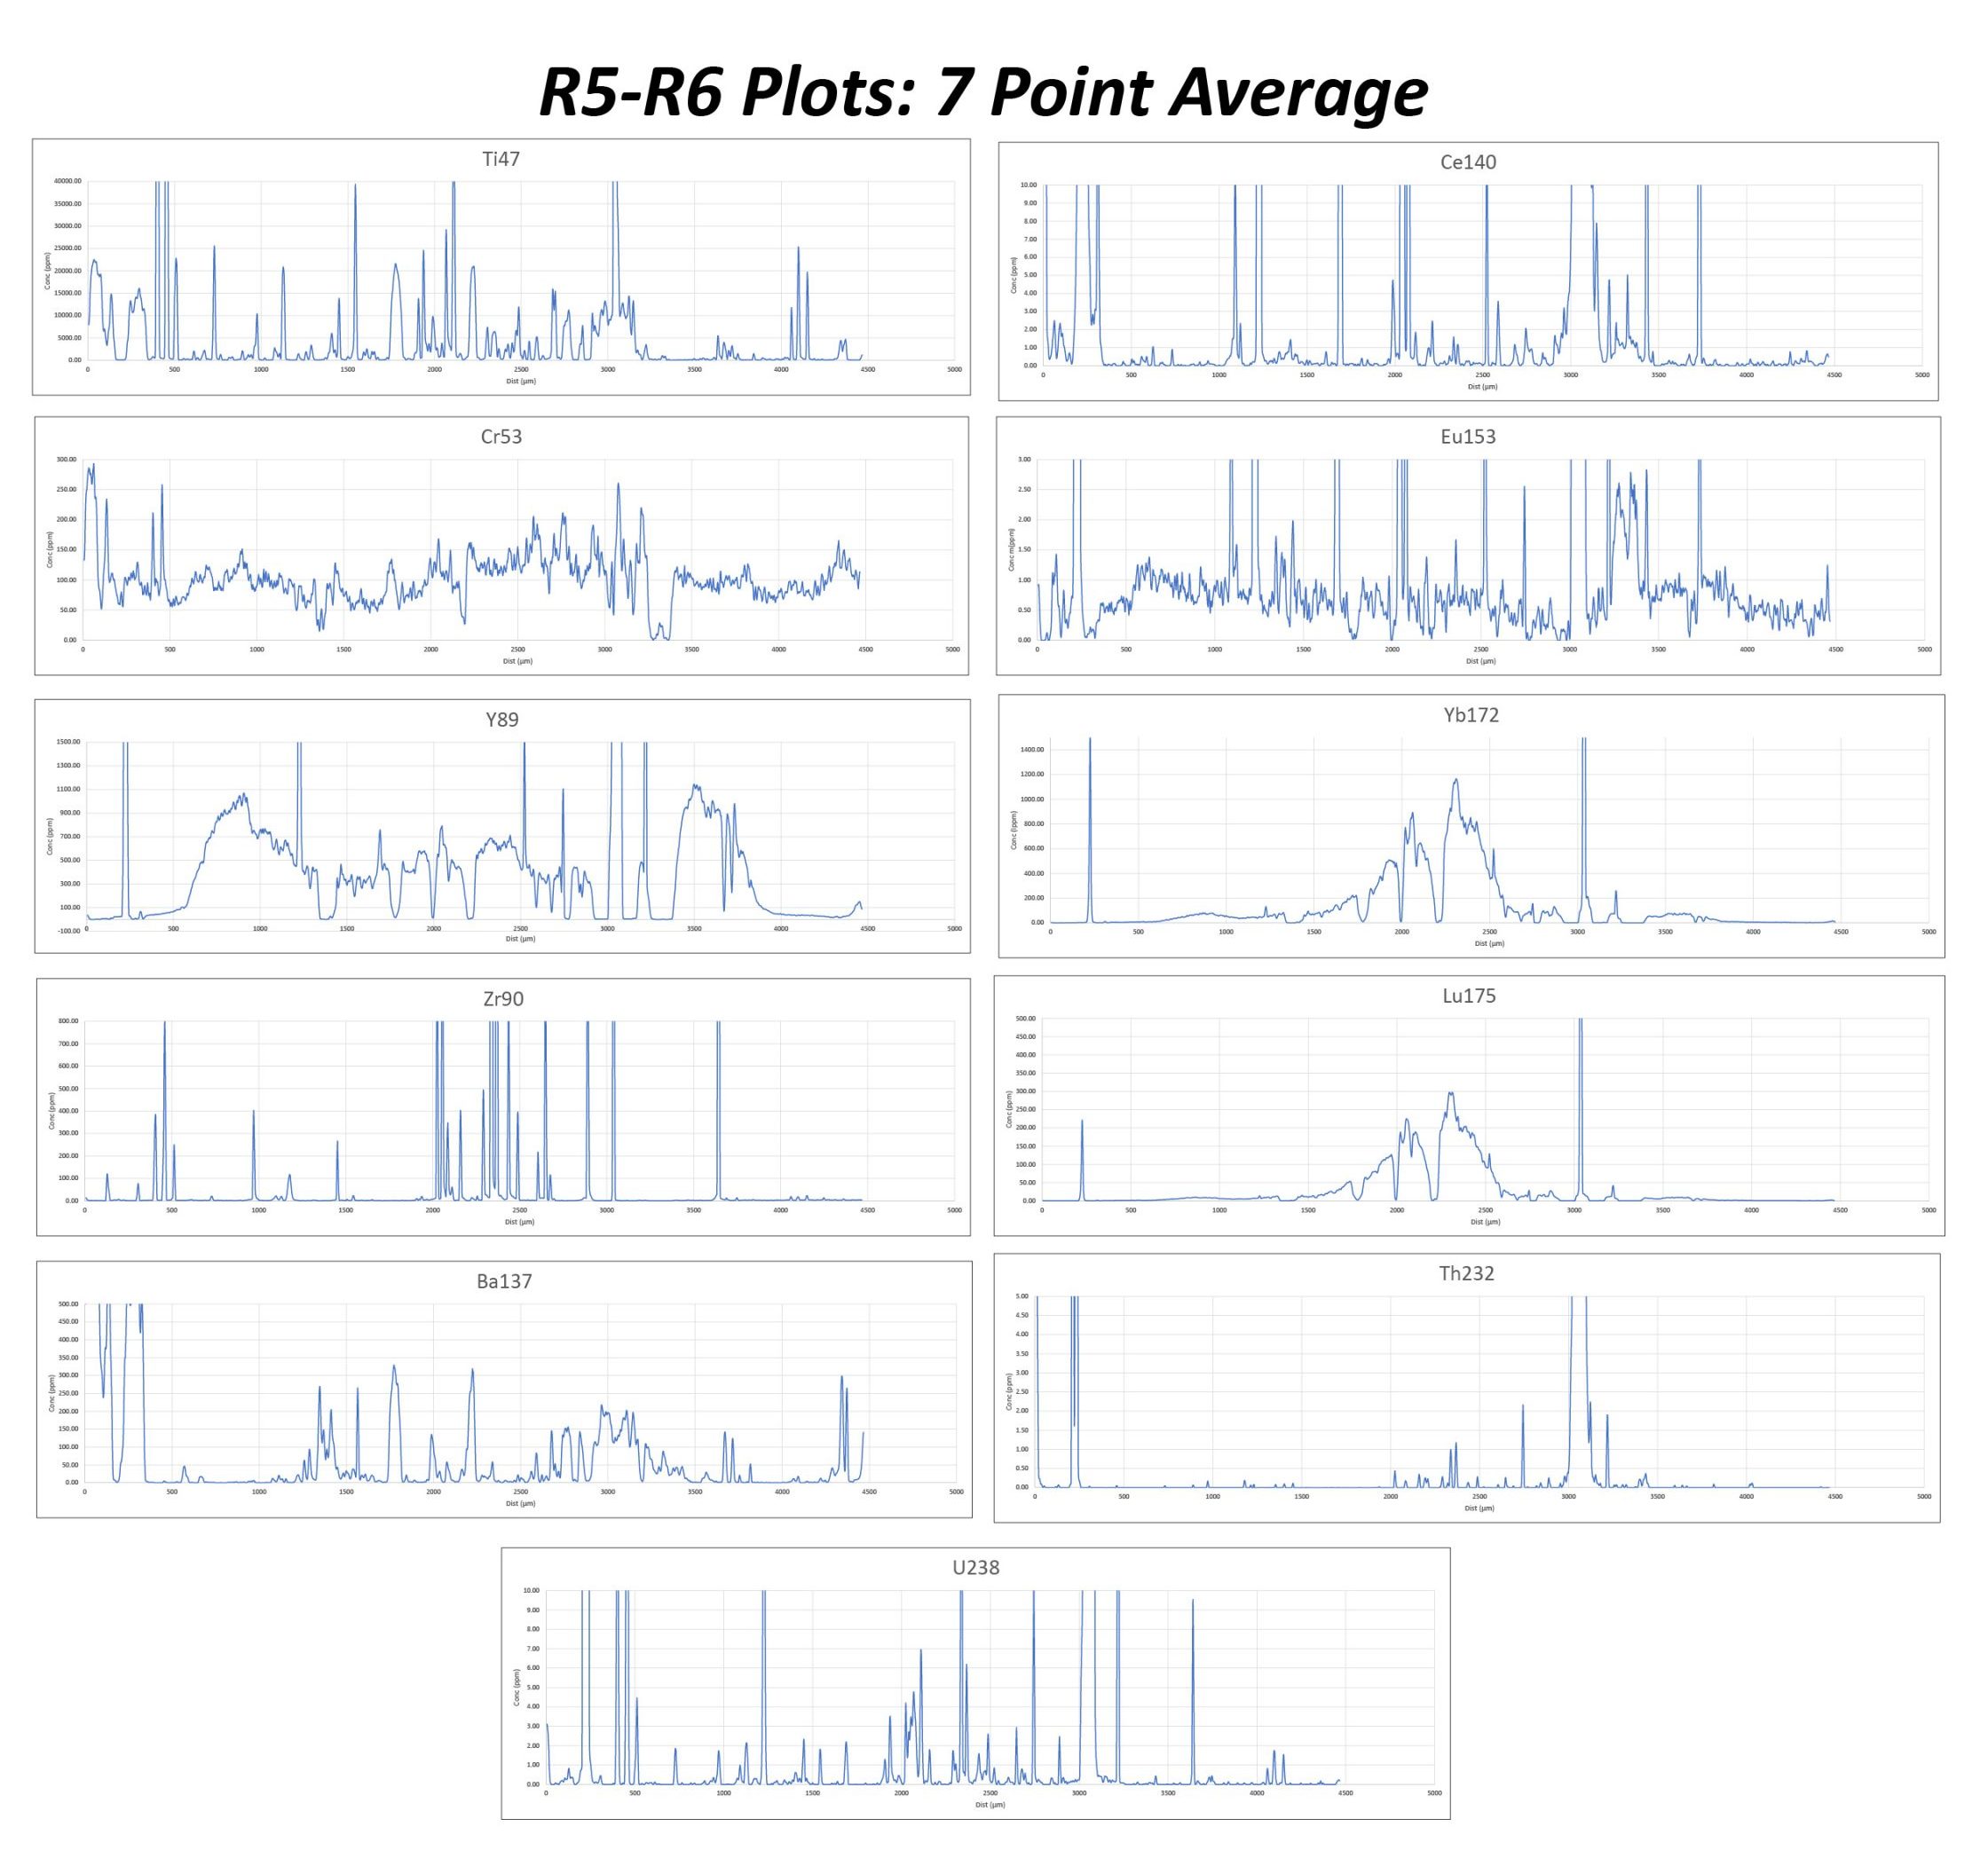
Again, the R5-R6 plots show similar trends to the other transects. The most notable difference is that the Eu plot shows a more defined ‘M’ pattern than the other transects. The similarity of the transects nicely displays the chemical symmetry of this garnet.
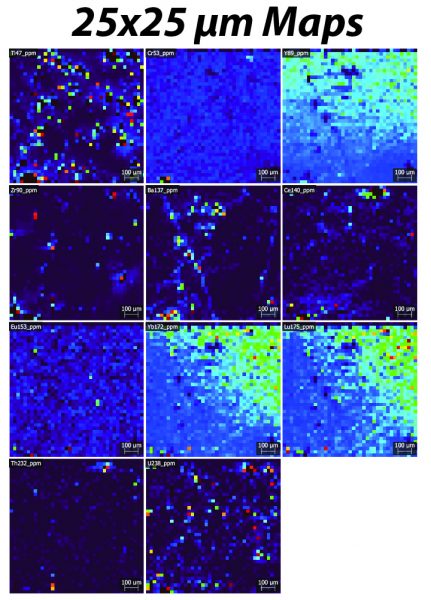
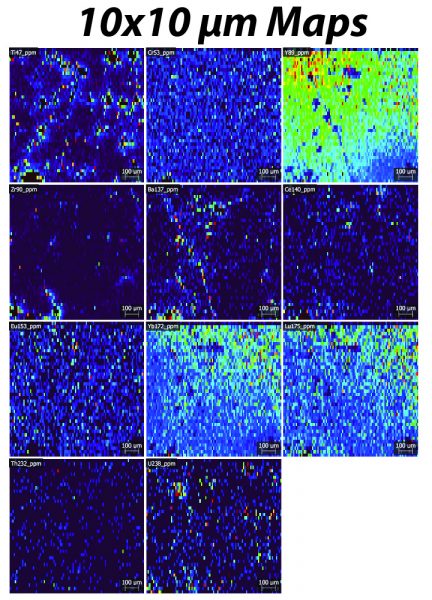
Maps
I made two sets of maps of the same 1mmx1mm area along transect R5-R6. The ablation parameters for each set of maps are identical except for spot size (see methodology section). Final maps are shown below: