Discussion
Applicability to Research Question
This methodology was fairly successful in addressing my research question. Though some of the elements did not show a diffusional pattern in the line scans (e.g., U, Th), they are still useful in identifying inclusions across the garnet. Before selecting these garnets for trace element analysis, I was unaware that they are loaded with inclusions ranging from quartz and plagioclase to what appears to be hundreds of zircons (seen in a thin section obtained after this analysis and supported by the Zr transects). The elements that do show diffusional patterns reveal a much more complicated metamorphic history than the major element maps show (Petrik et al., 2016).
A unique feature of the Y and Cr transects, and arguably the Eu transects, is the presence of two step-wise diffusional boundaries. Based on these profiles, I believe these garnets might have experienced two stages of growth related to different metamorphic events. There is also a slight difference in color between the core and the rim of this garnet. The core likely grew during the initial ultra-high pressure metamorphic event, and the rim could have grown during the partial melting event. Because major elements are more susceptible to temperature changes than trace elements, the diffusional profiles of the major elements from the first metamorphic event across the entire grain could have been lost during initial metamorphism or partial melting. Future work on these garnets could include forward modeling to try to constrain the duration of both the initial metamorphic event and the partial melting event. Additionally, the ages of these events constrained using monazite petrochronology by Petrik et al. (2016) could be tested by U-Pb geochronology of zircon inclusions across a garnet or by Sm-Nd or Lu-Hf geochronology of the garnet itself.
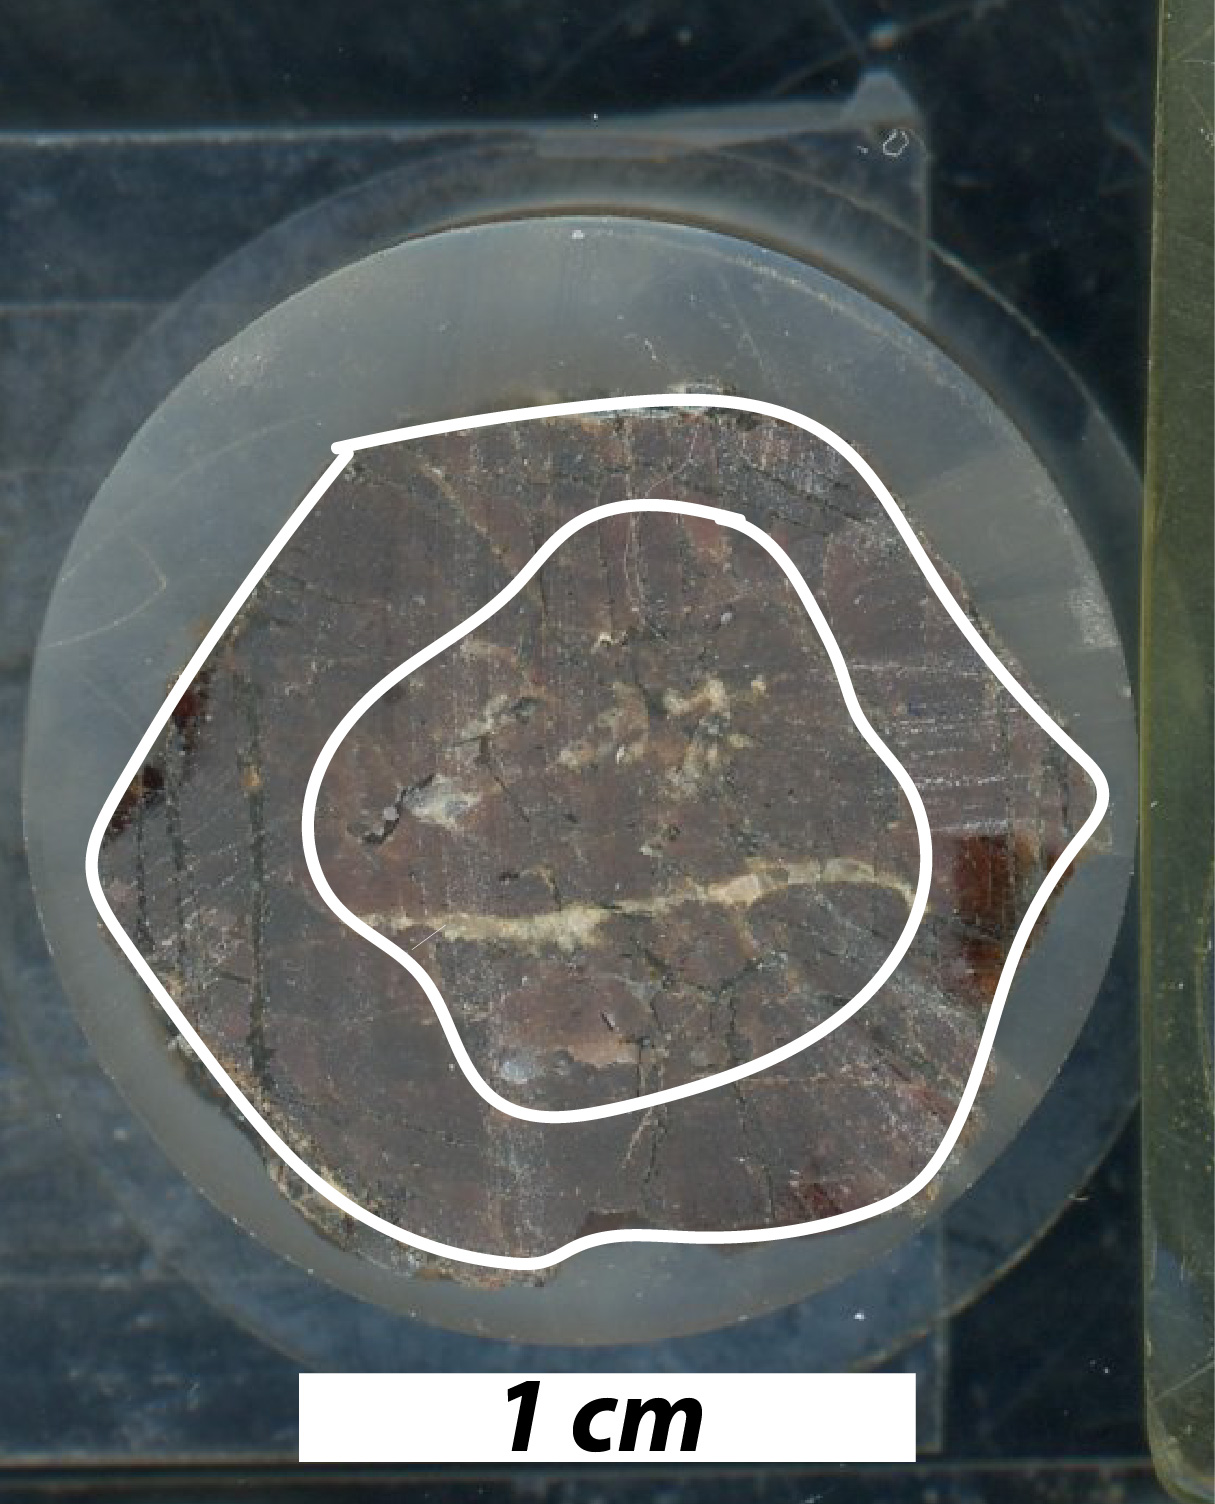
Two possible stages of garnet growth.
I was particularly interested in Eu in these rocks as an indicator of the partial melting event. The leucocratic layers in this rock formed during a partial melting event thought to have occurred ca. 160 Ma (Petrik et al., 2016). Eu is a unique REE due to the Eu anomaly, where the Eu concentration in a mineral is either enriched or depleted. This occurs because the Eu2+ ion is similar in size to Ca2+ and will preferentially partition into Ca rich minerals. Though garnet is a calcium-bearing mineral, Eu2+ tends to be preferentially incorporated in plagioclase in magma. With this in mind, I predicted that this garnet would show a core to rim depletion in Eu. Instead, most of the Eu transects show a less defined ‘M’ pattern of core to rim depletion, enrichment, and depletion. Though this is complicated to interpret, my initial idea is that if the garnet experienced two stages of growth, Eu partitioned out of core of the garnet during the very beginning of the partial melting event before the second stage of garnet growth. This second stage of garnet growth would have happened early during the partial melting event after Eu diffusion out of the core when temperatures were around 400-600℃. After the second stage of growth, Eu likely began to diffuse out of the outer rim of the grain when plagioclase began to grow around 1000℃. However, more work is needed to substantiate this idea. Future work could include in-situ garnet petrochronology, in-situ petrochronology of inclusions from areas of Eu enrichment, or forward modeling of garnet growth and melt behavior of the leucocratic layers using the program Theriak-Domino (de Capitani and Petrakakis, 2010).
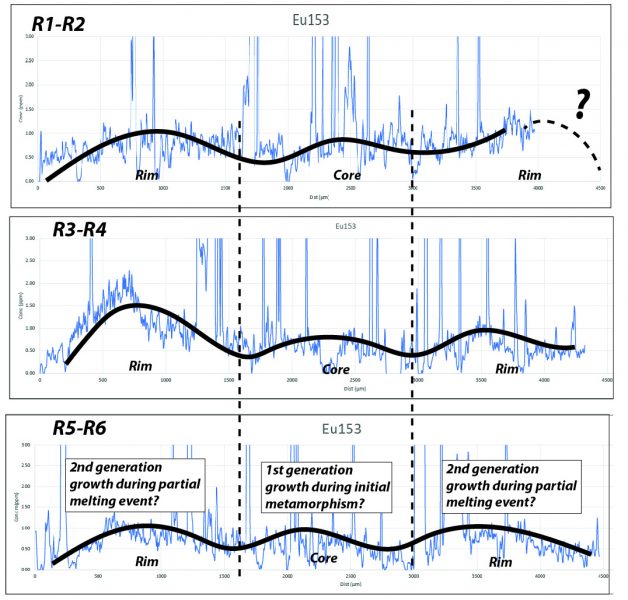
Graphic displaying the similarities between the Eu transects and the ‘M’ shaped diffusional pattern. I suspect that transect R1-R2 might have a piece of the original rim missing, so I drew in what I believe the missing rim would show based on the symmetry of the other two transects.
The maps did not tell me anything more than the transects as I did not map the entire garnet. A map of the whole garnet would have taken too long for the scope of this project (>24 hours of laser time). However, the method development that went into making these maps will help with future maps of large grains because of the information gained regarding spot size. Data processing for the 10×10 μm maps proved to be challenging. Though they should be square, the pixels in these maps are rectangular. When I adjusted the map size parameters in iolite to obtain square pixels, the shape of the maps was not right and the features seen in the 25×25 μm maps were distorted. One possible explanation for this problem provided by Dr. Miller is that if there were 2 quadrupole cycles per pixel, the image becomes wider. Additionally, I do not believe that the increased resolution of the 10×10 μm maps is worth the additional analysis time for the purposes of this particular analysis. A smaller spot size would be much more important for a smaller grain. However, not much data is lost in a garnet this large. If I were to make a whole garnet or partial (core to rim) map of these garnets in the future, I would make the maps in conjunction with line scans to ensure that important detail is lost using a larger spot size.
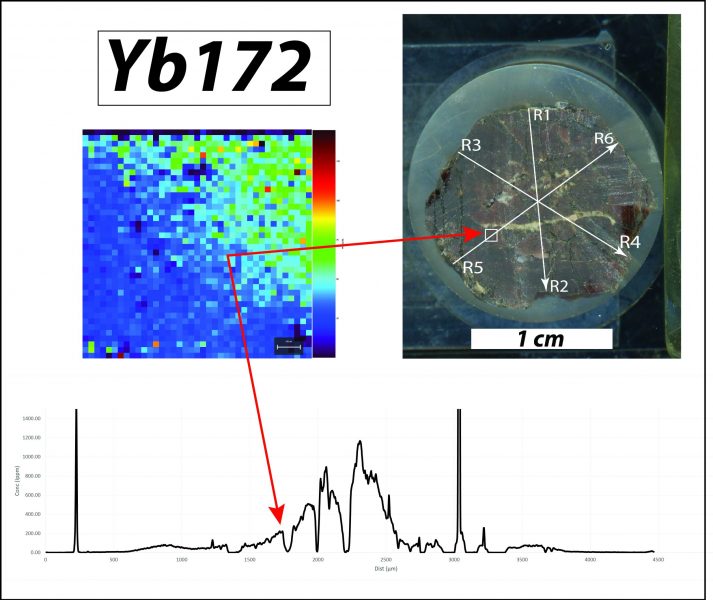
Graphic comparing the individual 25×25 μm Yb map with the R5-R6 Yb line scan. I believe the increase in Yb concentration in the upper right corner of the map correlates to the color change in the core of the garnet.
Planned vs. Final Methodology and Budget
Initially, I wanted to investigate 33 different analytes. However, increasing the number of analytes comes at a cost. In order to preserve the quality of the data for some of these trace elements with extremely low concentrations, I reduced the number of analytes to 12 (including 1 internal standard element). Additionally, I wanted to map the entire grain before I realized the time it takes to map, especially mapping 12 analytes. Instead, I chose to map a portion of the garnet along one of my transects where the garnet has a visible change in color in the hopes of seeing a noticeable change in concentration. The budget was also $620.50 higher than I estimated before the project, due in large part to my inexperience with the program iolite.
| Budget | ||
| Time (hours) | Cost ($73/hour) | |
| Data Collection | 8.5 | $620.50 |
| Iolite Processing Line Scans | 4 | $292 |
| Iolite Processing Maps | 6 | $438 |
| Total Cost | $1350.50 | |
Improvements for Future Work
Though I am happy with the results of my methodology, I think something important to consider for future studies on garnet is that garnet from different metamorphic conditions will contain variable amounts of different trace elements. I think that especially for these kinds of projects, testing on representative unknowns is critical in order to ensure that the data collected will be useful from any particular garnet. I wish that I had understood this testing better when I was working on this garnet because I might have switched out some of the analytes I chose. I would have liked to see more diffusional profiles and less indicators of inclusions, which is what some of my analytes turned out to show.