Discussion
Data Validation
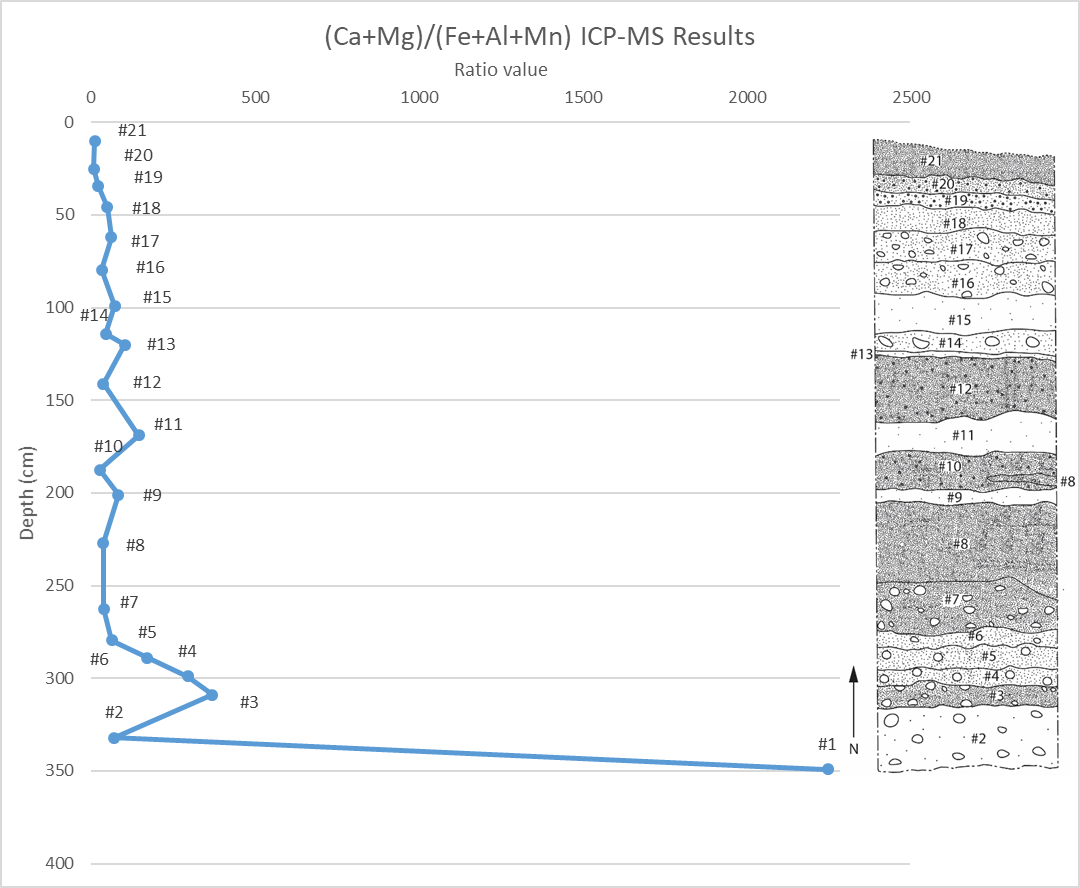
Following a stepwise data reduction I had picked 19 analytes as being suitably bracketed by the calibration standards and corroborated by the NIST 1643f (10x) standards (see methodology, final section). Turning to the limit of detection (LOD) values (see below) most of them were quite good for the measured analytes and methods. However, Na, Ca, and K all have LOD values on the higher end. Calculating the signal to noise ratio by dividing the median value by the LOD (average values are not used because of skew caused by outliers), we find our fears are mostly assuaged. However, Na remains a problematic analyte and calculated concentrations should be taken with a grain of salt until background noise is accounted for. In part to crosscheck this method, I calculated the Ca+Mg to Fe+Al+Mn ratio using the dilution factor adjusted ICP-MS values (see below) in order to compare to ratio values found using XRF. Amazingly, though the values have changed, the overall pattern closely resembles what was noticed with the XRF. Overall, these results validate the basic method and principals used in this procedure.
| LOD | Median | Max | Min | Signal-to-noise | |
| 23Na (NG) | 12.754079 | 87.53 | 161.3 | 43.97 | 6.86 |
| 24Mg (He) | 0.3726636 | 1011 | 5826 | 297.10 | 2,712.90 |
| 27Al (NG) | 0.8864857 | 177.6 | 1688 | 0.96 | 200.34 |
| 28Si (H) | 0.1955474 | 1103 | 5054 | 64.04 | 5,640.58 |
| 31P (NG) | 1.3694904 | 52.08 | 191.8 | 9.97 | 38.03 |
| 39K (He) | 3.3393602 | 148.8 | 1707 | 16.29 | 44.56 |
| 40Ca (H) | 13.805816 | 11690 | 20670 | 9,141.00 | 846.74 |
| 51V (He) | 0.0247787 | 6.59 | 21.17 | 0.06 | 265.95 |
| 53Cr (He) | 0.126379 | 3.431 | 22.66 | 0.05 | 27.15 |
| 55Mn (NG) | 0.0841907 | 26.99 | 176.9 | 2.70 | 320.58 |
| 56Fe (H) | 0.2324814 | 61.49 | 586.7 | 0.41 | 264.49 |
| 59Co (NG) | 0.0267348 | 5.999 | 30.15 | 0.93 | 224.39 |
| 60Ni (NG) | 0.0244528 | 17.47 | 90.17 | 3.65 | 714.44 |
| 63Cu (NG) | 0.0556218 | 6.577 | 47 | 0.83 | 118.24 |
| 66Zn (NG) | 0.1419816 | 3.748 | 27.84 | 1.07 | 26.40 |
| 88Sr (NG) | 0.1050768 | 117.1 | 175.3 | 28.50 | 1,114.42 |
| 137Ba (NG) | 0.0202457 | 231.7 | 936.3 | 55.12 | 11,444.43 |
| 206Pb (NG) | 0.022113 | 7.719 | 42.84 | 1.29 | 349.07 |
| 238U (NG) | 0.0023236 | 0.08592 | 0.3031 | 0.02 | 36.98 |
Method Modifactions
A major change to the project procedure was the dataset involved. Because of concerns about limited sample, I shifted away from the soil core that I had intended to study and instead analyzed soil samples collected during my master’s thesis research. Another change was shifting away from total digestion using strong acids during sample prep, and instead I opted to perform a partial extraction in order to isolate archaeological residues and minimize geologic inputs. This was safer and more likely to isolate trace elements. However, samples were still found to be between 83 and 97% calcium after the semi-quantitative analysis. I did not predict having to make two more dilutions after the semi-quantitative study, but that is the nature of a semiquantitive approach to unknown soil samples. The last significant change was removing analyte such as Hg and Ag from my method due to time constraints and limitations imposed by the standards. My initial estimated cost decreased significantly as well (see table below for updated calculations).
| number of samples | number of analyses per sample | cost/analysis | total cost |
| 21 | 3 | 17 | $1,071 |
Future Work
The most important changes will involve making further refinements to the method. During sample preparation, efforts should be made to speed up the digestion in order to minimize loss of solution to evaporation. Centrifuging should be for an extended period of time to ensure that no particulate is introduced into the instrument, and so that mulitple rounds of centrifuging are not necessary. And finally, integrating a method for mercury would be hugely beneficial. Otherwise, the data are sound enough to suggest that this tentative first step towards method development has been successful.