Results
Data: LINK
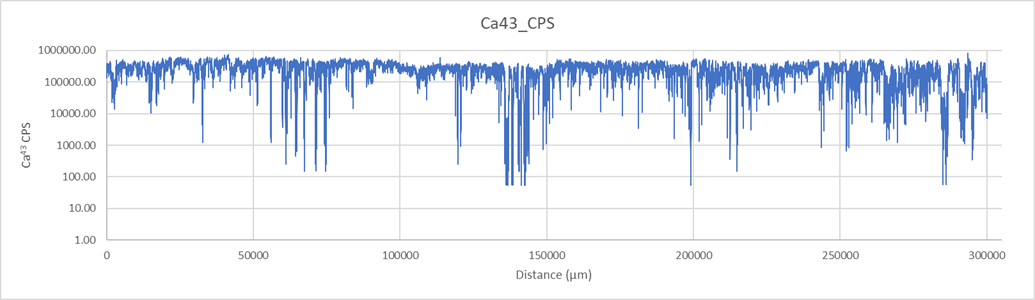
Figure 2: Stiched line scan for calcium. As distance increases, the sample is younger.
Here is the time series data for the entire line scan (lines 1 through 4 were stitched together and repeat samples were subtracted) for only Calcium. Visible outliers appear from the main line, this is most likely due to the laser-ablating epoxy and not travertine or calcium carbonate. For that reason, the calcium is not counted and the counts per second dip very low. The sample was highly porous and variable towards the end of the ablation.
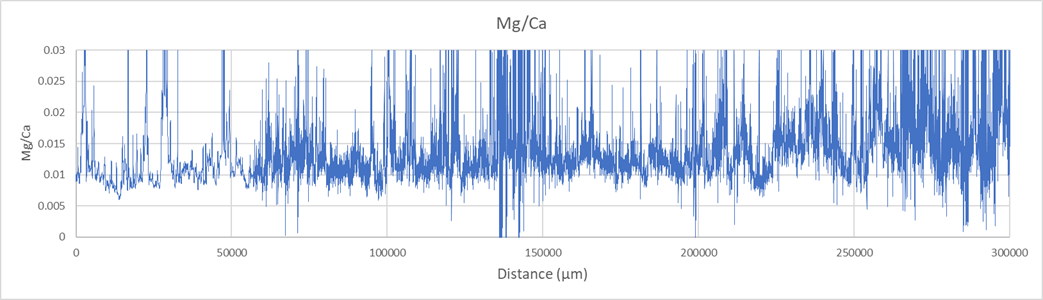
Figure 3: Stiched line scan for the magnesium-calcium ratio. As distance increases, the sample is younger.
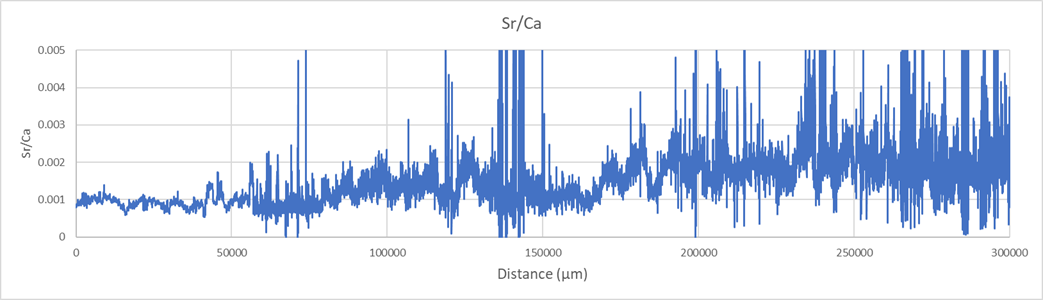
Figure 4: Stiched line scan for the strontium-calcium ratio. As distance increases, the sample is younger.
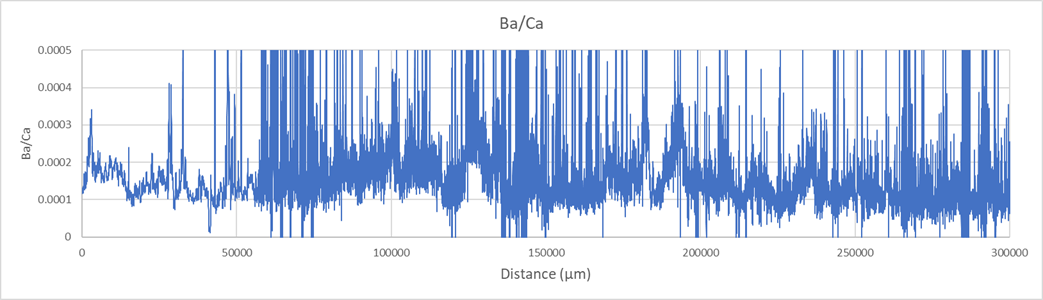
Figure 5: Stiched line scan for the barium-calcium ratio. As distance increases, the sample is younger.
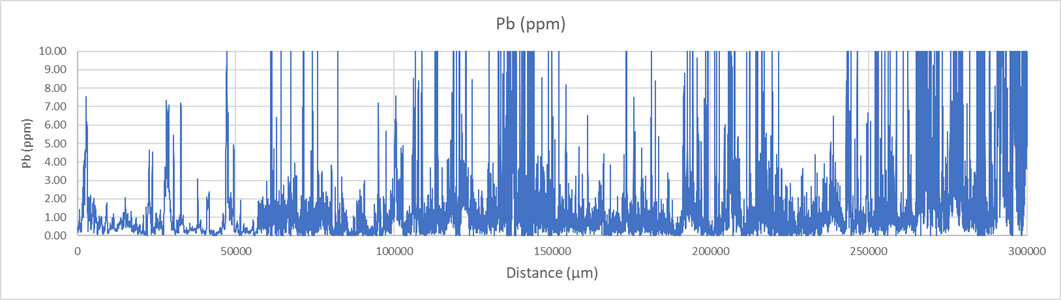
Figure 6: Stiched line scan for lead (ppm). As distance increases, the sample is younger.
Above is a similar time series line scan as Figure 1. Only for the Mg/Ca, Sr/Ca, and Ba/Ca. The line scan spans all 28 layers. Through the noise, there is visible cyclicity for all the ratios. The overall ratios for Mg/Ca and Sr/ do seem to increase with time. Lead does not see a distinct overall trend, however, it seems to be heavily affected by pore space and gets increasingly noisy with time.
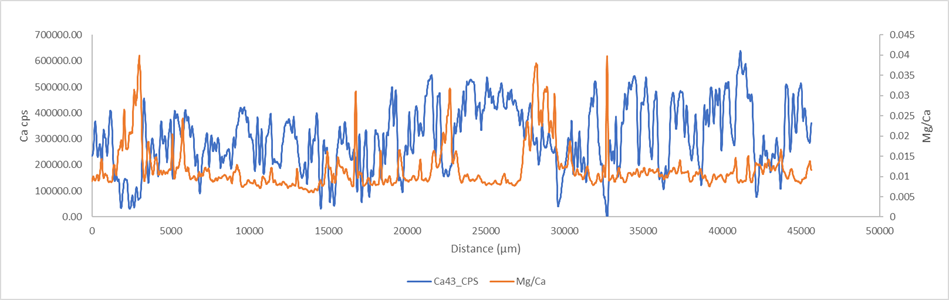
Figure 7: Line scan for calcium (cps) and the magnesium-calcium ratio, only for layers 28 – 25. As distance increases, the sample is younger.
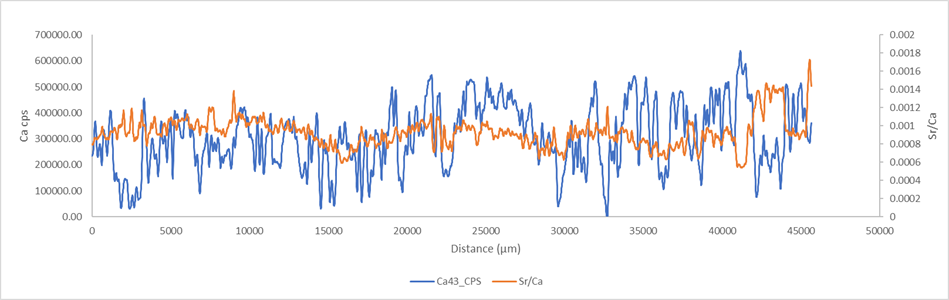
Figure 8: Line scan for calcium (cps) and the strontium-calcium ratio, only for layers 28 – 25. As distance increases, the sample is younger.
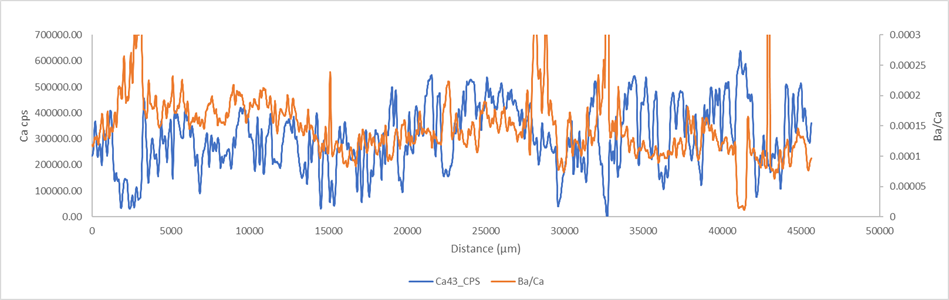
Figure 9: Line scan for calcium (cps) and the barium-calcium ratio, only for layers 28 – 25. As distance increases, the sample is younger.
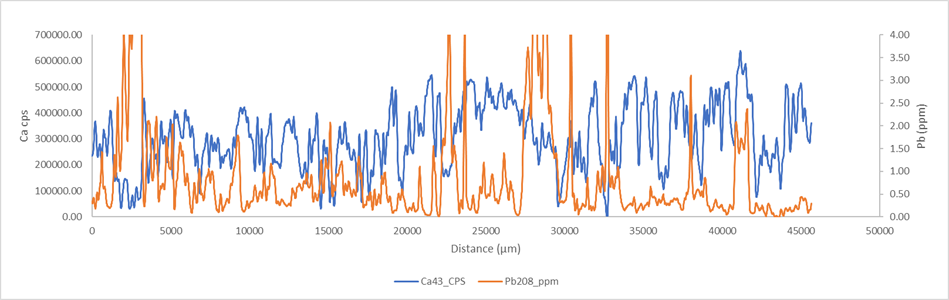
Figure 10: Line scan for calcium (cps) and lead (ppm), only for layers 28 – 25. As distance increases, the sample is younger.
Within 3 layers, cyclicity is seen especially in Sr/Ca and Ba/Ca, however for Mg/Ca and lead a pattern is less apparent. The porosity of travertine is even more apparent on shorter distances, as the counts per second are rarely stable for long, and dips are very common.