Methods
Sample Preparation
The sample transects were shaved off of a larger epoxied slab taken in 2006 from Loop 260/2222. The sample was already sanded and placed in epoxy. In order to get the transects to fit into the laser ablation cell the transects were split in half and placed on top of polymer clay in order to get the surface of the travertine sample as flat as possible. MACS – 3, and NIST 610 and 612 were used as calibration standards and also placed within the laser ablation cell. See Figure 1 for the components and layout of the laser ablation cell.
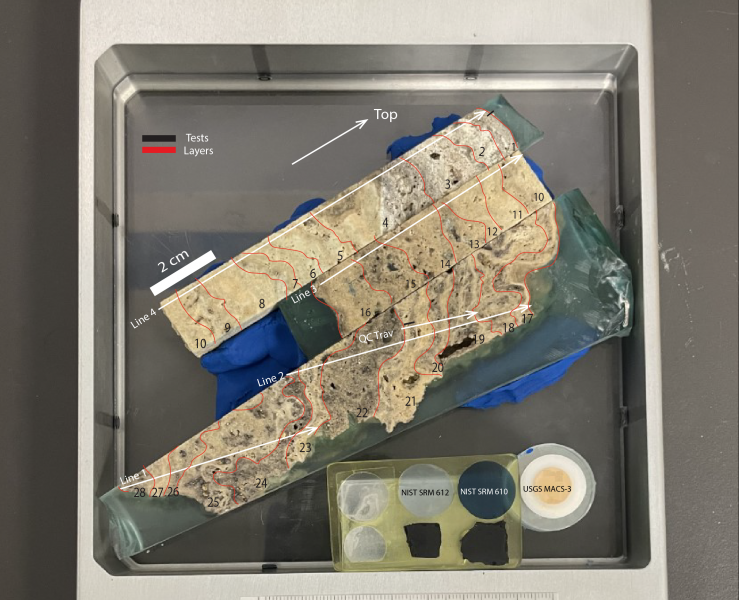
Figure 1: Image of laser ablation cell. The 28 layers of the travertine can be seen, along with the line scans ablated by the laser
Optimization of Parameters
Pre-ablation was tuned and was run prior to the actual ablation of the sample to carve out a pathing for the ablation. The pre-ablation parameters are seen in Table 1. The day after pre-ablation was conducted, the laser was tuned on NIST-612
| Laser Energy (%) | 75 |
| Fluence Variation (J/cm2) | 2.8 |
| Rep rate (Hz) | 10 |
| Spot size (µm) | 125 |
| Scan rate (µm/s) | 100 |
| He (mL/min) | 850 |
| 141Pr (ppm) | 37.2 |
| 141Pr (cps) | 67868 |
| 141Pr (% RSD) | 2.53 |
| 141Pr (ppm/cps) | 2121 |
| 248/232 | 0.39 |
| 238/232 | 105.89 |
Table 1: Pre-ablation parameters
The day after pre-ablation was conducted, the laser was tuned on NIST-612, and the final plasma conditions were tuned (see Table 2 for plasma conditions). The tune was conducted with a 75 µm spot at 5 µm/sec at 75% laser power (approx 3.5 J/cm2) and with a rep rate of 10 Hz. This resulted in 141Pr with 67868 cps with an RSD of 2.53% which shows that the tuning settings return results higher than background levels.
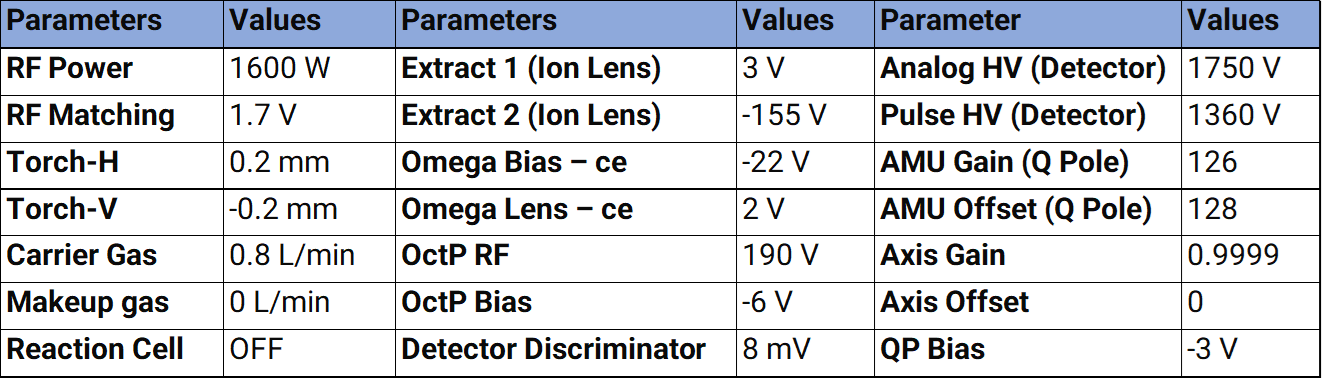
Table 2: Final plasma conditions based on tuning
Tests on Unknowns
After tuning, tests on unknowns were conducted to see if they showed counts, and laser power was adjusted from 75% to 55%. After the initial method was developed, parameters seen in Table 3, a test on the epoxy was conducted to see if it could be identified and taken out during data analysis. However, there was no obvious difference between the geochemistry of the epoxy compared to that of the travertine, besides a decrease in Calcium. Though, this makes it difficult to know when the laser runs over a pore if it is epoxy filled or not, and does not allow for the epoxy to be entirely removed so that the results are only indicative of the travertine.
| Laser Energy (%) | 55 |
| Fluence Variation (J/cm2) | 3.54 |
| Rep rate (Hz) | 10 |
| Spot size (µm) | 100 |
| Scan rate (µm/s) | 50 |
| He (mL/min) | 800 |
| Ar (mL/min) | 400 |
| Sampling Depth (mm) | 6.5 |
| Gas Blank (s) | 20 |
Table 3: Optimized Parameters
Methods
A total of 5 line scans were conducted across different lengths of the entire travertine to account for all 28 layers present and to create some overlap to see the variability in geochemistry in the same layer or layers. In order to keep the laser in focus during the line scans conducted a spot scan was initially laid out then a line scan on top of it to allow the line scan to place multiple focusing points, so that the laser could stay in focus over a highly porous sample, and the variable sample surface.
Data Processing and Quality
All LA-ICP-MS scan data and time logs were brought into the software Iolite for data processing. From there, baselines were identified, and 2 seconds were trimmed from both ends to account for the movement of the laser. autofits were taken of the various standards and baselines, and outputted into a CSV. Seen below are the statistics on the NIST 612 glass standard, MACS-3, used as the primary calibration standard is not well characterized for Al27, Si29, Cl35, Cr53, Ni60, and Pb208 in glass. Fe57 likely had interferences of ArO17 present in the matrix.
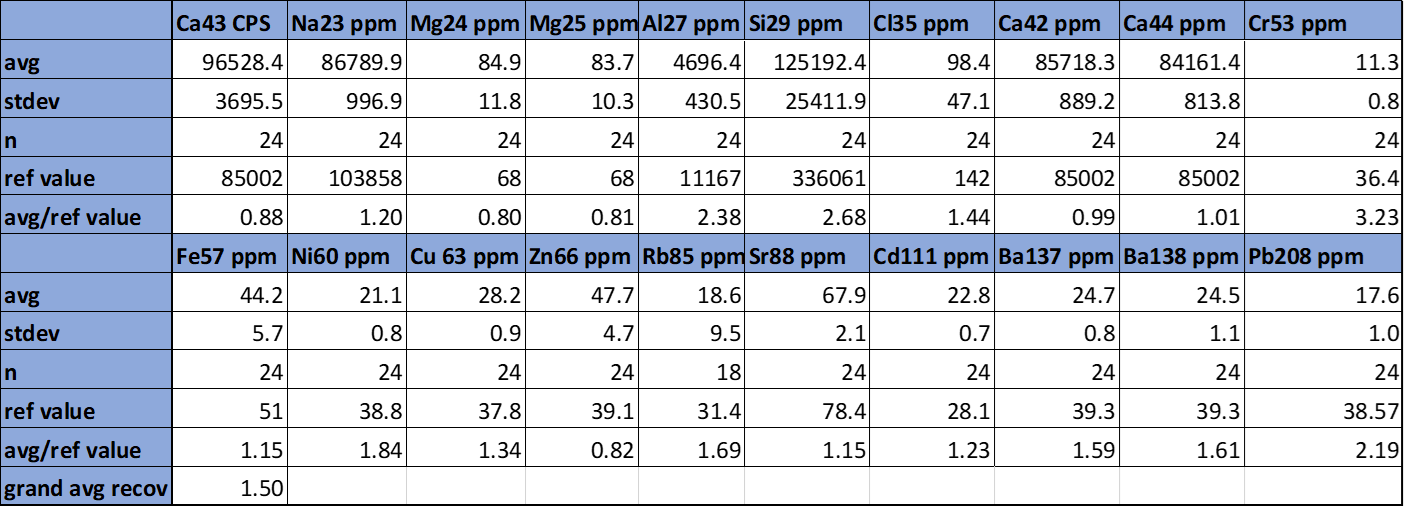
Table 4: NIST 612 standard statistics based on MACS-3 calibration