Methods
Sample Preparation
The core was collected on October 22nd, 2021, and was stored in a clean environment in preparation for cutting and grinding. The core was examined under a microscope to identify growth rings and split into increments. 5-year increments were chosen to allow enough mass of material to be prepared for analysis in each sample, and to allow for a reasonable sample set to cover a large period of time. The tree core was carefully split into segments of 5 rings to reflect 5 years with a sterilized blade, and split lengthways, to provide two identical segments for analysis by each method.
For solution mode analysis, the samples were ground up using a clean mortar and pestle into a fine powder, ready for digestion and dissolution. For dissolution, we followed the method of Rich et al. (2012), which involved a two-step process. First, we heated samples at 90°C for 12 hours with trace metal grade hydrogen peroxide and 14M nitric acid, then evaporated to dryness. Next, we heated samples at 110°C for 24 hours with 12M hydrochloric acid and 14M nitric acid. At this stage, we observed the success of dissolution, and decided to dry the samples down and repeat the process. After two rounds of dissolution, the samples were full dissolved. They were taken up in 1mL of nitric acid to dissolve the content ready for dilution for solution mode analysis.
Material from the pelleted standards purchased from MyStandards were also digested using the same method to analyze through solution mode. The Beech Wood proved difficult to digest, and was centrifuged to aid with the dissolution process. Additionally, a method blank was produced to quantify any impurities in the reagents used. Overall, the dissolution process took around 2 weeks and exposed the samples to possible contamination. Movement between containers may also have affected the total sample analyzed. One benefit pertaining to Laser Ablation analysis is the lack of sample preparation, meaning there is less treatment and possible contamination of the samples.
Solution Mode
Analytes
Solution mode was run before laser ablation in order to understand some of the concentrations of elements we may expect to see in the laser ablation results. Figure 1 below shows the analytes chosen and the respective mode(s) used. Elements were chosen based on their likelihood to appear in tree cores, their existence in the Beech Wood and Valerian Root samples. A wider range of analytes was chosen than proposed after we considered the ability of ICP-MS to measure a large AMU mass range in a short period of time.
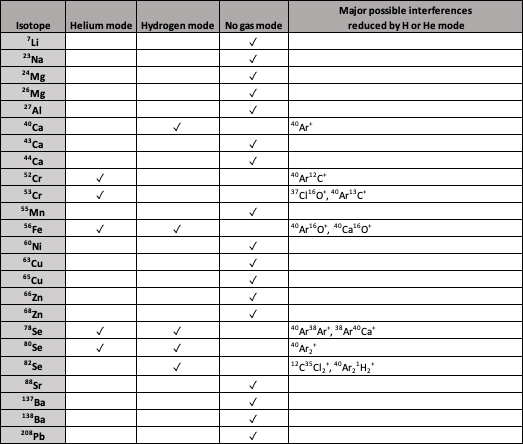
When interferences were likely to form, analytes were run on either He or H mode, as shown above. Isotopes were chosen based on the ability to reduce these interferences and on their relative abundances, to ensure that there would be enough of the isotope to analyze using ICP-MS, i.e. that concentration levels would be above detection limits.
Analysis Order
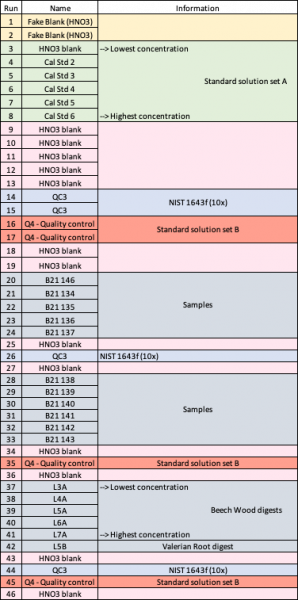
The order of analysis involved running samples in lowest to highest concentration where possible, for example the calibration standard samples (Cal Std above). HNO3 blanks were run predominantly at the beginning of sampling and periodically throughout the sampling runs to flush the system and observe any drift. NIST 1643f and a quality control (Q4) were also run periodically to calculate recoveries for known values. Finally, a set of Beech Wood and Valerian Root digests were run to observe any differences between their content and their certified elemental concentrations.
Dilutions
All samples, calibration standards, and the quality control were diluted before analysis. This was done to ensure that total dissolved solids (TDS) were below the limit of 20,000 ppm. Semi-quant analysis of a dummy sample allowed us to investigate the concentrations observed for a sample diluted to 352x and to decide on suitable dilution factors for our samples. The diluted dummy sample produced a highest concentrations of 2000ppb for sulfur, 1700 ppb for potassium, and 1000 ppb for calcium, which after accounting for dilution factors estimated total concentrations between 45 and 376 ppm. We hypothetically tested dilution factors to examine what concentrations would be appropriate for our unknowns. This depended on the initial sample masses. More information from our semi-quant analysis is detailed in the supplemental data. Dilution factors for the calibration standards were chosen based on the semi-quant analysis; concentrations obtained were chosen as the intermediate values for the calibration curve.
| Sample | Total Dilution Factor |
|---|---|
| Method Blank | 9.38 |
| Unknown tree samples | 320.59-20,634.34 |
| Beech Wood digests | 914.06-2,109,497.48 |
| Valerian Root digest | 19,610.18 |
ICP-MS Parameters
The following table shows the parameters that were used for tuning that were also used for the analysis of unknowns:
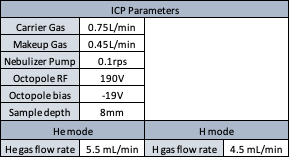
Integration times: 0.9s/Internal standard elements, 0.3s/analytes of interest
Laser Ablation
Sample Mounting
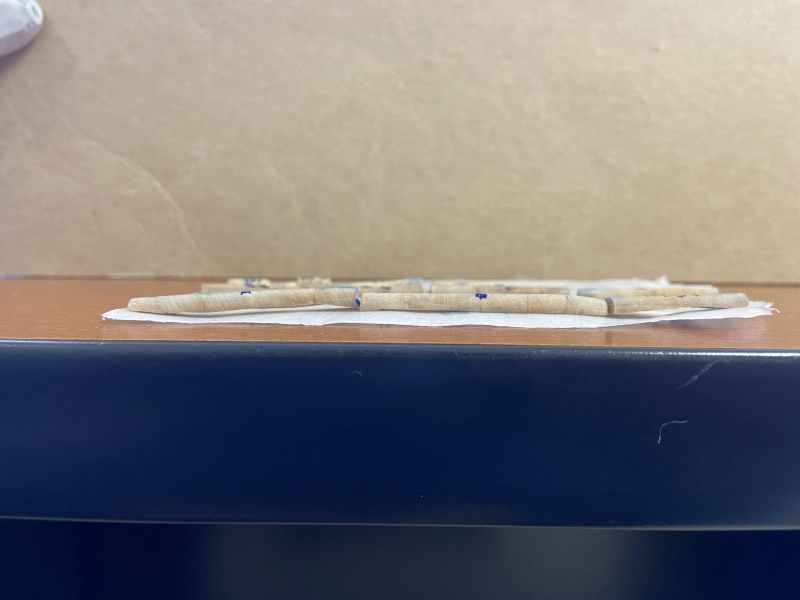
Sample mounting was done by impressing the tree core halves into molding clay to attempt to level out the samples into the same plane. This was a major concern for these samples, given the somewhat un-uniform nature of the sample surfaces, which can be seen in the figures below. The clay was placed onto a glass plate, which was then placed into the laser ablation cell where the NIST 612 glass standard (external) and the Valerian Root standard and the Beech Wood standards were located.
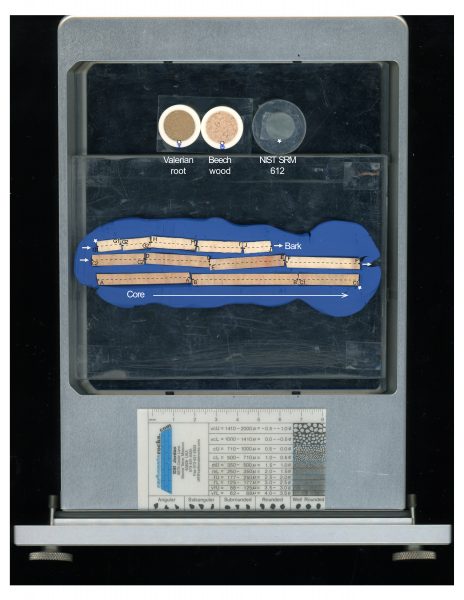
Figure 1: The laser cell used in this experiment
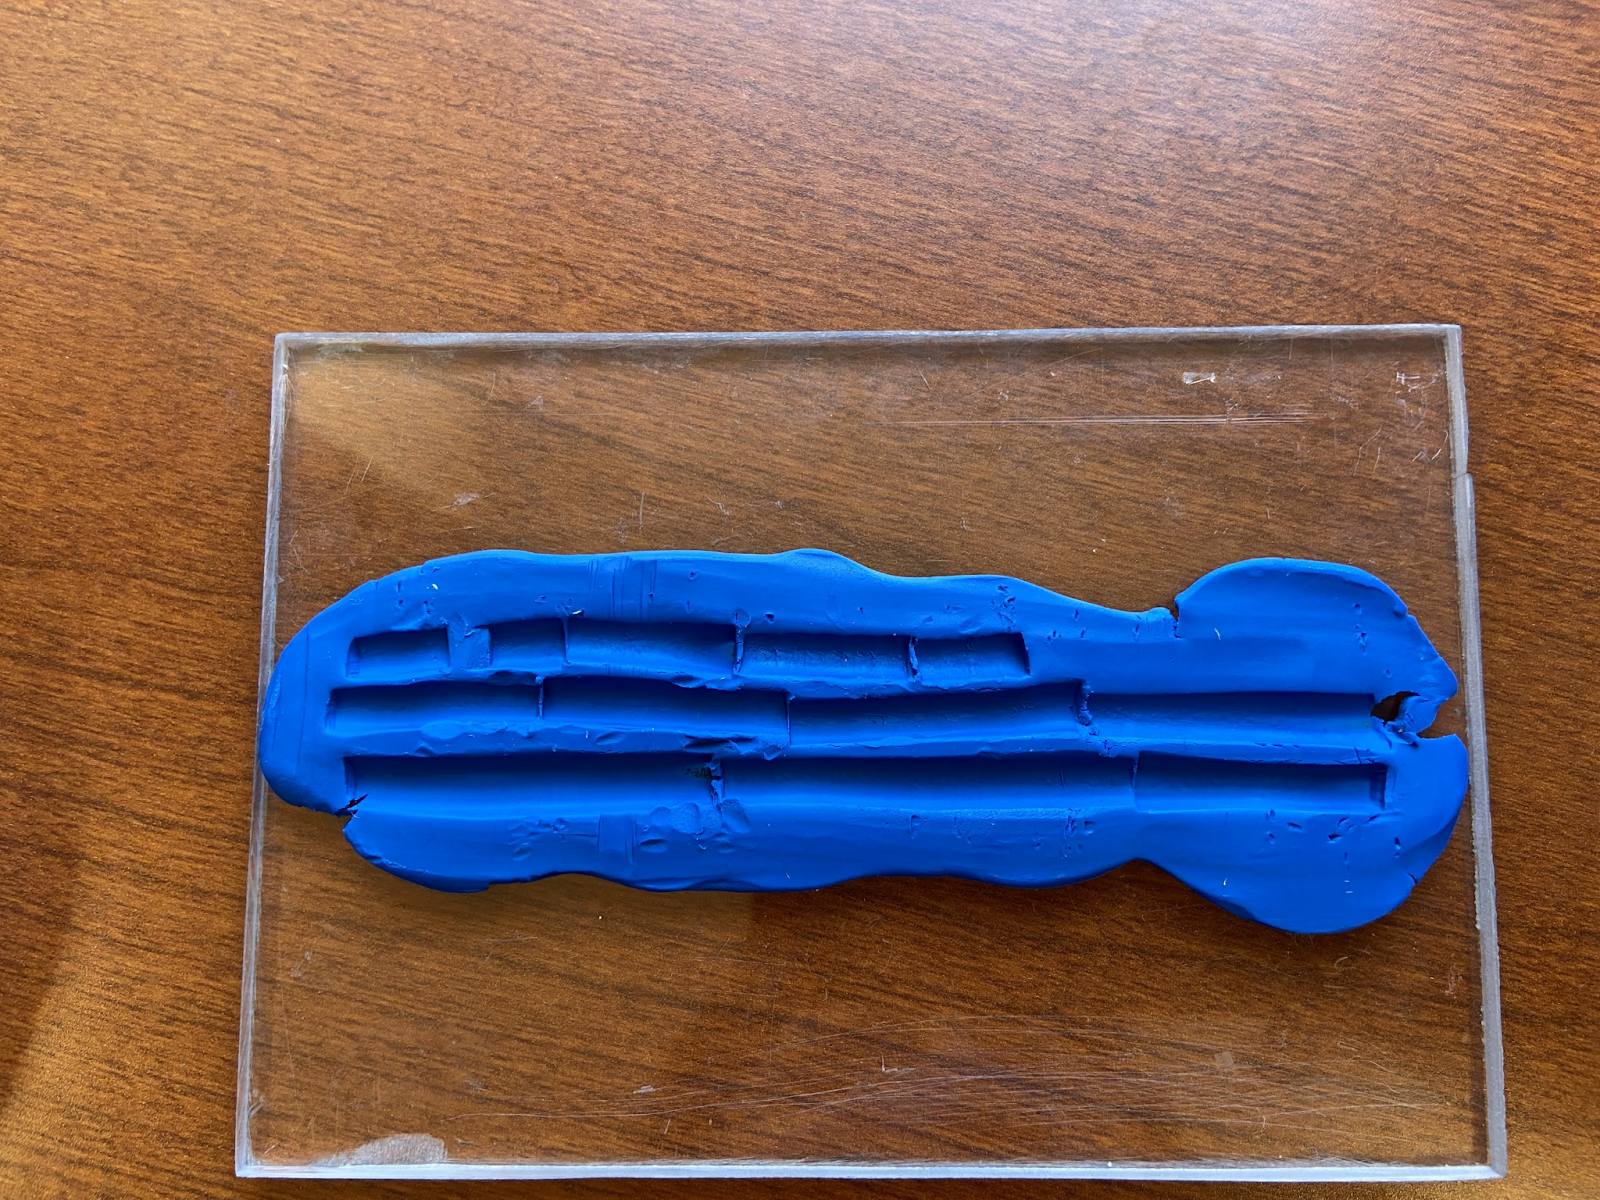
Figure 2: Clay mold used for mounting samples with samples removed
Standards and Analyte Selection
The Beech Wood and the Valerian Root standards were sourced from the company MyStandards. The standards were chosen based on their concentrations of the analytes of interest to our study and the similar concentrations found in previously published tree core analyses in the literature. 13C was used as the internal standard. The carbon content in the unknown samples was estimated using information from Parresol et al (2002) and information from the Arbor Day Foundation (2021). This was done through estimates of bald cypress tree size and density, as given in the aforementioned articles.
The isotopes chosen for analysis by laser ablation differ slightly due to certain interferences no longer able to be removed by gas modes in the collision-reaction cell. Although due to ease of analyzing, multiple isotopes of some analytes were chosen. The elements were picked due to previous literature indications that they may be evidence of anthropogenic influences.
| Analyte | Possible Interferences of Concern/Reason for selection |
| 7Li | None |
| 23Na | 44Ca2+ (due to high calcium concentrations) |
| 25Mg | 12C2H, 12C13C |
| 26Mg | 12C2H2, 13C2, |
| 27Al | 12C15N, 13C14N, 13C2H, 12C13CH2 |
| 44Ca | 12C16O2, 12C14N18O, 13C14N17O, 12C15N17O, 13C15N16O |
| 53Cr | 40Ar12CH, 36Ar17O, 38Ar15N, 38Ar14NH,36Ar16OH, 40Ar16OH, 40Ar13C (Avoids 40Ar12C overlap on 52Cr) |
| 55Mn | 40Ar14NH, 38Ar17O, 38Ar16OH, 36Ar18OH, 40Ar15N |
| 57Fe | 40Ar16OH, 40Ar17O, 38Ar18OH, 40Ca16OH(Avoids 40Ar16O overlap on 56Fe) |
| 60Ni | 36Ar24Mg, 44Ca16O, 43Ca16OH, 42Ca18O, 43Ca17O, 44Ca16O, 42Ca17OH, 42Ca18O, 43Ca17O(Avoids 40Ar18O interference on 58Ni) |
| 63Cu | 40Ar23Na, 36Ar12C14NH, 38Ar25Mg |
| 68Zn | 40Ar14N2, 40Ar12C16O, 40Ar13C14NH, 40Ar12C15NH, 38Ar15N2, 38Ar12C18O, 38Ar13C17O, 36Ar14N18O, 36Ar15N17O, 38Ar14N16O (Hard to avoid Argon interferences) |
| 82Se | 40Ar2H2, 40Ar42Ca, 38Ar44Ca, 36Ar46Ca, 12C35Cl2(Avoids 40Ar2 interference on 80Se) |
| 88Sr | 40Ar48Ca |
| 137Ba | None |
| 138Ba | None |
| 208Pb | None |
Data was collected for the above analytes by the ICP-MS on the 5 year segments of the split wood core. The laser paths were made in the software by connecting the midpoints of each segment with a dotted line of points with spacing every 10 μm. This dotted line was connected by solid lines of points for each segment. To ensure proper focusing for each sample, and given the variation in height over the sample and between samples, focusing was done for each point on the lines for the sample, immediately before each analysis by the laser to account for any shifts in samples. Proper focusing was possible for most of the sections except for sample G1, where due to irregularities in the surface of the sample, the sample was too close to the camera to be focused on correctly.
Pre-ablation
The samples and standards we pre-ablated to provide a smooth, fresh surface and to test the energy of the laser. Initially, we tested laser energy of 30%, 40%, 50%, and 60% across a sample area of sample to investigate the success of ablation. Upon inspection, we decided that 40% laser energy produced a visible ablation path at the lowest energy output. Therefore, we continued to ablate along the mapped traverses to prepare for analysis.
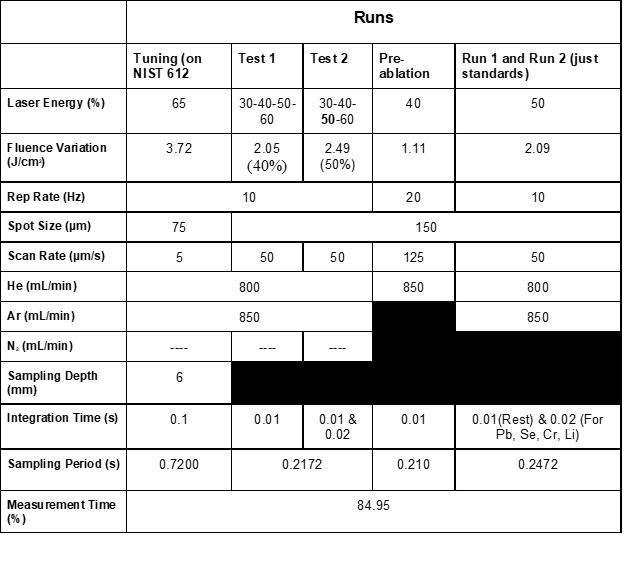
A summary of each of the laser runs and their parameters can be found in the table below
Final Plasma Conditions (based on tuning):
| Parameters | Values | Parameters | Values | Parameter | Values |
| RF Power | 1600 W | Extract 1 (Ion Lens) | 3 V | Analog HV (Detector) | 1750 V |
| RF Matching | 1.7 V | Extract 2 (Ion Lens) | -120 V | Pulse HV (Detector) | 1750 V |
| Torch-H | 0.2 mm | Omega Bias – ce | -20 V | AMU Gain (Q Pole) | 126 |
| Torch-V | -0.2 mm | Omega Lens – ce | -30 V | AMU Offset (Q Pole) | 130 |
| Carrier Gas | 0.86 L/min | OctP RF | 190 V | Axis Gain | 1.0001 |
| Makeup gas | 0 L/min | OctP Bias | -9 V | Axis Offset | -0.03 |
| Reaction Cell | OFF | Detector Discriminator | 8 mV | QP Bias | -6 V |
Through sample tuning on the NIST612 external standard glass, we found that the counts of Cs-141 were 42,226 for 37.2 ppm with an RSD% of 3.80, indicating around 1135 counts/ppm, which shows that the settings used in tuning will return results which are above the background counts. The trial tests were used to determine an appropriate energy level for the laser and an integration time for the detector. From Test 1, it was determined that 0.01 seconds didn’t return as smooth of a signal for 4 (Pb, Se, Cr, Li) of the analytes so Test 2 was run while doubling the integration time to 0.02 seconds for those analytes, as seen in the table. The test runs also determined that a laser energy of 50% or ~2.09 J/cm2 was the best to use for analysis. It is important to note however that the energy of the laser fell gradually over time to approximately 1.99 J/cm2 during the analysis, although the effects of this on the data returned are currently unclear at the time of writing.
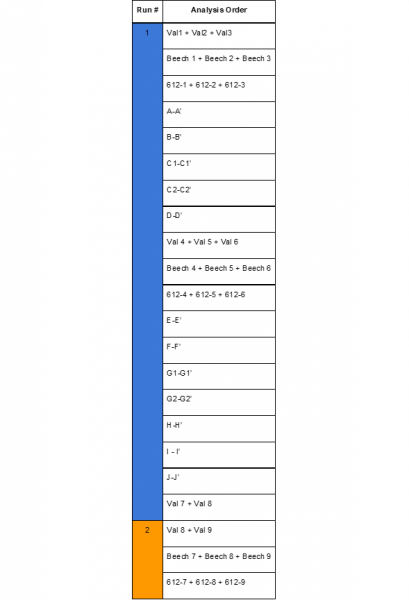
As noted in the table the final analysis was split into two runs due to the maximum time being reached in the data recording software. This was largely due to the amount of time required to ablate each relatively long sample and the time required to travel to each standard, during the analysis. Run 2 continued where the analysis was stopped, only having to analyze the beech wood and valerian root standards one last time. In Run 1, each sample was analyzed by line scan in order of decreasing age (core) towards the younger sections (bark). Measurements of the standards were performed in three parallel line scans, occurring during the analysis . Even with running in parallel, each of the carbon based standards showed slightly varied signals on each scan line, likely due to their coarse nature. On visual inspection, it was evident that the Beech Wood standard was more coarse than the Valerian Root standard, with visible elongated fibers of wood visible with the laser camera and in the desktop scan done of the laser ablation cell.
The analysis order can be seen in the table below: