Discussion of results
Solution Mode
Data Reduction
Data collected by the ICP-MS was reduced by interpreting the signals of calibration curves and recoveries of the quality controls used.
For each analyte and mode, we calculated the following:
- The regression of the calibration curve data
- Average signals of a blank and therefore the limits of detection (as seen in Figure 1)
- Recoveries of standards and average %QRSD of unknowns
- Unknown measurements below limit of detection and above highest calibration standard concentration
- Actual concentrations in ppm
From this data, we could assess which analyte modes and isotopes had the least spread of data and data within reasonable detection limits. From this information, we could reduce the data to a final set of reported isotopes and their respective concentrations. Full results can be seen in the supplementary data.
Figure 1 shows the limits of detection for our blank runs, which indicate very low concentrations in the 0.002-3 ppb range. These signals show that the background signals were low and likely would not affect the analysis of our samples.

From the results obtained through solution mode analysis, we can compare the content of the Beech Wood and Valerian Root standard digests to the certified values given by MyStandards.
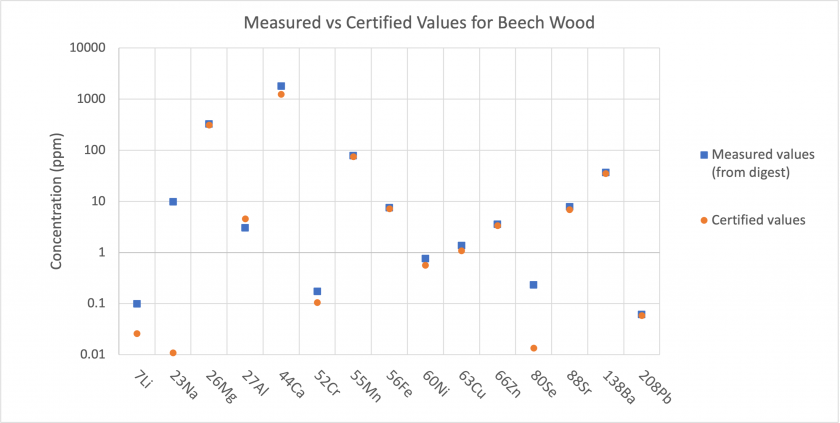
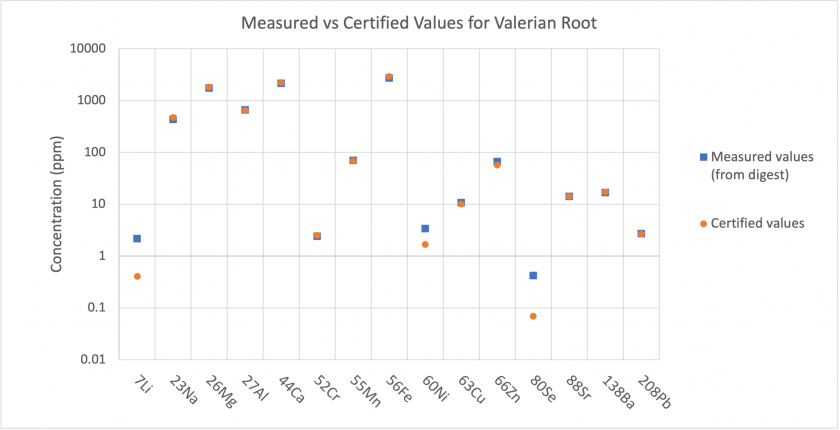
The results show that for most analytes, the concentrations present in the digests match well with the certified values. For Beech Wood, the measured concentrations were much higher for Li, Na, and Se (Figure 2). For Valerian Root, the measured concentrations were much higher for Li, Ni, and Se (Figure 3). This indicates that the standards may have had more of these elements than the certified values, or, that there was some instrumental error producing these elevated concentrations. Analysis of the method blank and nitric blank does not indicate an input of these elements to analyzed samples through the digestion procedure.
For the following graphs, the results for the sample representing the years 2002-2006 have been omitted. This is because the results showed significant outlier results. We suspect that there was an issue weighing the extremely small sample mass, which was much smaller than the other samples. This would have resulted in an incorrect calculated dilution factor and raised concentrations, as seen in the results. When analyzing our data, we found that for some elements, such as Li and Se, concentrations fell below zero, and so we used the limits of detection for the respective analytes to estimate the maximum concentrations that we may have seen in the analysis.
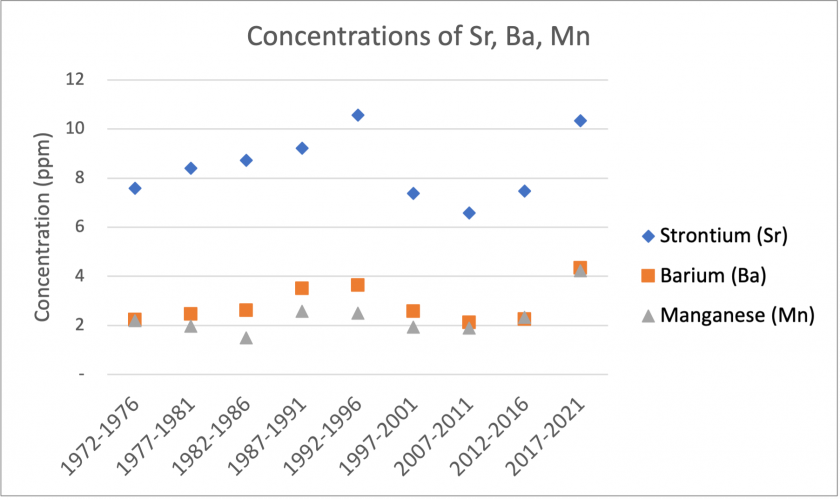
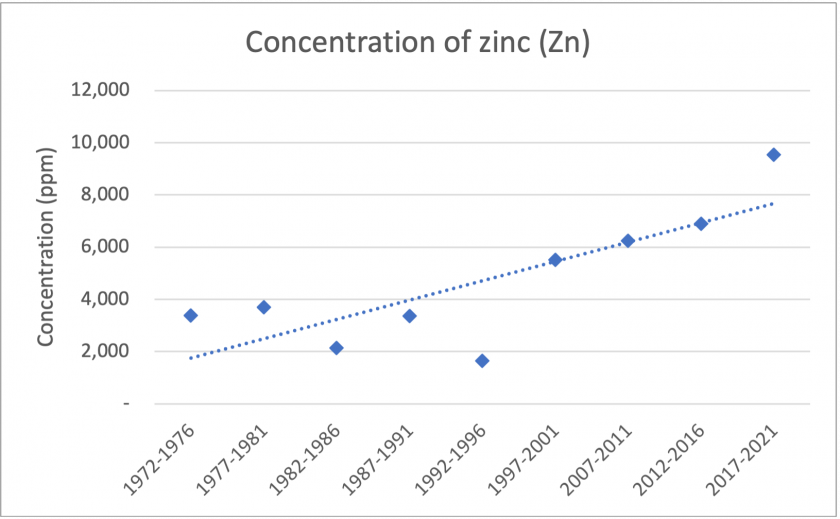
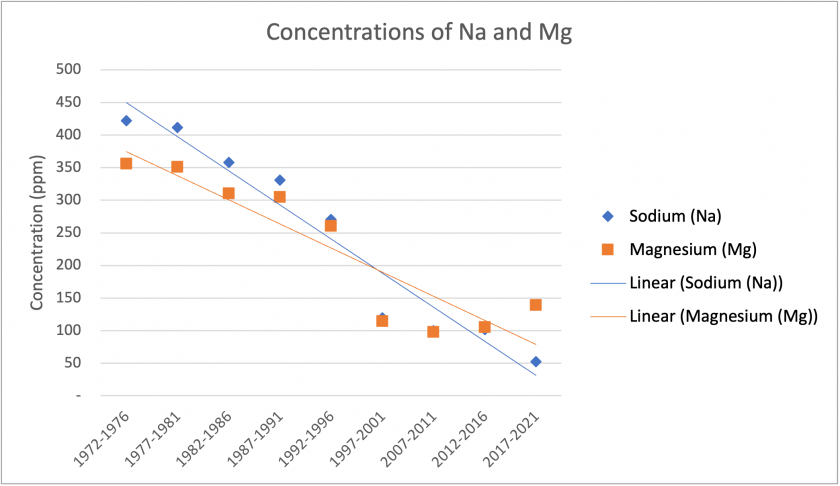
The figures above show significant trends found in our reduced data. Figure 4 shows that over the time period, Sr, Ba, and Mn show similar patterns in concentrations. Although there are no major trends over time, they show similar spikes in the period 1992-1996. Additionally, Ba and Mn show very similar concentrations. Figure 5 shows a general trend of increasing Zn concentrations over the total time period. Figure 6 shows similar trends between Na and Mg. Overall, there are sharp decreases in concentrations over the total time period. Specifically, there is a significant drop between the 1992-1996 and 1997-2001 period. If examining another tree core, it may be worth exploring this time period in finer detail.

Figure 7 above shows the results of analysis of the method blank in ppb. The levels were significantly lower than the analysis of our samples and standards, and therefore did not contribute greatly to our results.
Laser Ablation
Data analysis/reduction was performed with Iolite software (Paton et. al 2011). Data was analyzed 4 ways with both the Beech Wood and Valerian Root as standards, as well as using both the standard values given by MyStandards and the concentrations found from the prior completed solution mode analysis of powdered versions of the same standards. Both the statistics for each section and the time series results for each section were collected for each of the 4 analysis methods.
Reduction in Iolite proceeded well for all methods, although in a few cases the spline was not entirely able to account for all the spikes seen in the sample, which we likely attribute to the non-homogeneity of the samples. It is important to note however that the homogeneity/compactness of the unknown core sections samples was much greater than the carbon based standards which were analyzed.
Based on the calculated recoveries and the average signals for each analyte using each of the standards as the calibration standard for analysis, the MyStandards based Beech Wood standard data fared the best, with good (≈1) average recoveries with low standard deviations and data above the calculated limit of detection for most of the analytes of interest (Longerich et al 1996).
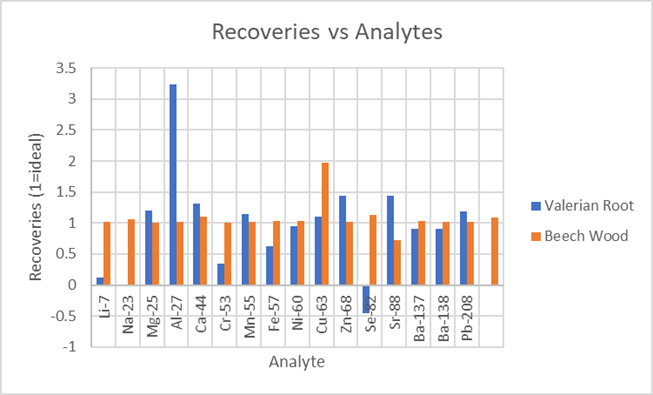
Figure 8: Average Recoveries for each analyte using web provided values for the standards and Beech Wood being used as the calibration standard
As the graphic shows the recoveries for the Beech Wood samples are close to one for the most part excluding Sr and Cu which show the largest variation. However, the same cannot be said for the analyzed valerian root samples which vary quite significantly when compared to the certified values. When the standard order is reversed however the Valerian Root recoveries are now much closer to one, with the beech wood standard having varied recoveries. We attribute this discrepancy to be likely resulting from the two standards have orders of magnitude difference in concentrations for some of the analytes and as previously mentioned the level of homogeneity in the samples is also quite different, with the valerian root standard have a much finer grain to it.
The core sections described below can be correlated to the same year sections as used in solution mode, as described in Table 1.
| Core Section | Time Period |
| A-A’ | 1972-76 |
| B-B’ | 1977-81 |
| C1-C1′ & C2-C2′ | 1982-86 |
| D-D’ | 1987-91 |
| E-E’ | 1992-96 |
| F-F’ | 1997-2001 |
| G1-G1′ & G2-G2′ | 2006-02 |
| H-H’ | 2007-11 |
| I-I’ | 2012-16 |
| J-J’ | 2017-21 |
Based on the “web” derived Beech Wood standard the average concentrations (ppm) for each analyte of interest and the ±Standard error (SE) for each core section or time segment can be seen in the plots below, in which the analytes are arranged by approximate concentration ranges.
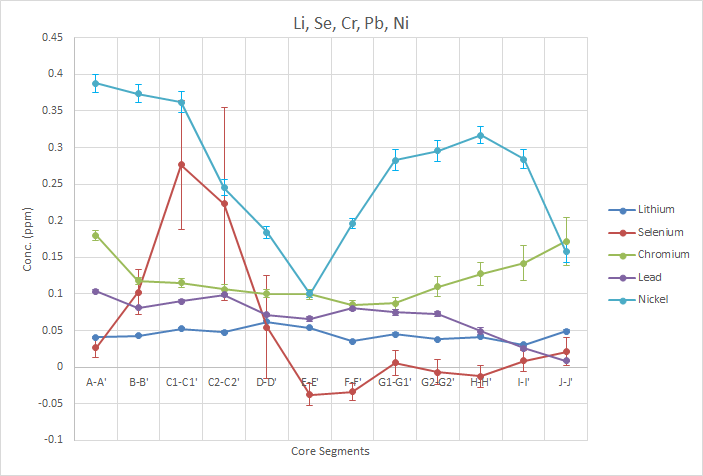
In the figure above, it is hard to draw a conclusive trend from the analytes presented, especially considering the standard error on some of the measurements . The data for Se shows quite a wide variety of values, including negative, which is possible given the large standard errors (SE) relative to the values themselves. It is very likely that none of the samples contained any significant amounts of Se. Although very small in concentration, the trend seen in Pb follows the decreasing lead hypothesis that we proposed before beginning the study. This would fit the idea that the majority of lead originating in the tree is sourced from lead contamination in the environment and got into the tree through either the air or water uptake. However, the actual concentration change seen in this trend, is very small and could be an artifact of sightly differing properties of the wood sample. For the other analytes it is much harder to draw any significant trends. Li shows a large dip occurring in core E-E’ (1992-1996), which could be related to a certain water related episode in Waller Creeks past history or some other event.
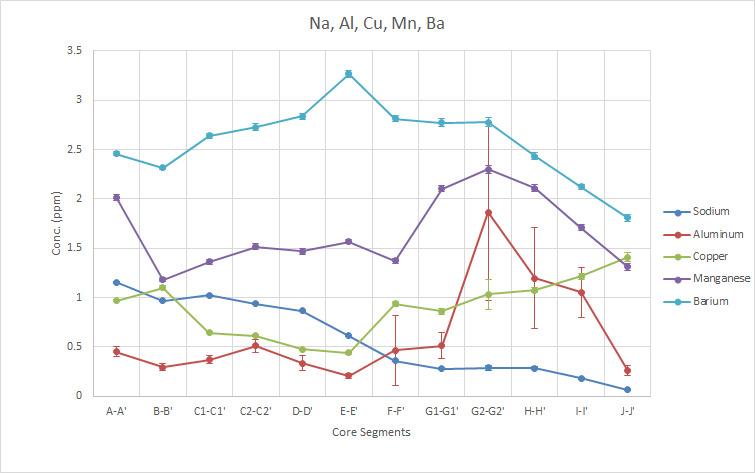
As above with Se, the trend for aluminum is questionable due to the large standard errors present on the higher values shown. However, there is likely some Al present given that its concentrations are higher than that of Se, especially at the peak. the Na shows a general decreasing trend over time while Ba peaks in the E-E’ segment, representing 1992-96 segment. The decrease in Na could be correlated with decreasing water salinity or level. Mn shows a peak in core G2-G2′ corresponding to half of the 2002-06 sample.
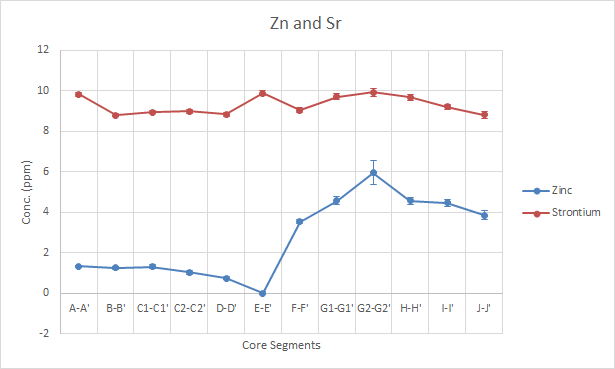
The data for Sr shows a neutral profile over the time period. Zn shows a flat, but decreasing profile at the start, but has a value below the the limit of detection (LOD) for E-E’ (1992-1996) and then increases to a peak in G2-G2′ (2002-2006).
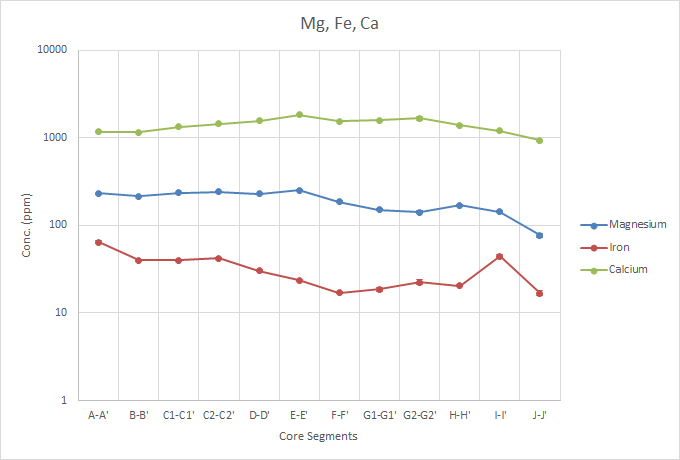
The concentration profiles of Mg, Fe, an Calcium are relatively flat, with little variation over the period. This could be due to the analytes not being taken up through the water or air in the same ways at other analytes may.
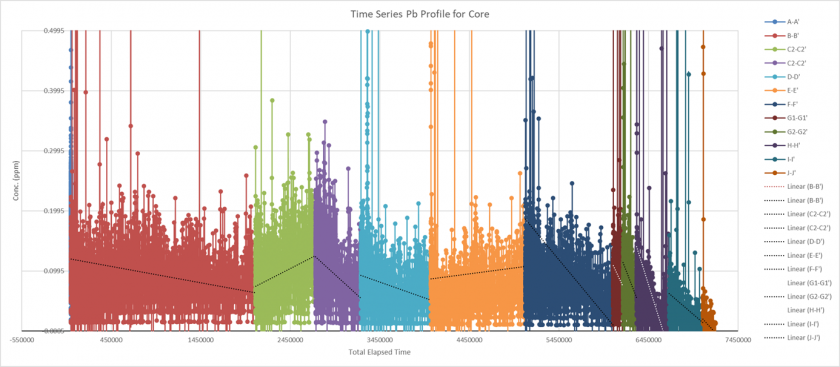
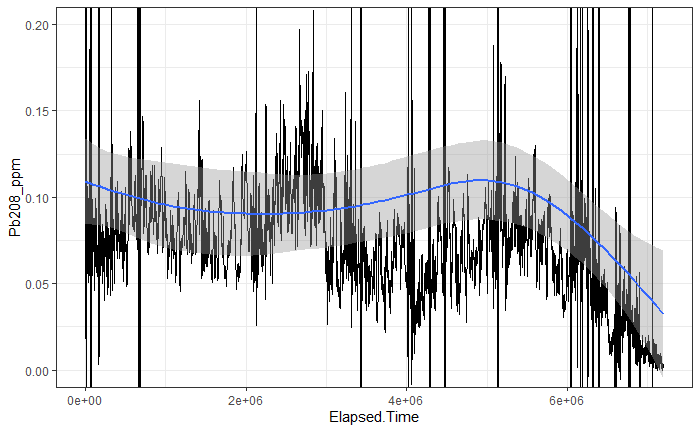
Figure 13 shows an example of the time series data that was also extracted from the Iolite software. Also below that is the same plot, but with a Savizky-Golay filter applied to the data to improve noise, along with a smooth fitting line. The code, and parameters used to create the figure can found in the supplemental data section. For the sake of the objectives of this study, only the data for lead (Pb) will be shown/discussed due to most of the data once plotted not contributing significant results. As can be seen the data shows some trends in each of the regions, but the given trend lines don’t totally match up between each section. This issue could be due to the cores not being aligned in the correct direction (this was hard to determine looking at the samples) or that some other issues were affecting the measurements. This is also likely given the fact that the core was not measured in complete lines, with breaks occurring in between the sections. If future studies wanted to get a more complete record of values, trying to keep as much of the complete length of the core together as possible would be desirable, within the limits of the laser ablation cell. If some of the outliers are taken out of the data set, however there is an observable decrease in the concentration of lead overtime and within each sample, which could be explained by the removal of lead from gasoline, and therefore the environment in the 1970s.
Comparing Solution Mode and Laser Ablation
By examining the results collected by both laser ablation and solution mode, we can assess how different analytes were measured in different modes. Again, values for 2002-2006 were omitted due to large outliers in the data.
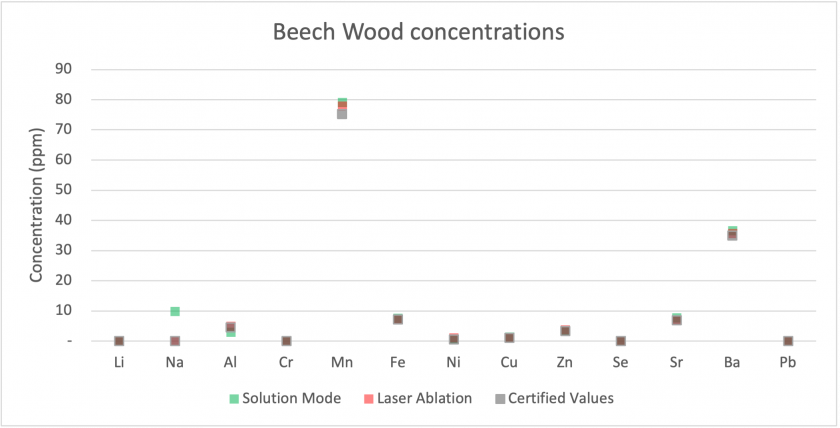
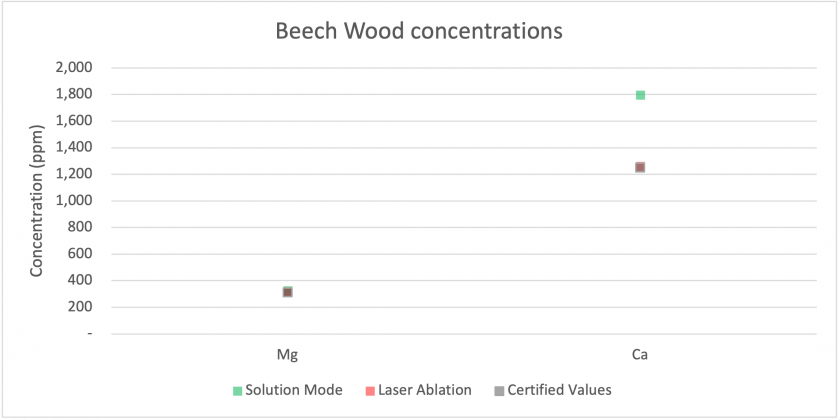
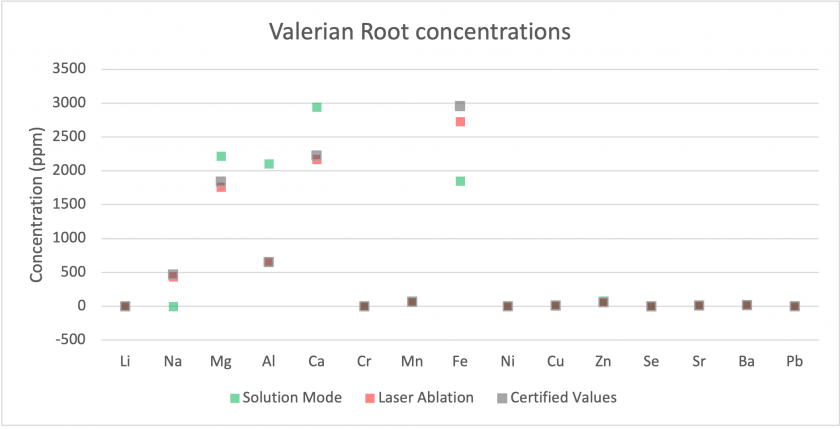
Firstly, we can examine how each mode compared to the certified concentrations for our Beech Wood and Valerian Root standards. Figures 14 and 15 show that for most analytes, the results collected by both modes matched well with the certified values. The largest discrepancies were for sodium and calcium, with much higher values being measured for solution mode than for laser ablation or the certified values. Figure 16 shows results for Valerian Root, whose results did not match as well. Most low concentration analytes matched well, but for higher concentration analytes, such as aluminum, magnesium, and calcium, the values measured for solution mode were higher. For iron and sodium, the measured values are lower for solution mode. Overall, the Beech Wood certified values are accurate with respect to the measured values. It is worth noting that the solution mode results are from the digested material, which may indicate that the dissolution process did not digest the Valerian Root well.
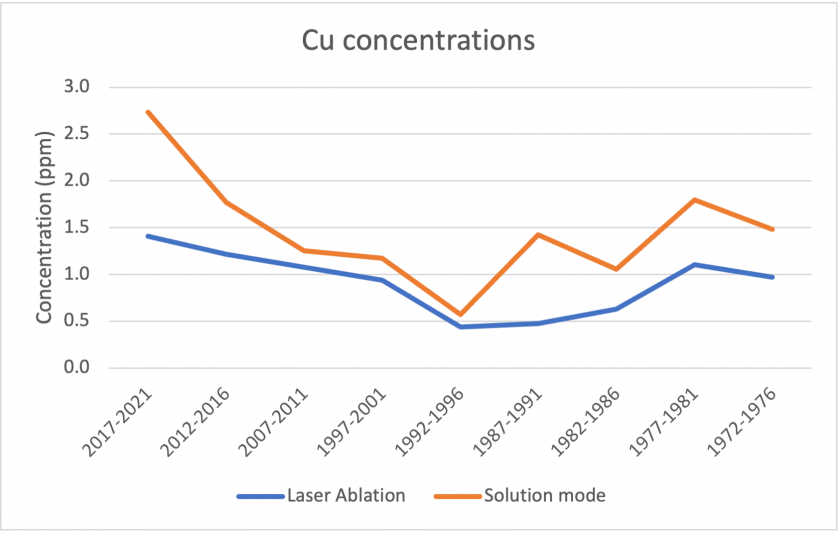
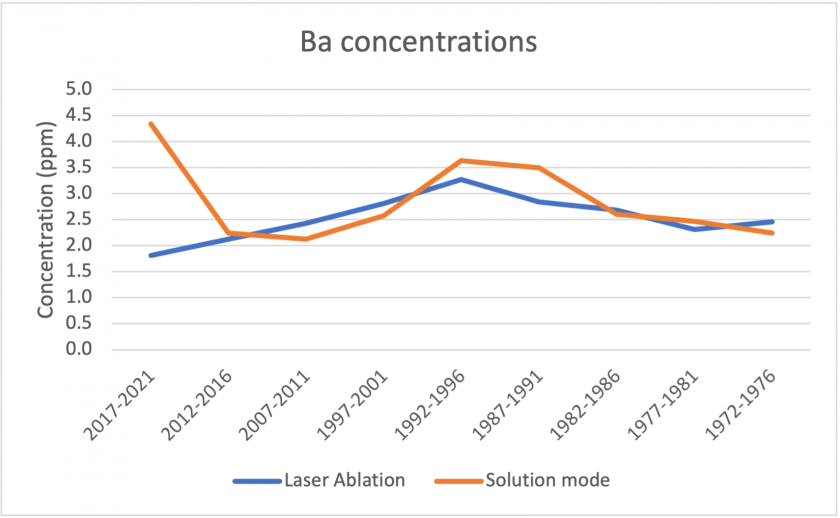
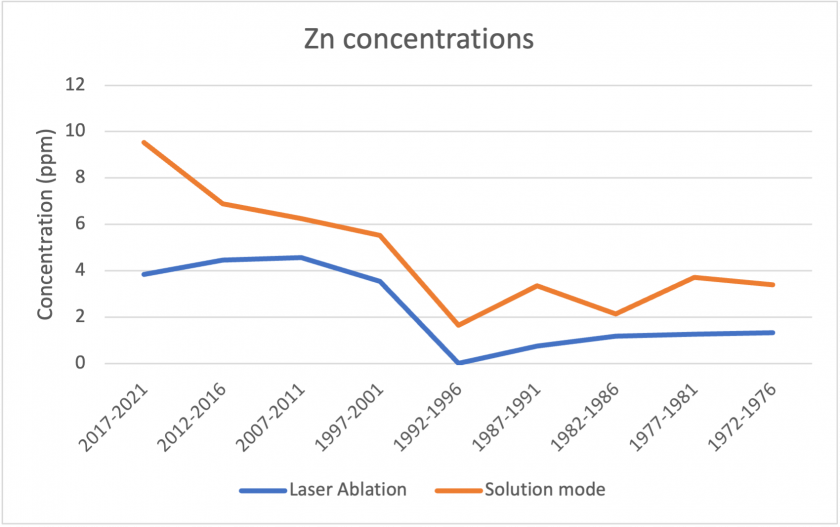
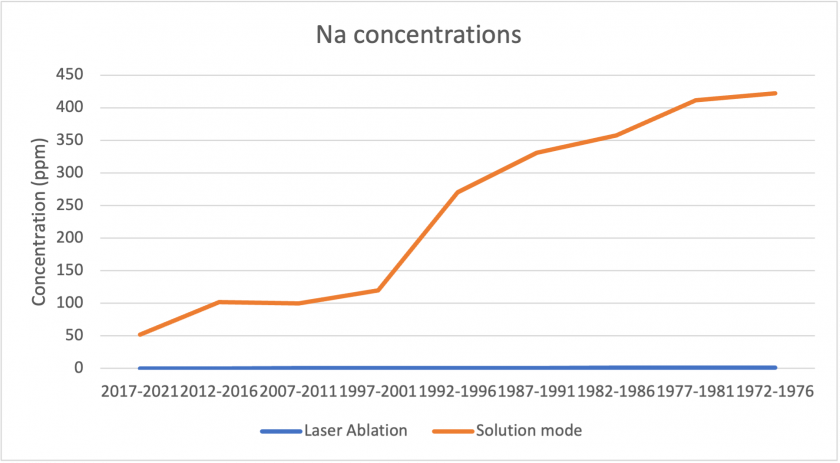
Figures 17, 18, and 19 below show correlations between the results for laser ablation and solution mode concentrations. For copper, barium, and zinc, the data shows a similar pattern over the analyzed time period. In all three cases, solution mode concentrations were slightly higher. It is also interesting to note that in all three cases, the period 2017-2021 showed the largest discrepancies between laser ablation and solution mode data. Figure 20 shows the measurements for sodium between the two modes. The graph represents poor correlation between the two datasets; for laser ablation, concentrations were close to zero, but were much higher for solution mode. It is interesting to note that sodium had poor correlation for the standards too, which may indicate that the analysis does not measure sodium well.
Evaluation of methods and results
Expected vs actual budget
| Analysis mode | Expected # of samples/time | Expected cost ($) | Actual # of samples/time | Actual cost |
|---|---|---|---|---|
| Solution | 12 | 204 | 46 | 782 |
| LA | 4 hrs | 241 | 6 hrs | 438 |
Expected total cost = $445
Actual total cost =$1220
Solution Mode
The most difficult aspect of solution mode was the preparation of samples. The acid digestion method proved time and resource intensive and exposed the samples to air and container contamination. Therefore, if samples were to be run again, we may suggest attempting a new method of digestion, such as ashing or microwave digestion if possible. This illustrates one of the key benefits of laser ablation. Samples do not need to be intensively processed before analysis and are likely to be less contaminated.
Laser Ablation Mode
The main issue with analysis stemmed from the difficulties in mounting the samples in one plane as much as possible. The clay layer employed in this experiment was somewhat successful in keeping all the samples in one plane, but could not resolve some of the more varied sample heights such as with sample G1-G1′, where the G1 side of the sample was too close to the lens to be properly focused on and the general issues with focusing discussed in the LA methods section. To prevent these issues in the future an apparatus which would align the samples in a grove, where a wood plane could be used to cleanly remove a layer of the material and match the sample heights much more closely. This would also improve the issues within each core section related to height and focusing, making for faster set up before analysis can begin.
Evaluating our findings
Overall, we were able to constrain the values for the Beech Wood well for both laser ablation and solution mode. However, the concentrations measured by solution mode for Valerian Root did not match well with certified values, which may indicate that the digestion process did not work well for that material. For solution mode, we saw correlations between data for Ba/Sr/Mn, for Na/Mg and a slight upward trend in Zn traveling into the past. We did not observe any major long term trends in the solution mode data.
For laser ablation, the recoveries were close to one for the Beech Wood, given that it was used as the calibration standard in the best reduction, while returns for the Valerian Root varied anywhere from <0.5 to greater than 3, which is not ideal, but the same held true when the Valerian Root was selected for the calibration standard. We attribute this occurrence to be a result of the higher concentrations for many of the analytes in the Valerian Root sample and the previously mentioned differences in homogeneity and particle size between the two standards. While most of the analytes show hard to explain trends, lead did show a gradual decreasing trend overtime, fitting the trend we predicted based on the gradual phasing out of lead from gasoline. For most of the other analytes, more information such as historical climate data or water quality measurements would be required to make more guided conclusions.
When comparing solution mode and laser ablation, we found the most correlation between the modes for Cu, Ba, and Zn, but otherwise did not find good correlations for other analytes, such as for Na. For most analytes, the modes correlated well for Beech Wood, and worse for Valerian Root, as previously discussed.
Considering the time spent preparing the samples for solution through dissolution, and the potential contamination that could have taken place, laser ablation may prove more achievable for larger sample sets. Additionally, laser ablation analysis of standards, especially of Beech Wood, matched well with the certified values. Our budget showed that we needed to analyze much more material and run the machine for much longer than we had initially anticipated. However, the cost remained much lower for laser ablation than for solution mode.
Overall, our data did not show significant or explainable trends of increasing or decreasing concentrations of particular analytes that may be representative of anthroprogenic input into the natural system. Further analysis and some outside data, would be needed to confirm if any of the changes seen are related to anthroprogenic influences. However, we showed that our laser ablation methodology and analyzing parameters were able to produce concentrations close to certified values for standards. Therefore, these methods may be applied to wider tree core datasets to explore long term trends further. We also showed that although solution mode may be utilized for tree core material, the sample preparation process may be both time-limiting and may open up the material to increased contamination.