Weiming Feng Research (Banner Spelothem Group)
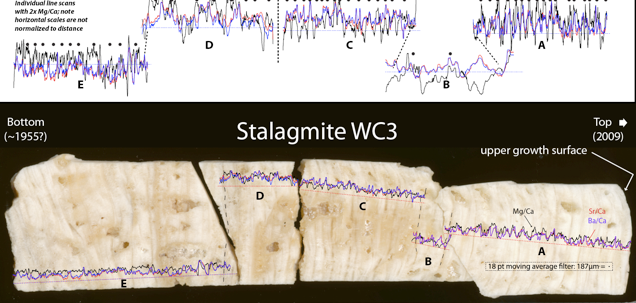
This slabbed stalagmite sample from West Cave (central TX) was analyzed by LA-ICP-MS in five separate scans (E-A). The analytical surface differs slightly among the four sections but all line scans can be reliably correlated between the sections (as shown by the dashed black correlation lines). All line scans were collected using a 50μm spot moving across the sample surface at 20μm/sec, with a total integration time of 0.555 sec for measured analytes (Ca, Mg, Sr, Ba). With these parameters, a single data point represents the integrated signal of a 50μm spot as it moves across 11μm. Intensities were converted to concentrations (ppm) using NIST 612 as an external reference standard and 44Ca as the internal standard assuming pure CaCO3 stoichiometry. The data were filtered using an 18 point moving average filter, corresponding to a horizontal distance of 187µm (or 3-4 unique spot diameters), which substantially reduced high-frequency “noise”. The filter width is shown above by the diameter of the black spot [barely visible within the inset “18 pt moving average filter” . . . text box]. Ratio plots shown above have log scales and relative amplitudes are mutually normalized to emphasize amplitude variations. Sr/Ca and Ba/Ca closely mimic each other. Mg/Ca increases seem to systematically precede mutual increases in Sr/Ca and Ba/Ca. Based on Mg/Ca amplitude variations for this level of filtering, and the assumption that each could represent a seasonal cycle (black dots in upper graphic), it appears that the stalagmite could represent ~55 years of precipitation. This stalagmite was harvested in July of 2009, suggesting that its base dates from ~1954.
© 2025 Jackson School of Geosciences, The University of Texas at Austin

