Results
Our results following the LA-ICP-MS analysis on the K-feldspar megacryst are laid out on this page. The data was gathered from the areas mapped out in the image below.
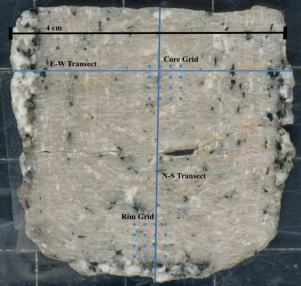
The two transects of the megacryst are shown in the image below, labeled E-W Transect and N-S transect for their orientations relative to the crystal after being mounted to the tray. The two grids of spots are also shown, labeled as Core Grid and Rim Grid. These 4 sections are where we gathered our data from during analysis. Also shown is a scale bar of 4 centimeters to indicate the width of the analyzed region and provide a scale for the image as a whole.
The two transects were analyzed in order to evaluate the distribution of trace and major elements across the core and rim of the megacryst. The concentrations from this were not intended for rigorous quantitative analysis and instead meant to provide concentration numbers for qualitative analysis of distribution. Regardless of this, they are of high enough quality to be considered accurate, as discussed in our methods section. The E-W transect provided data of a full rim-core-rim traversal, while the N-S transect provided data over a longer distance from slightly before the crystal’s core, across the center of the core, and the full distance from the core boundary to the rim.
To discern different mineral phases we included the analyte elements of Mg24, Fe 57, K 39, and Zr 90, though Zr 90 also provides data for our specific analytical hypotheses. This is important because the line scans ablated across numerous inclusions within the larger K-feldspar crystal and without a proxy analyte for these alternate mineral phases incorrect conclusions may be drawn. This is visible in the corresponding analyte graphs shown below which show spikes in our indicator analytes that are reflected in many of the graphs for the other analytes.
East-West Transect
The graphs below are created from the time series data of the E-W transect. They were created using a 7-point moving median as a means of smoothing potential significant outliers:
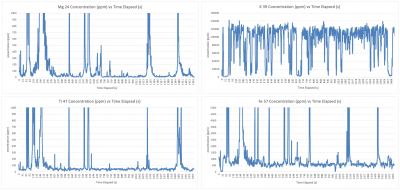
Major Elements
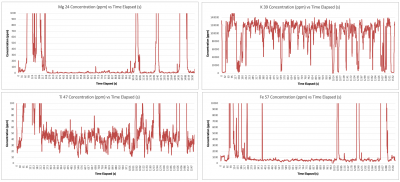 The graphs above show the concentrations of Mg 24, K 39, Ti 47, and Fe 57. The Mg, Ti, and Fe concentrations have multiple large spikes on either side of the graphs that indicate the significant mineral inclusions present near the rim of the crystal. These mineral inclusions are visible in the image showing the path of our transect. The K 39 graph is also helpful in identifying these inclusions as potassium is a major component within K-feldspar. The significant dips in potassium concentration correspond to the spikes in Fe 57 and Mg 24 proving this relationship to alternate mineral phases.
Outside of the large spikes indicating the mineral inclusions the graphs of Mg 24, Fe 57, and Ti 47 don’t show other significant patterns that are important to our research. K 39 remains relatively consistent across the transect. It is important to note that significant decreases in K 39 do not occur closer to the core of the crystal and occur much more frequently toward the rims.
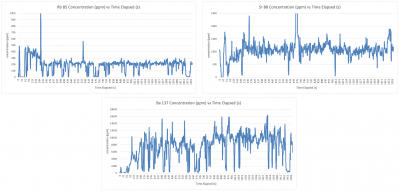
Rb, Sr, and Ba
The concentrations of Rb, Sr, and Ba are potentially linked as in Słaby et al. (2011) therefore the analysis of their concentrations deserves its own discussion.
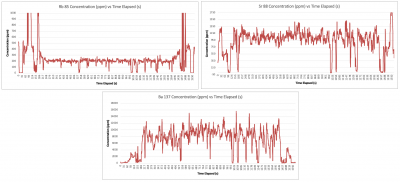
The concentrations of Rb 85, Sr 88, and Ba 137 have a much more obvious trend than the previously discussed major elements. The graphs of barium and strontium show a distinct decrease in the rim of the crystal that is not related to the multitude of inclusions. This can be determined through comparison to the indicator analytes discussed above. The decrease in barium is especially clear on the right side of the graph where the small peak is situated between two large troughs in concentration that are caused by inclusions. The strontium decrease is less clear but is visible between spikes and troughs caused by other mineral phases.
Rubidium shows an increase in concentration toward the rim, opposite of the trend in Ba and Sr. This increase begins prior to the significant inclusions on the rim of the K-feldspar crystal. Closer to the core the rubidium concentration remains surprisingly consistent; indicating that some process must have been altered to cause an enrichment of rubidium in the rim.
Minor elements
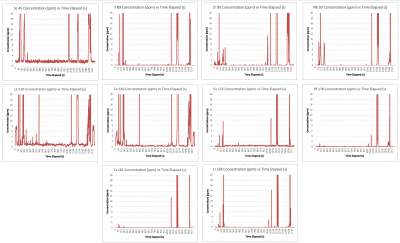
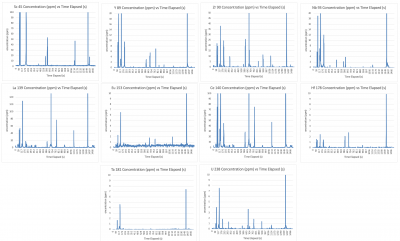
The minor elements included in this section are Sc 45, Y 89, Zr 90, Nb 93, La 139, Ce 140, Eu 153, Hf 178, Ta 181, and U 238. These analyte elements all occur in very low concentrations, typically <5 ppm, the peaks in concentration are again caused by mineral inclusions. The concentration of most of these elements is typically too close to the limit of detection to be reliably considered, so they will not be used during the discussion of the growth of the K-feldspar megacryst. While they aren’t useful for our analysis of the K-feldspar they do show that the mineral inclusions are potentially enriched in trace elements. However, this can not be concluded from our experiment alone because they require specific data reduction using internal standards representative of the mineral phase being ablated.
North-South Transect
This transect shows a longer transect of the crystal than that of the East-West transect but only shows a single core-rim traversal. Again these graphs were created using a 7-point moving median to smooth out potential significant outliers. In the graphs to follow the data begins at the rim and moves North through the core.
Major Elements
These graphs again show the significant amount of inclusions located at the rim that decrease toward the core. Similarly to the East-West transect, there are no other obvious patterns in the elements intended to be indicators of mineral inclusions, and the potassium concentration fluctuates significantly but remains relatively constant. The core is indicated by an area of more stable potassium concentration.
Rb, Sr, and Ba
The concentrations of Ba, Sr, and Rb show similar trends as the East-West transect, but the trend is more apparent as there is more area of K-feldspar to be analyzed that is not obscured by inclusions. The Sr and Ba concentrations trend downward in the rim of the megacryst, and the Rb concentration increases simultaneously.
Minor elements
The minor elements in this transect follow the same pattern as that of the East-West transect. Spikes indicate mineral inclusions and do not indicate trends within the K-feldspar crystal. The elements are again too close to the limit of detection to be considered significantly but may be enriched within inclusions.
Core and Rim Grid
Each grid consists of 16 spots within the core and rim of the megacryst to provide a more significant quantitative analysis of trace elements. The full dataset can be downloaded here. For this section, we will discuss the average concentrations within the grids rather than the concentration at each spot. This is done to conduct a more general comparison in concentration between the core and rim rather than between distinct spots. With some exceptions, each spot shows a similar concentration to the others within its grid, therefore this comparison strategy is reasonable.
In the core, all spots show similar concentrations of Mg, Fe, Zr, and Ti confirming that they are all from ablating the K-feldspar.
However, in the rim grid, 7 spots show elevated concentrations of Mg, Fe, Zr, or Ti that suggest the spot overlaps with a mineral inclusion. Spots 9, 10, 13, 14, and 15 show significantly elevated concentrations of magnesium, spots 1 and 13 show elevated levels of titanium, spots 1, 3, 9, 13, and 15 show significantly elevated levels of iron, and spots 1 and 13 show elevated levels of zirconium. With this in mind spots 1, 3, 9, 10, 13, 14, and 15 have been excluded from the averages for the rim grid.
The data for the core and rim grid are shown below:
| Core Grid | Rim Grid | |||||||
| Analyte | Conc. (ppm) | 2 std error | LOD | Analyte | Conc. (ppm) | 2 std error | LOD | |
| Mg 24 | 12.39 | 3.45 | 0.14 | Mg 24 | 19.55 | 4.84 | 0.16 | |
| K 39 | 104006.43 | 2648.45 | 5.97 | K 39 | 94892.30 | 2207.91 | 6.86 | |
| Sc 45 | 2.26 | 0.16 | 0.09 | Sc 45 | 2.15 | 0.16 | 0.10 | |
| Ti 47 | 38.55 | 3.59 | 0.54 | Ti 47 | 36.32 | 3.14 | 0.60 | |
| Fe 57 | 540.87 | 29.63 | 10.03 | Fe 57 | 522.80 | 33.66 | 11.71 | |
| Rb 85 | 207.59 | 5.69 | 0.14 | Rb 85 | 223.47 | 5.60 | 0.17 | |
| Sr 88 | 1070.67 | 28.34 | 0.01 | Sr 88 | 1086.58 | 24.82 | 0.02 | |
| Y 89 | Below LOD | Y 89 | Below LOD | |||||
| Zr 90 | Below LOD | Zr 90 | Below LOD | |||||
| Nb 93 | Below LOD | Nb 93 | Below LOD | |||||
| Ba 137 | 10080.38 | 281.46 | 0.16 | Ba 137 | 7157.21 | 178.11 | 0.18 | |
| La 139 | 0.98 | 0.09 | 0.01 | La 139 | 1.29 | 0.11 | 0.01 | |
| Ce 140 | 0.32 | 0.05 | 0.01 | Ce 140 | 0.52 | 0.06 | 0.01 | |
| P r141 | Below LOD | P r141 | Below LOD | |||||
| Nd 146 | Below LOD | Nd 146 | Below LOD | |||||
| Sm 147 | Below LOD | Sm 147 | Below LOD | |||||
| Eu 153 | 0.41 | 0.05 | 0.02 | Eu 153 | 0.35 | 0.04 | 0.02 | |
| Gd 157 | Below LOD | Gd 157 | Below LOD | |||||
| Tb 159 | Below LOD | Tb 159 | Below LOD | |||||
| Dy 163 | Below LOD | Dy 163 | Below LOD | |||||
| Ho 165 | Below LOD | Ho 165 | Below LOD | |||||
| Er 166 | Below LOD | Er 166 | Below LOD | |||||
| Tm 169 | Below LOD | Tm 169 | Below LOD | |||||
| Yb 172 | Below LOD | Yb 172 | Below LOD | |||||
| Lu 175 | Below LOD | Lu 175 | Below LOD | |||||
| Hf 178 | Below LOD | Hf 178 | Below LOD | |||||
| Ta 181 | Below LOD | Ta 181 | Below LOD | |||||
| U 238 | Below LOD | U 238 | Below LOD |
As seen with the transects many of the trace elements occur in concentrations below the limits of detection and are therefore not viable for consideration. Amongst the elements that are viable for comparison Sc, Ti, Fe, Sr, and Eu had very similar concentrations in the core and rim. This is different from the line scans where Sr decreases toward the rim.
The analytes that increased in the rim compared to the core are Ce, La, Rb, and Mg. The increase in Rb aligns with our results from the line scans. The increases in Ce, Mg, and La are not very large compared to the 2 standard error statistics, but are present.
The analytes that decreased from core to rim are Ba and K. The decrease in Ba aligns with our results from the line scans and is very significant. K decreases significantly as well in the rim of the megacryst. This decrease was not as significant in the line scans, so it is interesting to see occur in the spots.