Methodology
Elemental variations within a feldspar megacryst sourced from Yosemite National Park were meticulously quantified using LA-ICP-MS in a singular session conducted on November 16, 2023, at the Department of Geosciences, University of Texas at Austin. The analysis was facilitated by an advanced ESI NWR193 excimer laser ablation system (193nm, 4ns pulse width) coupled with an Agilent 7500ce ICP-MS.
The LA-ICP-MS setup boasts a large-format, two-volume sample cell designed for rapid washout (<1s), enabling seamless accommodation of all samples and standards within a single cell loading. The system underwent daily optimization to ensure heightened sensitivity across the AMU mass range while minimizing oxide production (ThO/Th: 0.352%), achieved by meticulous parameter tuning against an external reference standard (NIST 612) and a calibration standard (NIST 610).
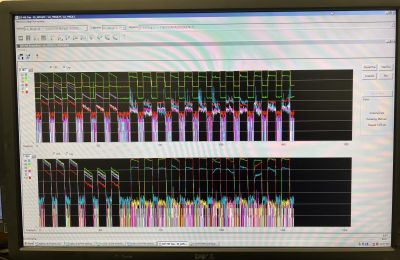
Following the pre-ablation process (100μm scan line, 100μm/s scan rate, 7.3 J/cm2 fluence) aimed at eliminating shallow surface contaminants, both a North-South and an East-West transect were conducted on the megacryst. This involved utilizing a 20Hz repetition rate, and carrier gas flows of 0.9L/min for Ar and 0.85L/min for He. The line scan transects were scanned at a repetition rate of 20 Hz, with a 75μm spot size moving at 25μm/s, and a fluence of 9.7 J/cm2.
The pre-ablation for the spot size of 100μm had a fluence of 9.7J/cm2, for one second, and a 20Hz repetition rate. A grid of 16 spots was placed at the rim of the megacryst and another grid of 16 was placed within the core of the megacryst. The ablation process for the spots scanned with a fluence of 7.23J/cm2, 20Hz, dwell time of 45 sec, and 75μm spot size.
Baseline intensities were established before each standard and sample analysis by conducting 30-second gas blank measurements while the laser remained inactive, and the quadrupole scanned across all masses. Employing a quadrupole time-resolved method, 10 masses were measured with 10ms integration times (24Mg, 29Si, 39K, 45Sc, 47Ti, 57Fe, 85Rb, 88Sr, 90Zr, 137Ba). The rest of the 19 masses were measured with 25ms integration times (89Y, 93Nb, 139La, 140Ce, 141Pr, 146Nd, 147Sm, 153Eu, 157Gd, 159Tb, 163Dy, 165Ho, 166Er, 169Tm, 172Yb, 175Lu, 178Hf, 181Ta, 238U). As the method was updated for line scan data collection, multiple masses were removed. This left 24Mg, 29Si, 39K, 45Sc, 47Ti, 57Fe, 85Rb, 88Sr, 89Y, 90Zr, 93Nb, 137Ba, 139La, 140Ce, 153Eu, 178Hf, 181Ta, 238U all at the same integration times as in spot scan data collection. This was done to decrease the total integration time for analytes to improve data collection during the scan.
The quadrupole’s duty cycle of 0.1442s corresponds to 89.51% measurement time, with linear sampling rates of 0.721μm, enabling 29 measurements within the footprint of the 25μm aperture. Measured intensities underwent conversion to elemental concentrations (ppm) through the utilization of Iolite software (Paton et al., 2011), where Si served as the internal standard, and a Si index concentration value of 30.3 wt% was employed for unknowns. This concentration is based on the stoichiometric weight percent of Si in K-feldspar.
A series of experiments were conducted involving varied laser power proportions of 20%, 30%, 40%, and 50%, each paired with corresponding laser fluences of 1.67, 3.13, 4.47, and 5.15 J/cm2. Subsequently, a repetition of these trials was undertaken at a 20Hz repetition rate to mitigate spectral skewness.
For the line scan procedure, evaluations were performed at percentages of 50%, 60%, 70%, and 80%, utilizing respective laser fluences of 5.15, 7.23, 8.56, and 9.74 J/cm2. Following systematic assessments, a deliberate selection of fluences of 5.15 J/cm2 for spot analyses and 9.74 J/cm2 for line scans was made. This decision was grounded in the understanding that the line scanning method operates at a higher pace, hence employing higher power facilitates enhanced signal acquisition despite the continuous movement during analysis.
Standard recoveries were typically within 5% of 100% with a standard deviation of 16%. In a Ca-rich matrix, Fe suffers from significant interferences. When Fe is excluded, the standard deviation is improved to 5%.
