Results
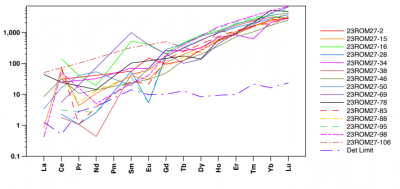
One of the primary objective in this study is to determine the correlation between the detrital zircon ages group and the trace and REEs signatures. However, the limit of detection for significant(subduction-related) trace elements such as Ti and Hf isotopes in a Quadrupole LA-ICP-MS does not allow for reliable geochemical interpretation. The REEs series are then plotted for the pattern identification described by Rubatto, 2002 (Fig. 1).
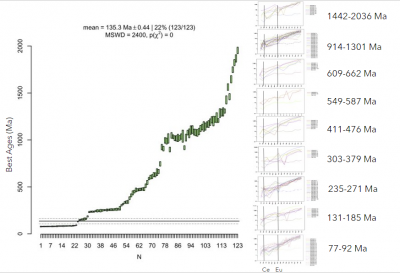
Figure 1. Weighted mean plot of detrital zircon populations from 23ROM27 with the corresponding series of Cl Chondrite-normalized Rare Earth Elements patterns.
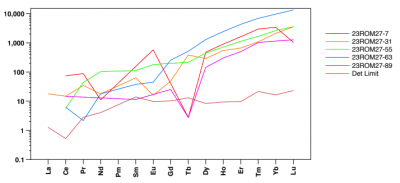
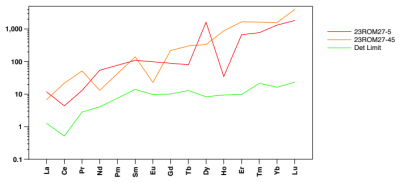
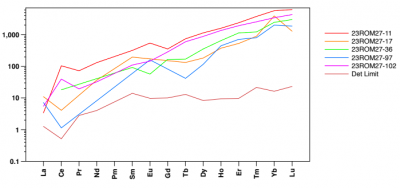
Despite that a general trend of REEs from different age groups is hard to identify, there is a clear distinguishing pattern in between the assigned age groups. The youngest age group from the detrital zircons ranges from 77-92 Ma. Within this age group, the concentration of elements increase as the mass increases with the most fluctuation of concentration range in the light REE series, and the narrow enriched pattern of heavy REEs following Eu, except for 23ROM27-5 which displays irregularities after the Eu anomaly. The normal pattern of Ce enrichment (Ce anomaly) is observed in majority of the zircons population (e.g. Fig. 2).
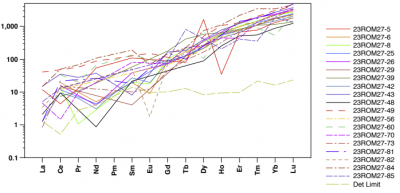
Figure 2. Chondrite-normalized Rare Earth Elements pattern from the detrital zircons dated that range from 77-92 Ma.
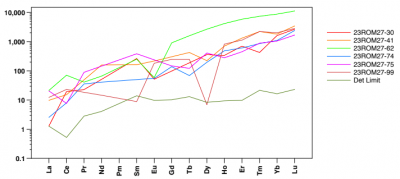
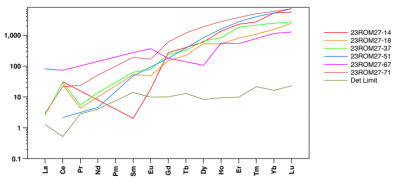
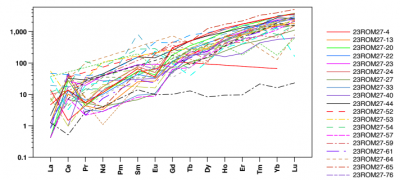
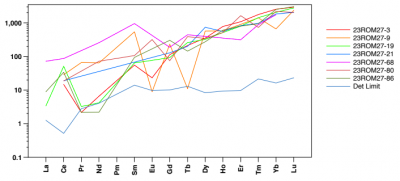
In the second youngest zircon age group (131-185 Ma) shows similar patterns to the aforementioned group (Fig. 2). However, the Ce enrichment is hard to identify with both increasing and decreasing spikes. The 235-271 Ma graph displays an overall LREE depletion and HREE enrichment with a semi-distinguishable trend for the Ce and Eu anomalies. In the zircon population with the age range of 303-379 Ma, the similar pattern to the 131-185 Ma age group with a distinction of the depletion of Dy in 131-185 Ma and a depletion in Tb for the 303-379 Ma age group. In the 411-476 Ma zircon population, the graph follows the general REEs pattern with the observable enrichment in Ce and depletion in Eu as described in Rubatto, 2002, however there is a depletion in Sm. This general pattern are found in the other two zircon groups of 549-587 Ma and 609-662 Ma. Adding on, 609-662 Ma age group splits into two trends, half the grains display Ce enrichment while the others display Ce depletion. No general Eu anomaly is observed, but they do demonstrate HREE enrichment. The 914-1301 Ma zircon age group displays a general LREE depletion and HREE enrichment, similar to 609-662 Ma but 914-1301 Ma does demonstrate the Ce and Eu anomalies. The last age group, 1442-2036 Ma displays no general trends except for LREE depletion and HREE enrichment.
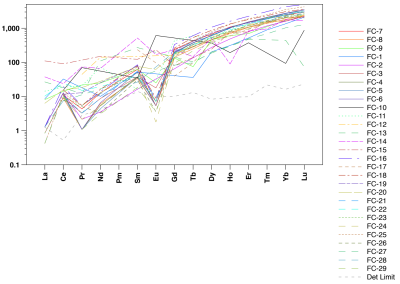
The REE concentrations were also measured on the FC-1 zircon standard (1099 ± 0.6 Ma), from a gabbroic anorthosite of the Duluth gabbro complex in Minnesota (Coyner et al., 2004). The majority of the 30 FC-1 grains that were ablated demonstrate strong trends. One FC-1 zircon was excluded due to low Th/U content. The Ce anomaly is strongly observed and the Eu anomaly is also present, and a strong trend of LREE depletion and HREE enrichment is observed in this igneous zircon.
 (a)
(a)
(b)
(c)
(d)
(e)
(f)
(g)
(h)
Figure 4. plots of chondrite-normalized Rare Earth Elements patterns from all different age group of detrital zircons from 23ROM27 including a) 131-185 Ma, b) 235-271 Ma, c) 303-379 Ma, d) 411-476 Ma, e) 549-587 Ma, f) 609-662 Ma, g) 914-1301 Ma, h) 14420-2036 Ma.