Methodology
The double-dating method by trace and rare earth element variations among multiple detrital zircon age populations was developed using Quadrupole LA-ICP-MS, in a session, at the University of Texas at Austin, Department of Earth and Planetary Sciences at the Jackson School of Geosciences, on November 29, 2023, using ESI NWR 193 excimer laser ablation system (193 nm, 4-6 ns pulse width) coupled to an Agilent 7500ce Octopole Reaction System ICP-MS. A large format, two-volume, sample cell with fast washout (<1s) accommodated several large cylindrical samples of 2.5 cm diameter 0.9 cm thick in a single cell loading. The LA-ICP-MS system is tested daily on the tuning standard of NIST 612 to optimize for signal sensitivity across AMU mass range and minimize oxide interferences (ThO/Th). The sample 23ROM27 was previously dated for U-Th-Pb detrital zircon geochronology on a Thermo Scientific E2 single-collector LA-ICP-MS at Arizona LaserChron Center following the method of Pullen et al., 2016.
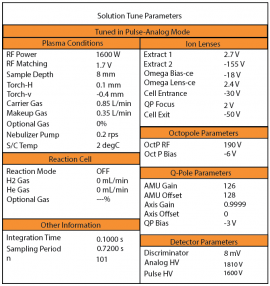
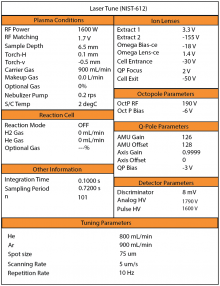
First, we performed the solution tuning by measuring the sensitivity or pulse-analog factor or the (P/A factor) across all AMU mass ranges. The overall sensitivity is sufficient except Sr, which is too low. Then, we tuned the laser ablation system on NIST 612 with 75 µm diameter, ablation size at 5 µm/s and a repetition rate of 10 Hz using Ar and He as carrier gasses that flow at 900 mL/min and 800 mL/min, respectively. The resulting mass fractionation of U-238/Th-232 is 102.141%, which is close to the optimal condition of 100%. The oxide production rate is 0.306% (ThO/Th). The obtained sensitivity or signal conversion factor from the Pr-141 measurement is 930 cps/ppm (35,237 cps/37.9 ppm).
The optimal parameters above and below are used to test the representative unknown zircon grains to optimize for the high sensitivity elemental and low oxide measurements in the zircon samples. We perform the initial method development on zircon with the time-resolved analysis on an unknown zircon crystal with the chosen AMU ranges measurements for a total of 34 masses and 60 s dwell time. The resulting integration time per sampling period ratio is 84.96%. The relationship between laser power with respect to fluence are also recorded from 10 to 50 percent laser power, which correspond to a range of fluence from 0.27 to 5.63 J/cm2, respectively.
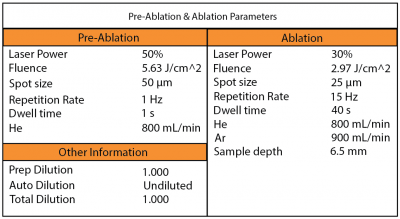
After the initial method, we analyzed four representative unknown zircon crystals from the optional parameters obtained from the initial test. With the four representative unknown zircons, the level of laser power tested used 10 percent increments from 20 to 50 percent power, which corresponds to 1.57, 2.97, 4.30, and 5.63 5.63 J/cm2 with 60 s dwell time, 20 s gas blank background measurement, 10 Hz rep rate, 25 μm spot diameter, and 6.5 cm sampling depth. The Si-29 signals are primarily observed for the optimal signal intensity. As the power increases the signal intensity decreases with the risk of signal dwindling, which could be attributed to downhole fractionation. The 30 percent laser power with 2.97 J/cm2 fluence was chosen for optimal signals. To minimize the integration per sampling period, we decreased the number of AMU mass ranges to 24 essential masses for the Ti, Hf, and REEs concentration measurements resulting in the increase integration time to 88.87 percent. To optimize for the repetition rate, we recorded the signals from three different rep rates from 10, 15, to 20 Hz using the predetermined laser, ICP, and mass spectrometer parameters. The result signals showed small variation in the signal intensity differences. Therefore, we opted for the 15 Hz repetition rate and 30 percent laser power to produce the highest sensitivity and consistent mass signals.
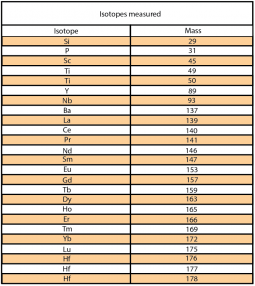
Before the actual data acquisition every zircon crystals were pre-ablated to clean off the residual materials from the prior dating experiments using 50 μm spot diameter at a repetition rate of 1 Hz and 1s dwell time. Following the pre-ablation procedure, (50 µm, 5.63 J/cm2 fluence), 30% laser power, 15 Hz rep rate, and carrier gas flows of 0.9 L/min for Ar and He were adapted for ablation procedure for the data acquisition. Baseline intensities before each standard and sample analysis were determined from 20 s gas blank measurements made while the laser was off and the quadrupole scanned all masses. The quadrupole time-resolved method measured 24 masses/charge ratios, including Si, P, Sc, Ti, Nb, Ba, REEs, Y, and Hf, with 40s integration time.
The quadrupole measured intensities were converted to elemental concentrations (ppm) using iolite software (Paton et al, 2011), with Si as the internal standard from its average weight percent in zirconium (ZrSiO4). NIST 612 was used as the primary calibration standard and NIST-610 was used as an external reference standard. Standards were analyzed hourly in triplicate for 40s. Over the course of the experiment, the grand average of secondary standard (n=9) recovery fractions for all elements was typically within 6 % of reference values. Typical concentrations over the ablation pit were 6 to 1400 of times higher than the limit of detection for La, Ce, Pr, Nd, Pm, Sm, Eu, Gd, Tb, Dy, Ho, Er, Tm, Yb, Lu, and Y, K, Sc, Ti, Nb, Ba, and Hf concentrations were mainly below detection, and are not subsequently considered (Table 1). The derived elemental time-series were smoothed by consecutive moving median and average filters using 7 point boxar width.
After measurements were performed on the Agilent Quadrupole LA-ICP-MS, the data was reduced on Iolite, and plotted on Aabel software, where the REE plots were normalized to Cl-chondrites (McDonough & Sun, 1995).
Table 1. Average elemental concentrations (ppm) in a detrital zircons population (n=136)
*LOD is the limit of detection
**S:N is the average concentration of trace elements from a population of analyzed zircon crystals.
italicized entries show elements with average concentrations less than 3 times of detection limits
| La | Ce | Pr | Nd | Sm | Eu | Gd | Tb | Dy | Ho | Er | Tm | Yb | Lu | P31 | Sc45 | Ti49 | Y89 | Nb93 | Ba137 | Hf176 | Hf177 | Hf178 | |
| Avg | 2.4 | 14.6 | 1.5 | 11.7 | 15.1 | 4.1 | 31.5 | 9.6 | 115.3 | 41.7 | 186.2 | 40.1 | 380.5 | 72.6 | 46828.3 | 323.3 | 85.2 | 1237.2 | 3.6 | 203.8 | 2647.0 | 9665.9 | -15648.8 |
| Stdev | 5.4 | 15.2 | 2.5 | 18.7 | 24.8 | 7.1 | 28.1 | 8.5 | 91.4 | 29.4 | 125.1 | 27.3 | 231.6 | 45.1 | 114739.9 | 121.3 | 887.2 | 835.4 | 17.3 | 1571.3 | 907.3 | 3049.2 | 282802.9 |
| LOD | 0.30 | 0.32 | 0.26 | 1.85 | 2.07 | 0.55 | 2.01 | 0.47 | 2.04 | 0.51 | 1.56 | 0.53 | 2.63 | 0.57 | 47320.39 | 321.86 | 91.01 | 0.89 | 3.66 | 213.72 | 2634.38 | 9617.94 | 14.69 |
| S:N | 7.9 | 46.0 | 5.9 | 6.3 | 7.3 | 7.4 | 15.6 | 20.5 | 56.5 | 81.2 | 119.5 | 75.2 | 144.7 | 127.4 | 1.0 | 1.0 | 0.9 | 1390.1 | 1.0 | 1.0 | 1.0 | 1.0 | -1065.3 |