Results
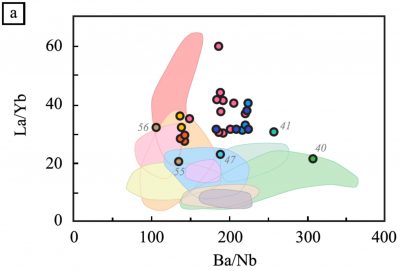
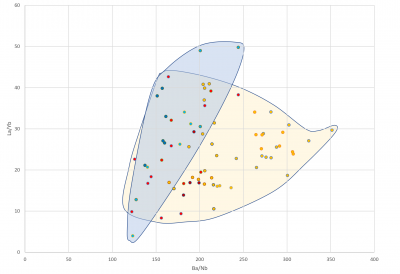
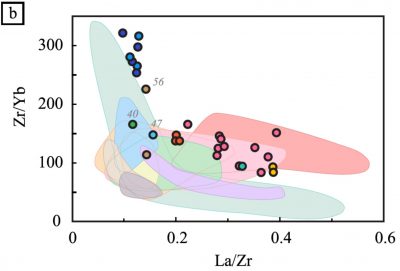
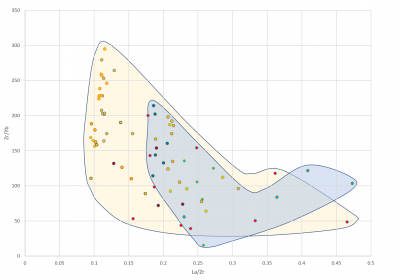
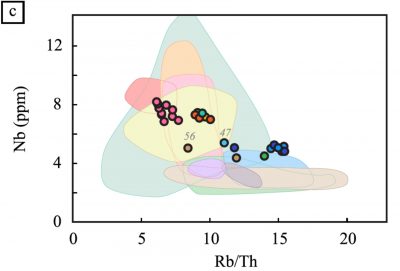
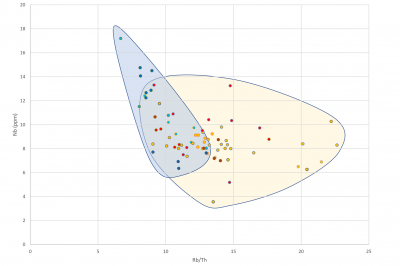
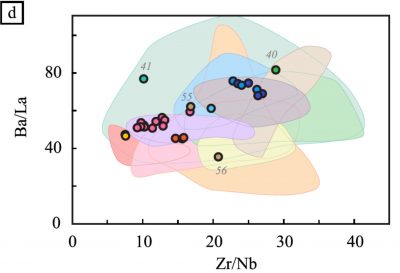
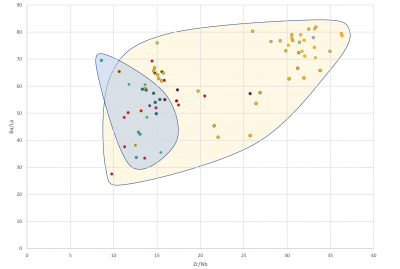
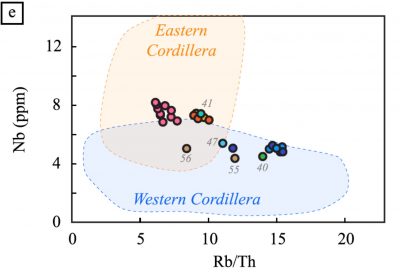
Once the Results were exported, spots were grouped into their respective samples and simple statistics were used to look at the variation among each analyte within each sample. Spots with a significant number of negative values and spots with more than 4 rare earth elements below the detection limit were eliminated as this is an indication that they were likely quartz rather than volcanic glass. Spots with extreme outlying values greater than 2-standard deviations above or below the mean were also eliminated. Spots were then grouped into their respective samples, plotted using the same element ratios as Bablon et al., then color coded in groupings based on the in-field visual identifications they were first assigned. Dark blue and dark red dots represent the Cayambe and Quilotoa controls respectively. Light blue represents samples identified as Cayambe by volcanologists, light red samples that were identified as Quilotoa by volcanologists, and gold represents samples that were identified as Quilotoa by archaeologists. Groupings were created around the Cayambe and Quilotoa identified spots with the blue bubble representing Cayambe and the yellow bubble representing Quilotoa. The distributions were then comparted to Bablon et al.’s to see how trace element ratios overlapped with their volcano identifications. The preliminary results are depicted below.