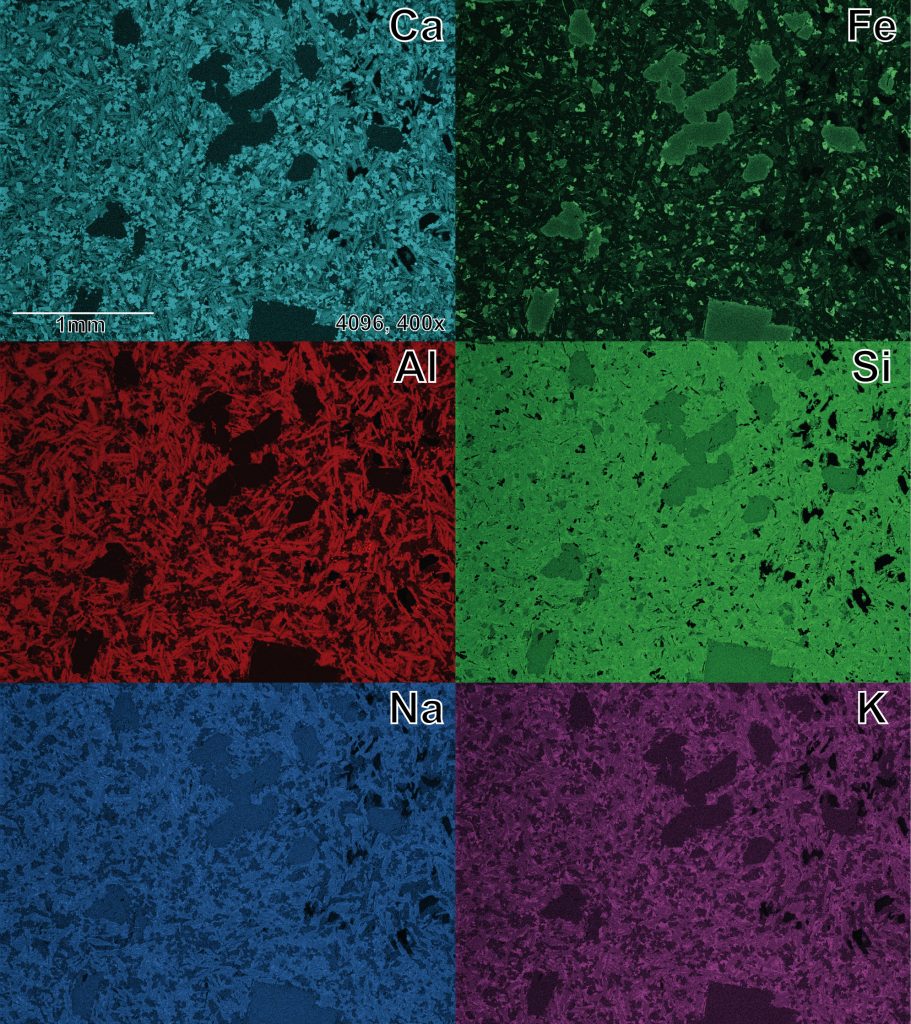
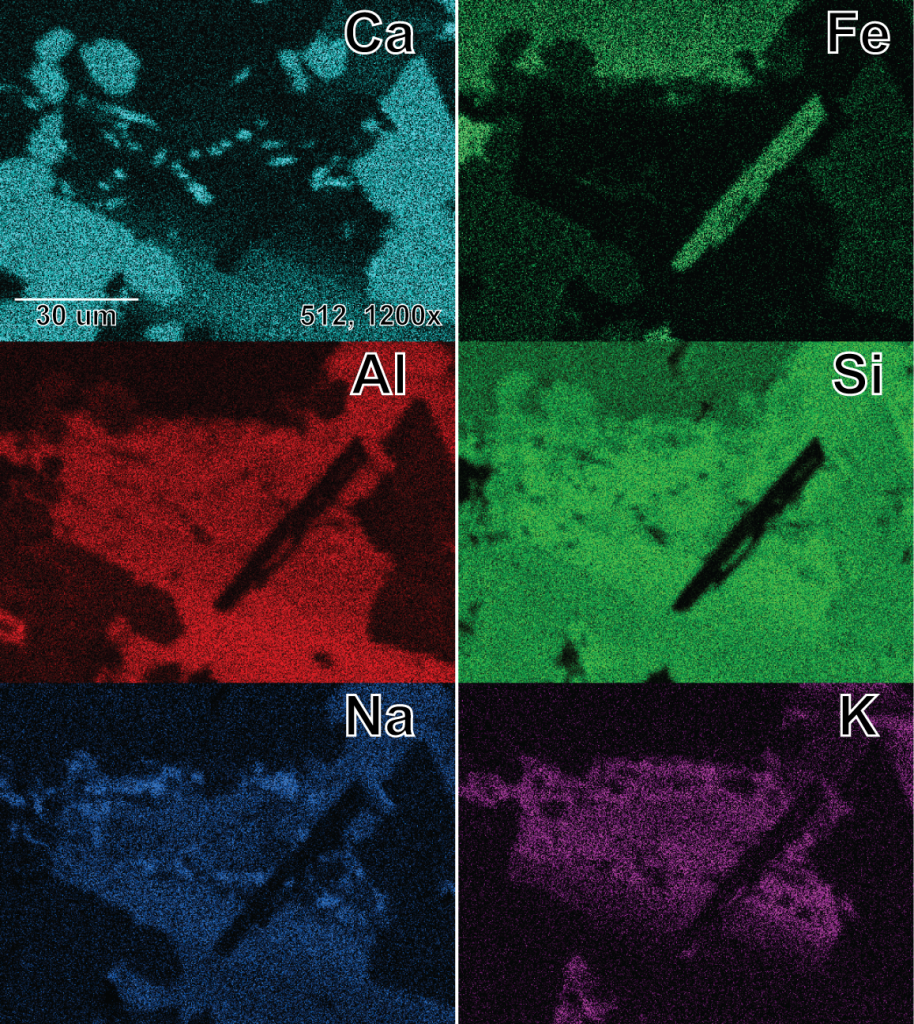
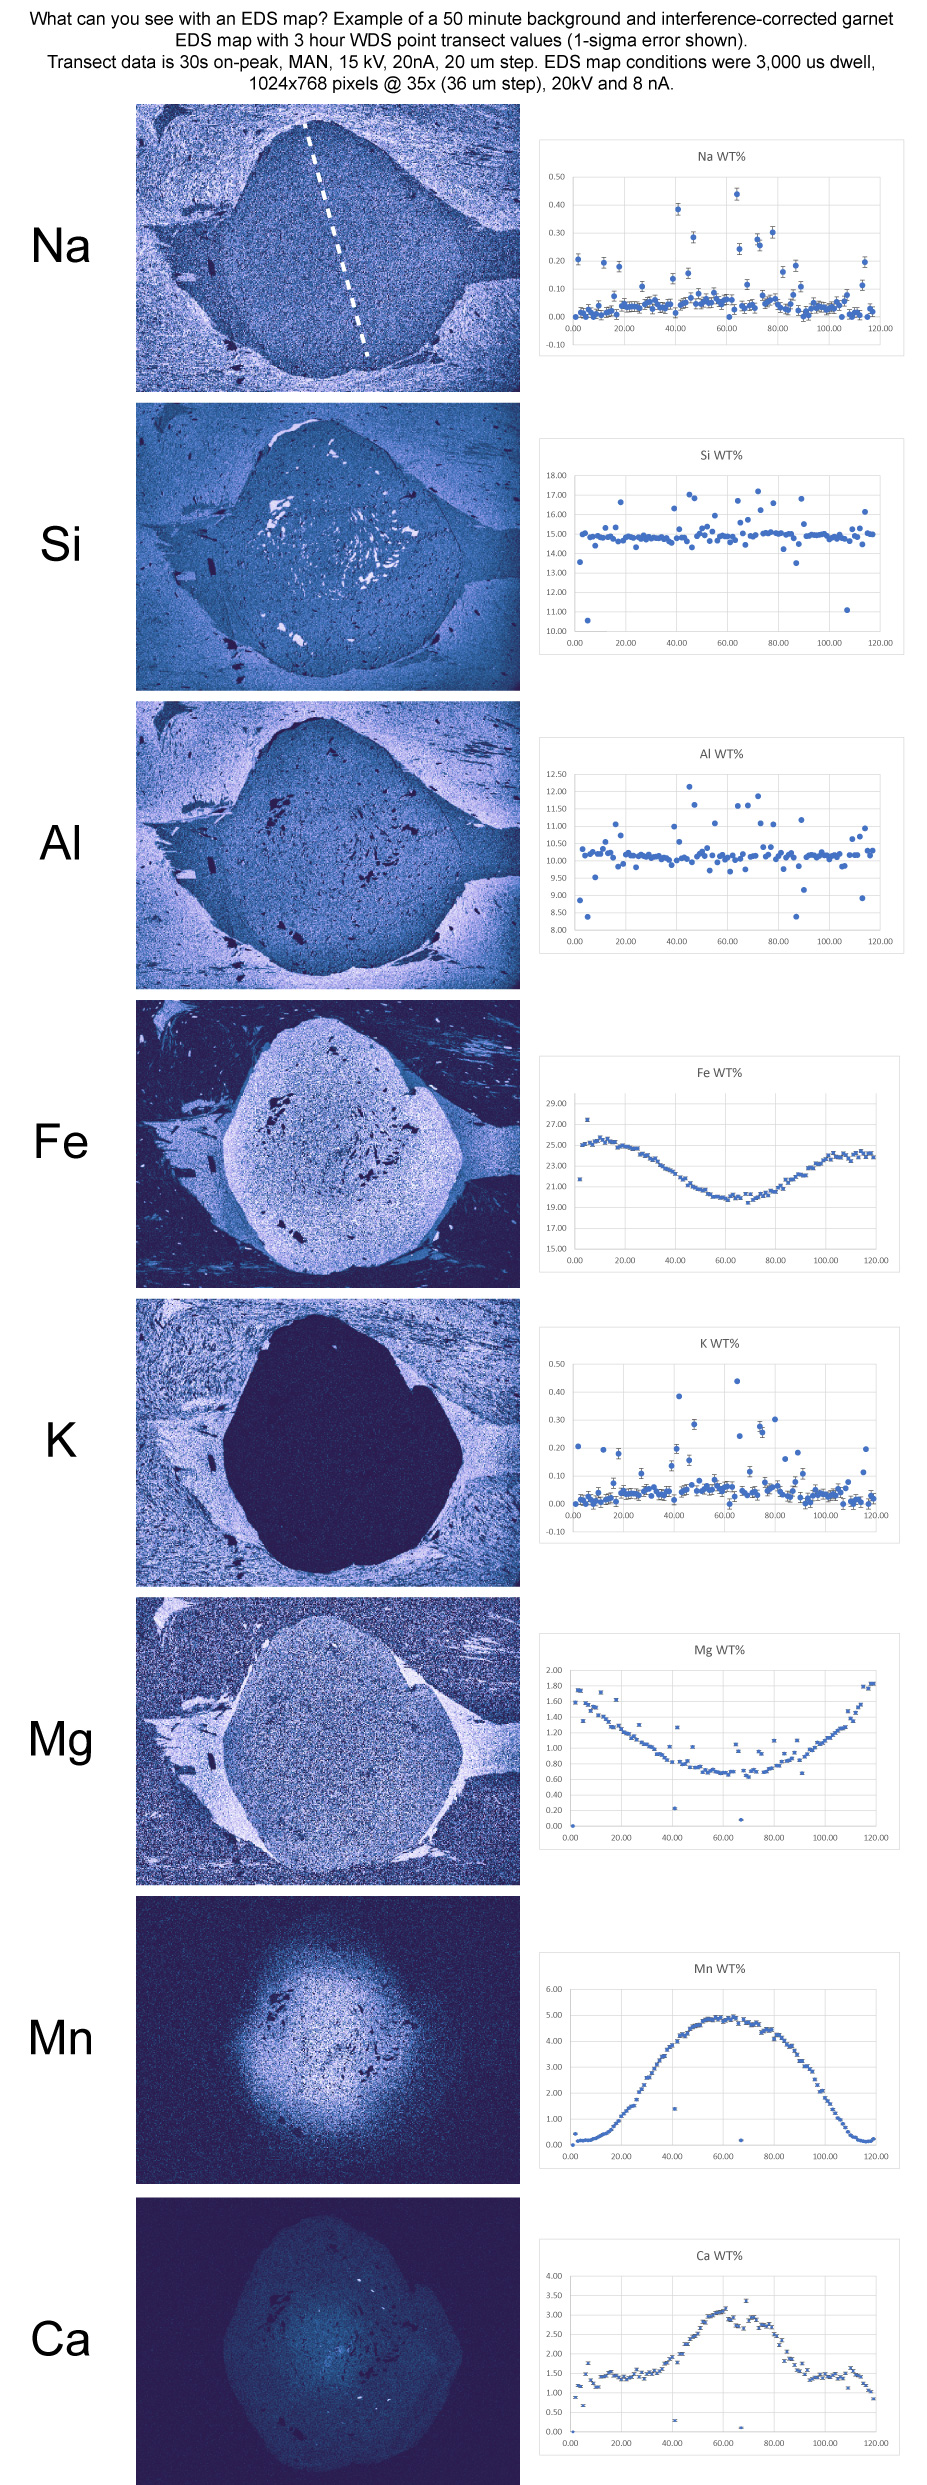
SEM Technique: EDS mapping

Energy dispersive spectrometry (EDS) is an X-ray characterization technique that allows extremely rapid elemental concentrations to be gathered. Elemental concentrations can be collected from points, along lines, or as maps. Our JEOL 6490 is equipped with an Oxford Instruments X-max 50mm2 detector, operated through the Aztec software. On our instrument, EDS can be collected at the sub-micron scale (lower kV allows for smaller spot sizes, but loses the ability to resolve higher-Z elements) over areas as large as cm2. All maps can be corrected for background contribution and interfering X-ray lines (TruMap).

Elemental map of common elements in a basalt, collected at 40x with a ~800nm step size over ~20 minutes
Elemental map of common elements in a basalt, collected at 40x with a ~800nm step size over ~20 minutes.
Elemental map of common elements in a basalt, collected at 1200x with a ~200nm step size over ~5 minutes
An elemental map of common elements in basalt was collected at 1200x with a ~200nm step size over ~5 minutes.
What can you see with an EDS map? This is an example of a 50-minute map of a Himalayan garnet, side-by-side with results from an EPMA point transect from the same garnet showing easily visible variations of a few wt%. The EDS map is background and interference corrected, with Fabio Crameri’s Devon scientific color map applied (https://www.fabiocrameri.ch/colourmaps/).