ICP-MS?
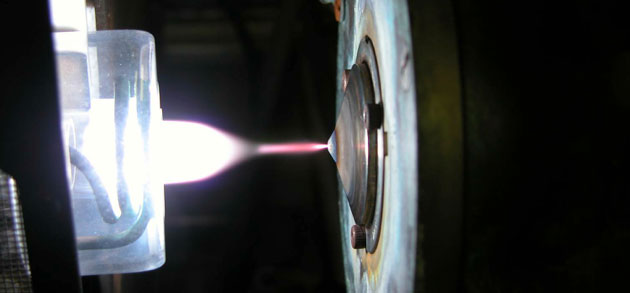
Plasma at the entry of the sampler. Image courtesy of: http://iramis.cea.fr/en/Phocea/Vie_des_labos/Ast/ast_sstechnique.php?id_ast=886
What is ICP-Q-MS?
Inductively coupled plasma mass spectrometry (ICP-MS) is the fastest growing multi-element trace element analysis technique with more than 8000 ICP-MS instruments installed worldwide (Thomas 2008), most of which are quadrupole systems. In general, “ICP-MS” without further description implies a quadrupole-based mass analyzer system (ICP-Q-MS), but there are also multicollector (ICP-MC-MS) and time-of-flight (ICP-TOF-MS) instruments. ICP-Q-MS is principally used for rapid, precise and accurate trace (<1000 ppm) element determinations in liquid and solid samples, but other applications include isotopic determinations and speciation studies. The power of modern ICP-Q-MS resides in its ability to rapidly measure trace elements at very low detection limits (to sub parts per trillion levels) as well as minor and major elements (at parts per million levels) in the same analytical run on suitably diluted samples. The technique was commercially developed in the early 1980s and because of superior detection capabilities has superseded many other analytical methods including: atomic absorption, optical emission spectroscopy, and ICP atomic emission spectroscopy (Wolf, 2005). Major advancements required for routine elemental analysis by ICP-Q-MS included development of: (1) a stable plasma source capable of ionizing most elements of the periodic table, (2) an interface system to transfer ions from the corrosive high temperature (6000-10,000°K- atmospheric pressure (760 torr) environment of the Ar plasma into the mass spectrometer analyzer region at room temperature and low pressure (10-5 torr), and (3) technology to remove interferences, notably collision/reaction cells (CRCs).
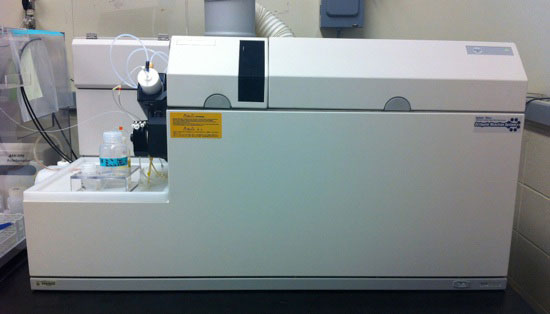
Figure 1. Inductively coupled plasma mass spectrometers (ICP-MSs), such as the Agilent 7500ce shown here, can rapidly, accurately, and precisely measure elemental concentrations for most of the periodic table in liquid and solid samples.
Several integrated hardware components (most hidden from direct view) comprise a modern ICP-Q-MS instrument as shown cryptically above (Fig 1) and schematically below (Fig 2):
- Sample introduction system
- Excitation source for ionization (ICP)
- Ion transport system operating from atmospheric pressure to 10-6 torr (Interface/Ion Lens Optics)
- Collision-reaction cell
- Mass separation device (quadrupole)
- Ion detector
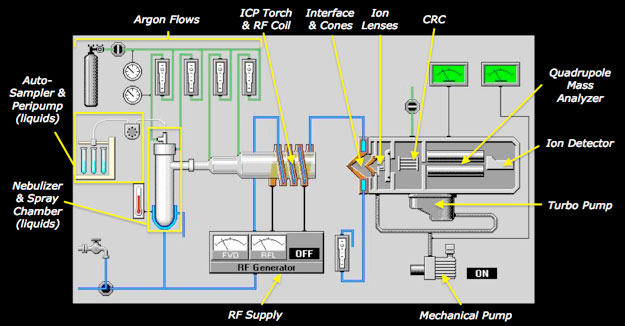
Figure 2. Schematic view of typical hardware components of an ICP-Q-MS for solution mode sample introduction. For analysis of solids, a laser ablation system (not shown) replaces the roles of the autosampler, peristaltic pump, nebulizer, and spray chamber.
Fundamental principles of ICP-Q-MS
An ICP-Q-MS uses an inductively coupled Ar plasma (described below) as an excitation source to ionize the sample and a quadrupole mass spectrometer as an analyzer to separate and selectively transmit sample (analyte) ions of a single mass-to-charge ratio (m/z) to the detector. During this process, sample ions rapidly undergo large temperature (6000K-to-room temp) and pressure (760 to 10-6 torr) reductions. In essence, ions are systematically transferred from the plasma to the detector in a highly controlled electrostatic field within a dynamically increasing vacuum. A computer controls all hardware components, including peripherals involved in automated sample introduction, as well as data acquisition, storage, display, and processing.
Sample Introduction: The sample is introduced as either a liquid, typically via a peristaltic pump, nebulizer, and spray chamber, or as a solid particulate aerosol, as generated by a separate laser ablation system. For liquids, the nebulizer converts the sample into a fine aerosol mist using a stream of Ar gas. The finer aerosol droplets, optimal for efficient ionization in the ICP, are separated from larger droplets in an enclosed spray chamber, a process that also dampens sample flow variations introduced by the peristaltic pump. For in situ sampling of solids using a laser ablation system (not pictured above), a high energy pulsed photon source interacts (or couples) with the sample in an ablation cell (chamber), ideally breaking atomic bonds at the sample surface before heating occurs. The laser induced stress and resulting photomechanical fracturing ejects fine solid particulates into the ablation plume, which are transported through the ablation cell by a carrier gas (usually He or Ar) and mix with Ar carrier gas flowing to the ICP torch. Regardless of the sample introduction system used, the aerosol produced (liquid or dry particulate) similarly flows through the central injector tube of the ICP torch.
Ionization Source: The inductively coupled plasma (ICP) is a highly ionized gas generated by the interaction of a strong magnetic field with Ar gas flowing through a quartz glass torch. The magnetic field is generated by 27-40 MHz radio frequency transmitted from a (water- or Ar-) cooled copper induction coil that encircles the distal (open) end of the torch. When a high voltage spark is applied, the flowing Ar gas ionizes to form a high temperature (~6000-10,000° K) plasma that becomes self-sustaining. The ICP torch typically consists of three nested concentric tubes, through which Ar flows at different rates. The outermost tube (Main Plasma Gas: Ar flow ~15 L/min) provides most of the plasma-forming Ar and prevents direct contact of the plasma with the torch walls. The medial tube (Auxiliary Gas: Ar flow ~ 0.75 L/min) controls the spacing of the plasma relative to the open (front) end of the torch. The central tube (Nebulizer Gas: Ar flow ~ 1 L/min) transfers the sample aerosol into the central region of the plasma (6500°K), where it is rapidly (virtually instantaneously; ~2 ms, Houk 1986) dried, dissociated, atomized and ionized.
Interface Region: The sample ions next pass through the plasma-vacuum interface region situated between two conical disks (cones), usually made of Ni or Pt, each containing a small (≤ 1mm) central orifice; the outer “sampler” cone with a larger (~2.5x) orifice compared to the inner “skimmer” cone. A pressure reduction (to 1-3 torr) in the interface region between the cones, maintained with a mechanical roughing pump, causes the incoming ion beam to dramatically expand behind the sampler cone such that the orifice of the second skimmer cone consistently passes on an ion distribution that is representative of the central analyte-rich portion of the plasma. The interface vacuum also serves to remove most Ar atoms at this point.
Ion Lens Optics & Collision/Reaction Cell: The sampled ions exiting the interface region next pass through ion lens optics, which consist of one or more positively charged (typically stainless steel) lenses. Differential voltages applied to the lens components achieve two purposes with minimal mass discrimination: (1) separation of positively charged ions from undesired neutral species and photons, and (2) focusing and collimation (narrowing) of the ion beam. The resulting positively charged ion stream then passes through the collision-reaction cell, which may be used to remove or highly attenuate polyatomic interferences (CRC, described separately below), to the quadrupole mass analyzer. The action of one or more turbomolecular pumps achieves further pressure reductions of ~10-3 – 10-4 torr for the ion lens optics and ~10-5 – 10-6 torr for the CRC and quadrupole mass analyzer.
Quadrupole: The quadrupole mass analyzer (described in more detail below) filters out non-analyte, matrix, and interfering ions, allowing only desired analyte ions of a single mass-to-charge ratio (m/z) to be transmitted to the detector. As its name conveys, a quadrupole consists of four parallel (conductive) rods, often made of gold-coated ceramic or molybdenum. Radiofrequency (RF) and DC potentials applied to each set of opposing rods produce a dynamic (hyperbolic) electrostatic field within the space between the rods. The electrostatic field, which controls the trajectories of ions entering the quadrupole as a function of their inertial mass and charge, can be rapidly changed and accurately optimized in order to allow only analyte ions of a specified m/z to pass entirely through the quadrupole and reach the detector. By changing the applied RF/DC voltages, the quadrupole can either scan iteratively across the entire amu range (continuous scanning) or jump selectively from target m/z to target m/z (peak hopping) in order to measure elemental ion abundances in a sample.
Ion Detector: The detector (usually an electron multiplier) receives and amplifies an ion signal that is proportional to concentration, as determined through calibration with one or more reference materials of known composition. Dual-stage discrete dynode electron multipliers are often employed because of their effective wide dynamic range. Positive ions passing from the quadrupole are attracted to the first negative dynode of the detector, whereupon impact secondary electrons are emitted from the dynode surface. These are then attracted to the positively charged second dynode, where more electrons are emitted. The electron emission process continues in this manner throughout the entire cascade of individual dynodes (usually 12-24), resulting in a geometrically amplified signal. Integrated circuitry for this detector, involving simultaneous measurement of signal intensity at mid- and final-dynode positions, can obtain a wide linear dynamic detection range spanning eight orders of magnitude, while also protecting the detector by excluding extreme high intensity signals. Low intensity signals (< 2M cps) are measured as counts per second at the lower dynode position (pulse mode). High intensity signals are measured from the final dynode as a voltages (analog mode), which are subsequently normalized to cps equivalents from pulse-to-analog conversion factors (previously optimized during tuning of the instrument). The dual-stage functionality of this detector achieves a linear detection range extending from ppt to 100s of ppm within a single multi-element analysis, commonly obviating the need for additional dilution.
How does ICP-Q-MS work?
I. Making Singly Charged (+1) Ions
Energy achieved by the Ar ICP is sufficient to cause the majority of sample atoms passing through it to exceed their first, but not second, ionization potentials (Fig 3). The significance of this is two-fold: (1) elements from most of the periodic table will be ionized to a +1 state, and (2) because the ions generated will principally differ by mass, not charge, they can be focused and separated on the basis of their inertial masses within an electrostatic field.
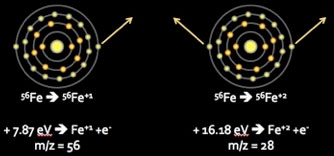
Figure 3. Energetics of progressive ionization of 56Fe. The Ar plasma temperature is sufficient to convert the vast majority of iron atoms into singly charged species (remove a single outer shell electron), with negligible production of doubly charged species (remove two outer shell electrons).
It is important to realize that although most elements are substantially ionized in the high temperature Ar plasma (Fig 4, Houk 1986; Douglas and Tanner, 1998), some elements having first ionization potentials approaching or exceeding that of Ar (15.76 eV) can have much lower ionization efficiencies. Quantitative ion measurements require both consistent +1 ionization and adequate sensitivity. Arsenic (9.81 eV), selenium (9.75 eV), and phosphorous (10.49 eV), for example, have fairly low first ionization efficiencies on the order of 52, 33 and 33%, respectively, which are still sufficient for robust quantitative determinations. By comparison, sulfur (10.36 eV) and fluorine (17.42 eV) have respective first ionization efficiencies of only 14% and 0.00091%, for which quantitative determinations are impractical or impossible. With well-optimized plasma conditions, doubly charged ions for most elements occur in negligible amounts, with worst case maxima typically on the order of 1-3% for elements having lowest second ionization potentials (e.g., Ba2+).
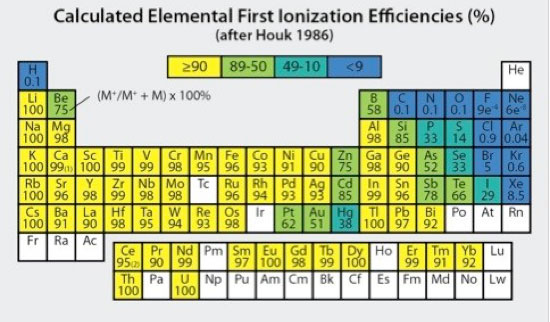
Figure 4. Elemental first ionization efficiencies (as percents) calculated for a Tion of 7500°K and electron density (ne) of 1 x 10¹⁵/cm3 (modified after Houk 1986).
II. Filtering Ions According to Mass-to-Charge (m/z) Ratio
ICP-Q-MS differs from other ICP-MS systems due to the employment of a quadrupole mass filter, through which the ion beam is directed before reaching the detector. It is within the dynamic electrostatic field of the quadrupole that ion flight stability as a function of inertial mass and charge is exploited to selectively transfer analyte ions of a single m/z to the ion detection system. The essential physical processes at work are electrostatic attraction/repulsion and inertia, with flight paths of “smaller” (less massive) ions more sensitive to electrostatic variations compared to “bigger” (more massive) ions. Within the quadupole electrostatic field, ion paths become spiral. Unstable flight paths result in ion collisions with one of the quadrupole rods, whereupon they are removed by neutralization. Ion paths either adjust sufficiently (maintain sufficiently narrow spirals) to pass through the length of the quadrupole, or obtain terminal collision trajectories (spiral paths too wide). The electrostatic field is highly controlled so that the m/z filtering process obtains a resolution less than 1 amu (typically ~0.7 amu). The quadrupole mass filtering process is extremely fast. For example, the quadrupole can scan over the 1-200 amu range in ≤ 20ms, or switch repeatedly from peak to peak in jumps of 1.8-25 µs (Houk 1986, Steel and Henchman 1998). Employing signal averaging techniques, the entire amu range (2-260 amu) can be scanned 100 times in about 3 minutes to obtain a robust full spectral scan.
Quadrupole Mass Filter In More Detail
A quadrupole consists of four parallel poles, or rods, two that obtain a net negative charge and two that obtain a net positive charge (Figs 5-6). The polarity and strength of the electromagnetic field achieved by each set of opposing rods results from the simultaneous application of DC and RF (AC) voltages, which can be increased or decreased, but are always maintained in a fixed ratio (typically on the order of 1:6). The applied DC voltages are constant but of opposite polarity – one rod set positive, the other negative. Meanwhile, the applied RF current alternates between positive and negative polarity in the range of 2-3 MHz, with the polarity alternations maintained exactly out-of-phase between the opposing rod sets (Fig 6). In other words, while one set of opposing rods has an applied positive RF potential, the other set has an equally applied but negative RF potential. It is when the magnitude of the RF polarity field strength exceeds that of the oppositely applied DC polarity field strength that a given set of opposing rods obtains its effective net polarity, which then affects ion paths as a function of their inertial masses. Ion trajectories are ultimately governed by both sets of rods, but are more easily understood in terms of the local electrostatic field between a given rod set. In this simplification, one set acts as a high-pass filter (high masses stable through the quad). The other acts as a low-pass filter (low masses stable through the quad).
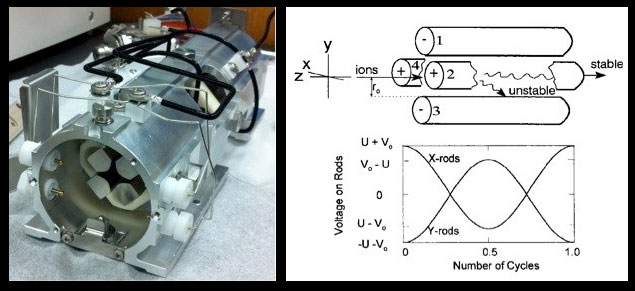
Figure 5 (Left). View of front end of a quadrupole mass analyzer removed from an Agilent 7500ce ICP-Q-MS showing hyperbolic cross section Mo rods. Black wires on the external housing supply opposing rod sets with applied RF and DC potentials. Rods are ~20 cm in length. Figure 6 (Right). From Steel and Henchman (1998): Upper diagram shows basic configuration of a quadrupole and possible (spiral) ion flight paths for a given RF/DC. Lower diagram shows how the voltage potentials applied to opposing rod sets vary through one RF cycle. U is the unchanging DC potential; V is the variable RF (AC) potential.
High Pass Condition: When opposing rods obtain an overriding positive polarity field (Fig 6, rods 2 and 4 above), a massive ion passes through the entire length of quadrupole, whereas a less massive ion is sufficiently attracted by the negative pulses of the applied RF such that its trajectory ultimately collides with a rod.
Low Pass Condition: When the opposing rods obtain an overriding negative polarity field (Fig 6, rods 1 and 3 above) a large ion is initially accelerated toward a negative pole and subsequent positive pulses of the applied RF current are insufficient to thwart an eventual collision/neutralization trajectory. Simultaneously, smaller ions are sufficiently attracted by the alternating positive and negative RF polarity pulses to maintain a stable path through the length of the quadrupole.
Because the two sets of rods operate simultaneously and the RF component on each set is out-of-phase, the resulting magnetic field changes dynamically with each successive RF cycle such that ion trajectories actually spiral as they move through the quadrupole. The opposing rods also simultaneously act as a high and low pass filter with respect to a single m/z, as specified by the imposed DC/RF current. The number of RF cycles affecting ion trajectories depends on the length of the quadrupole rods, the frequency of AC, and the mass (velocity) of the ion. For example, a massive ion (e.g., 200 amu) with flight time of 25 µs through an 11-cm long quadrupole, experiences about 50 RF cycles (Steel and Henchman, 1998). The specific ratio of DC to RF current is optimized, during routine (daily) calibration of the instrument, to achieve resolution below 1 amu (usually ~0.7 amu) while centered at peak ion sensitivity throughout the entire amu range (2-260).
III. Removal of Interferences
Mass interferences on a given mass-to-charge-ratio (m/z) are possible due to the presence of isobars (e.g. 204Hg, 204Pb), polyatomic/molecular species (e.g., 40Ar16O vs 56Fe, 40Ar:40Ar vs. 80Se) formed by various recombinations of sample, matrix and Ar ions in cooler parts of the plasma, and doubly charged species (e.g., 138Ba2+ vs. 69Ga+), also formed in the plasma. A key reason why modern ICP-Q-MS is so effective for quantitative elemental analysis is that these interferences can now be eliminated or substantially reduced by a combination of optimizing plasma characteristics, selection of alternative uninterfered isotopes, use of interference equations, and/or use of collision-reaction cell (CRC) technology.
CRC technology is an especially significant advancement whereby polyatomic interferences are reduced or eliminated by passing the ion beam, prior to reaching the quadrupole mass filter, through a cell that can be pressurized with either an inert collision gas (e.g. He) or a reactive gas (e.g., H2, NH3, O2). The polyatomic interferences are attenuated or eliminated by kinetic energy discrimination (larger polyatomics undergo more energy dampening collisions than analyte ions, lose energy, and thus do not pass through the cell) or interact with a reactive gas to form species with m/z different from that of the analyte ions. Multiple modes, using collision, reaction, or neither (no gas), can be used during an analytical session to achieve virtually interference free results on analytes throughout most of the periodic table.
ICP-Q-MS Applications
The main purpose of Q-ICP-MS is to determine high quality (precise and accurate) elemental concentrations of various materials. Owing to its high sample throughput capabilities and wide range of detection and elemental coverage, ICP-Q-MS is routinely used for the elemental analysis of geological, environmental, chemical, biological, industrial, semi-conductor, metallurgical, petrochemical, medical, forensic, nuclear, and archaeological samples.
A few examples of materials analyzed by category include:
- Geological – trace elements in rocks, mineral separates, sediments, soils, soil leachates, fossils
- Environmental – heavy metals/toxins in surface and ground waters (fresh to saline), sediment extracts, waste, fish bone and tissue, bivalve carbonate/tissue, vegetation digests
- Medical – trace metal contents in bone/tissue/food/urine/blood
- Biological – metal contents of proteins/enzymes
- Archaeological – trace elements in bone, ceramic, or other artifacts
Strengths and Weaknesses of ICP-Q-MS
Strengths
- Wide elemental coverage – most elements with 1st ionization potentials below that of Ar can be analyzed by ICP-Q-MS
- High sensitivity
- Wide analytical working range for solution mode – up to nine (9) orders of magnitude in a single acquisition; from single ppt to 100s of ppm
- Fast quantitative and semi-quantitative analysis times – with high speed scanning quadrupole analyzer, a full elemental suite in a sample can be analyzed in about four (4) minutes
- Good precision and accuracy (~1-3% for solution mode; ~1-10% for laser mode)
- Good control of interferences (isobaric, polyatomic, doubly-charged species) through advances in plasma optimization, ion focusing, and collision-reaction cell technology
- Liquid and solid sample introduction systems
- Relatively small sample volumes required (typically 1-3 mL for solution mode)
- Capable of isotope ratio measurement
- Excellent chromatographic detector – to determine chemical form (speciation) in a sample
Limitations
- Limited total dissolved solids (TDS) tolerance, which can affect instrument stability if deposits accumulate on nebulizer, cones, or lens components, as well as ionization consistency (matrix effects) in the plasma compared to lower TDS samples/standards
. . . . . . . . . . However, nebullizer type (Babington) and high matrix introduction systems can greatly extend tolerance. - Impractical to generate high precision (low RSD) data for brief transient peaks (e.g., vs. ICP-TOF-MS).
- Impractical to generate high precision isotope ratios (e.g., vs. TIMS or ICP-MC-MS) due to: (1) “flicker” noise associated with sample introduction, including fluctuations associated with the peristaltic pump, nebulizer, and plasma, and “shot noise” associated with undesirable photons, electrons, and ions hitting the detector; and (2) the fact that a scanning quadrupole cannot simultaneously measure internal standard and all analyte isotopes for optimal drift compensation. The latter limits precision compared to multicollector systems (by a factor of ~10).
- Analysis speed and sample throughput can be limited by quadupole scanning rates (a consideration mainly for precision of isotope ratio measurements or measurement of very fast transient signals) and wash-out time required for rinsing between samples and introduction of new samples
- Spectral resolution (0.7-1.0 amu) for ICP-Q-MS systems are inadequate for discrete measurement of elements prone to Ar-, solvent- and/or sample-based spectral interferences . . . . . . . . . However, collision-reaction cell systems render this problem as minor for trace element determinations.
- Destructive technique
ICP-Q-MS Users Guide – Sample Collection and Preparation
No Particles: Samples for solution mode ICP-Q-MS should be particulate free in order to prevent clogging of sample tubing and the nebulizer capillaries (particularly for concentric and micro-concentric types). Samples containing solids (even nanoparticles) will not ionize the same way as liquid samples, and thus can negatively affect quantitative analysis. Particles may be removed by filtration or by centrifugation and decanting.
Dilute Samples in 1-2% Nitric Acid: Sample solutions should ideally share a matrix similar to calibration standards. Commercially available single and multielement standards often have matrices comprised of 1-5% nitric acid. Acidification prevents dissolved species from readily sorbing onto tubing and container walls. Nitric acid is preferred because it generates fewer polyatomic interferences compared to other acids.
Dilute Samples to <<< 0.2 wt% (2000 ppm; preferably ≤200 ppm) Total Dissolved Solids: It is important to limit total dissolved sample contents in order to minimize matrix effects that can affect the consistency of ionization in the plasma as well as focusing and collimation of the ion beam beyond the interface region of the ICP-Q-MS. Dilution is also important to ensure that measurement conditions remain consistent throughout the analytical session. Analysis of high TDS samples can rapidly deposit coatings onto sampler and skimmer cones that change orifice shapes and flow dynamics. Such deposits can also constitute a contamination source if partially ionized during subsequent analyses.
Plan Quality Control in Advance: Quality control statistics typically derive from analyses of method blanks, matrix spikes, and certified reference materials of known concentration. Method (or procedural) blanks, sample processed identically to real samples except that no sample is actually added, provide a measure of all processing-related contamination (airborne, reagents/acids, labware, personal) that could potentially contribute to measured concentrations. Matrix spikes (discussed further below) provide a means of evaluating the extent to which quantitative results may suffer as a result of matrix differences between samples and calibrations standards. Quality control standards are often analyzed periodically throughout a run of unknowns. Accuracy and precision obtainable by the data acquisition method can be evaluated from recoveries and standard deviations relative to certified concentrations. Reference standards should be independently sourced from stocks used for calibration standards.
ICP-Q-MS Data Collection, Results and Presentation
ICP-Q-MS raw data, in the form of counts per second (cps) may be collected by continuous scanning of the quadrupole over all or portions of the AMU range, or by discrete peak-hopping for each m/z of interest. Continuous scanning mode produces a spectra of signal intensity (y) versus mass (x) that is may be used to evaluate signal peak shapes (to evaluate abundance sensitivity) or for qualitative identification of elements or interferences in a sample. Elemental identities are confirmed when all measured isotopes of an element have relative abundances matching natural isotopic abundances of an element. Peak-hopping mode is used for quantitative and semi-quantitative measurements of a sequence of pre-selected analyte isotopes, and involves ion signal measurement at each m/z peak position over a dwell time sufficient to obtain robust (low RSD) counting statistics (often 10 to 100 ms).
Detection Limits: Limits of detection have various operational definitions, which are particularly mandated for purposes of quality assurance for data acquired for regulatory agencies. Calculations are typically based on the level of statistical variance (standard deviation) obtained on a population (n) of replicate measurements of the analytical blank, assuming a gaussian distribution and specified uncertainty level (e.g., 95% confidence interval). The student t-test provides a corresponding factor for multiplying statistical variance and deriving a quantitative estimate of the minimal detectable concentration (e.g., at the 95% confidence level) above background. The t-factor is close to 2.3 for a population of 10 replicates, and often detection limits are conservatively assigned as 3 x stdev.
External Calibration: Quantitative elemental determinations by ICP-Q-MS typically involve the conversion of signal intensities (cps) into concentration units based on extrapolations from measurements of an analytical blank and one or more calibration standards of known concentration that are obtained in the same analytical run from identical operating parameters. The blank and external standards typically define highly linear (r ≥ 0.9999) regressions for each analyte, thereby relating signal intensity to concentration. The extrapolation process is highly accurate, provided matrix differences between unknowns and calibration standards are insufficient to variably affect ionization efficiency in the plasma and subsequent extraction of the ion beam. The conversion from cps intensities to concentrations, extrapolated from regressions on calibration standards, is typically performed automatically by data acquisition software, usually after drift compensation (see below).
Accuracy: Accuracy is usually evaluated from analysis of independently sourced quality control standards of known concentration, in matrices similar to the unknowns and calibration standards. Accuracies (and precisions) for most elements are typically on the order of 1-3% for solution mode and 1-10% for laser ablation.
Precision: Precision, or degree of analytical variability, is estimated by variance (standard deviation) associated with replicate analyses of standards and unknowns. in-run precision corresponds to consecutive replicates. Intra-run precision corresponds to variance associated with the population of all replicates interspersed within an analytical run. Extra-run precision corresponds to variance for replicate populations in different analytical runs. Often some level of precision is built into analytical methods for data acquisition. For example the quadrupole may acquire data for multiple dwell time intervals, then report the mean and standard deviation of the measured intervals. The latter, once converted to concentration equivalents, provides a measure of quantitative uncertainty associated with the sample analysis.
Matrix Effects: The possibility of non-quantitative matrix effects for unknowns can be evaluated from measurement of unknowns relative to an aliquot that has been spiked with known concentrations of analytes. Matrix effects are most likely for high TDS samples, so if spiked analyte recoveries are close to 100% on highest concentration unknowns, matrix effects are unlikely for lower concentration unknowns. Non-quantitative spike recoveries indicate matrix effects, which may be reduced to tolerable levels by further dilution (to better matrix match calibration standards) or by using the method of standard additions for calibration.
Standard Addition: When unknown matrix incompatibilities cannot be reduced by dilution, for example when analyte concentrations occur at very low concentrations in complex samples (e.g., trace metals in digested tissue or brines), aliquots of unknowns can be spiked with known amounts of the analyte(s) of interest and measured relative to the unspiked unknown. The small spike additions have negligible effects on the original sample matrix so measurement of analyte signals occurs with the same overall efficiency. The resulting measured intensities define a linear relationship corresponding to the concentration of spike additions that extrapolates to a negative concentration for the unspiked unknown (“blank”). The absolute value of this concentration corresponds to the analyte concentration in the unspiked unknown.
Isotope Dilution: Isotope dilution, wherein a sample is spiked with an artificially enriched isotope solution of known composition and then all analyte isotope are measured, provides another means for quantitative extrapolation of concentration. By this approach, spike introduced changes to the expected natural abundance distribution are used to correct for analyte concentration in the unspiked sample.
Drift Compensation: Modern ICP-Q-MS systems drift slowly during extended analytical runs as integrated components associated with interface and ion lens system change in terms of their geometries (deposits on cones) and electrical properties (lenses, quadrupole), often lowering signal intensities. These temporal variations require correction in order to ensure high quality quantitative data throughout the analytical session. Drift correction is most often achieved by adding single concentration internal standard analytes to all samples and standards prior to measurement, often by continous online mixing of an internal standard solution during sample introduction. Internal standards are ideally uninterfered isotopic species that do not occur in samples or standards. They are selected to span the measured portion of the AMU spectrum and have first ionization potentials comparable to the analyte elements. Some commonly employed internal standard isotopes include 9Be, 45Sc, 89Y, 103Rh, 115In and 209Bi. Sample analyte intensities are normalized according to the factor necessary to restore an assigned internal standard analyte intensity to its initial value at the start of the analytical run (e.g., during measurement of the calibration blank). Data acquisition software typically performs drift corrections automatically prior to reporting intensities and corresponding concentrations.
Data Filtering: Corrected analyte concentrations need to be evaluated relative to detection limits and the range of the calibration standards. Concentrations below detection limits can only be reported as such. Measured concentrations should ideally be bracketed by calibration standards and those exceeding the high concentration linear range may not be quantitative.
Compensation for Dilution Factor: Samples typically need some level of dilution to reduce TDS levels appropriately and bring analyte concentration into the practical measurement range (ppt to 10’s of ppm). The measured concentrations need to be multiplied by the appropriate dilution factor to obtain analyte concentrations in the undiluted sample.
Literature
Douglas, D.J. and Tanner, S.D., 1998. Fundamental considerations in ICPMS. In: Montaser A. ed.: Inductively coupled plasma mass spectrometry. Wiley-WCH, New York, 615-679.
Hongsen Niu, R.S. Houk, 1996. Fundamental aspects of ion extraction in inductively coupled plasma mass spectrometry, Spectrochimica Acta Part B: Atomic Spectroscopy 51, 779-815.
Houk, R.S., 1986. Mass spectrometry of inductively coupled plasmas. Analytical Chemistry 58, 95-105A.
Ma, FM and Taylor, S., 1996. Simulation of ion trajectories through the mass filter of a quadrupole mass spectrometer. IEE Proc.-Sci. Meas. Technol. 143, 71-76.
Steel, C. and Henchman, M., 1998. Understanding the Quadrupole Mass Filter through Computer Simulation. Journal of Chemical Education 75, 1049-1054.
Thomas, R., 2008. Practical guide to ICP-MS – a tutorial for beginners (2nd Ed) CRC Press, Boca Raton, Florida. 347p.
Wolf, R., 2005. http://minerals.cr.usgs.gov/icpms/intro.html
Related Links
A Beginner’s Guide to ICP-MS – 14 article series by Robert Thomas in Spectroscopy Online
- A Beginner’s Guide to ICP-MS
- The Sample Introduction System
- The Plasma Source
- The Interface Region
- The Ion Focusing System
- The Mass Analyzer
- Mass Separation Devices – Double-Focusing Magnetic-Sector Technology
- Mass Analyzers – Time-of-Flight Technology
- Mass Analyzers – Collision/Reaction Cell Technology
- Detectors
- Peak Measurement Protocol
- A Review of Interferences
- Sampling Accessories
- Sampling Accessories, Part II
Teaching Activities and Resources
Stay tuned . . .

