Results
Both nodules had much higher trace element concentrations in dull luminosity regions than in bright luminosity regions. Boron-11 is used because it is consistently measured to be at higher concentrations than boron-10. For most elements, the dull luminosity region elemental concentrations are at least an order of magnitude higher:
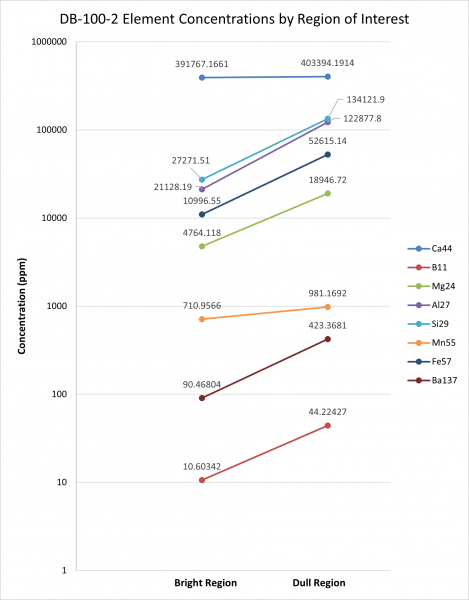
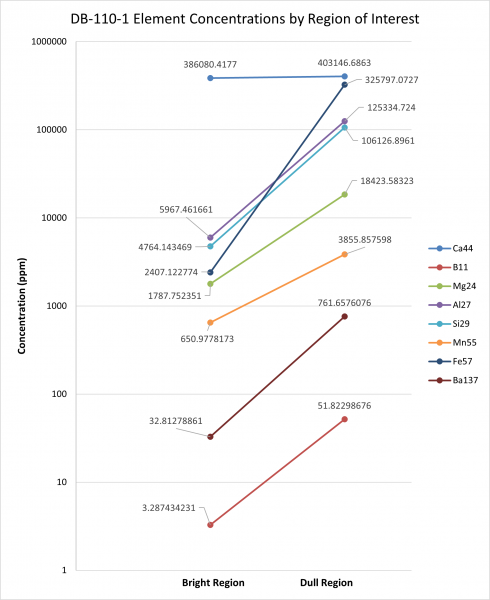
Fig. 6a, 6b: Comparing the element concentrations found in bright and dull regions of interest in DB-100-2 and DB-110-1, respectively.
Boron has the lowest mean concentration for the trace elements measured. The aluminum and silicon concentrations rise in tandem for both nodules, which makes sense because they are chemically linked to one another in aluminosilicates. Boron is known to be closely associated with aluminosilicates (Goldberg et al., 1985), and B-11 is plotted against Al-27 and Si-29 here to see whether this association is more pronounced in the bright or dull luminescence regions:
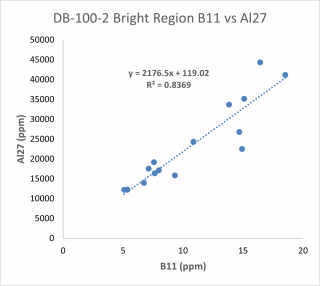
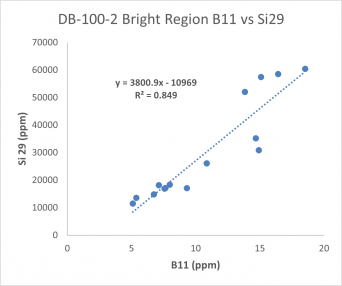
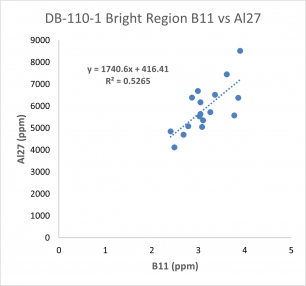
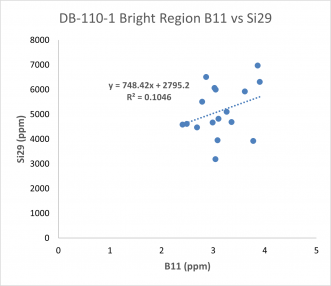
Fig. 7a, 7b, 7c, 7d: B-11 concentrations for DB-100-2 and DB-110-1 plotted against Al-27 and Si-29 to determine how well boron is associated with aluminosilicates in bright regions.
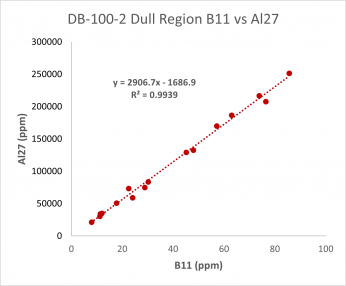
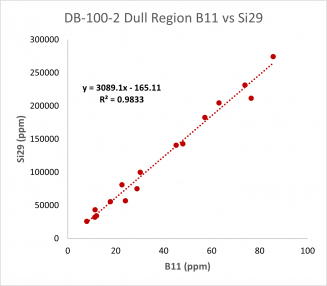
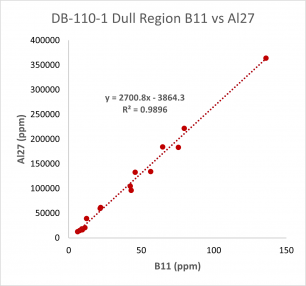
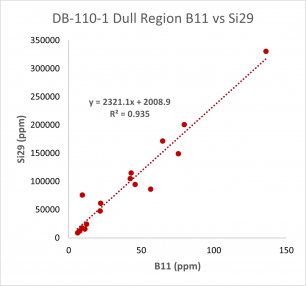
Fig. 8a, 8b, 8c, 8d: B-11 concentrations for DB-100-2 and DB-110-1 plotted against Al-27 and Si-29 to determine how well boron is associated with aluminosilicates in dull regions.
The consistently high R-squared values for the dull regions indicate that boron is most closely associated with aluminosilicates at that luminosity. Given the higher concentration of aluminum and silicon in dull regions, it makes sense that the parallel increase in boron concentration would result from boron in the aluminosilicate structure. More aluminum and more silicon in turn results in more associated boron. Conversely, the lower R-squared values for the brighter regions indicate that although some boron is associated with aluminosilicates, more of the boron in those regions may be found incorporated into the calcite crystal structure. Because there is little aluminum in the calcite lattice, if the B-11 and Al-27 axes are flipped and x is set to 0, the y intercept will give an indication of the boron concentration in the calcite itself: 1.7 ppm B for the bright region of DB-100-2, and 1.4 ppm B for the bright region of DB-110-1. These low B concentrations in the bright regions of both nodules where there is low aluminosilicate concentration are represented in the following 3D visualizations, in which Al-27 ppm is represented by height and B-11 is represented by color:
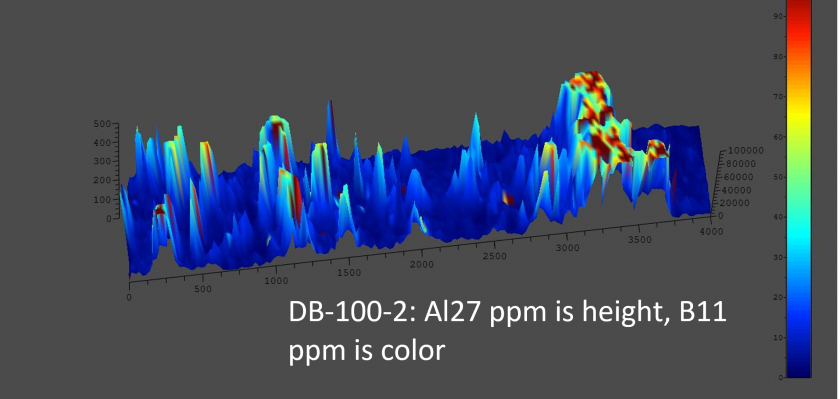
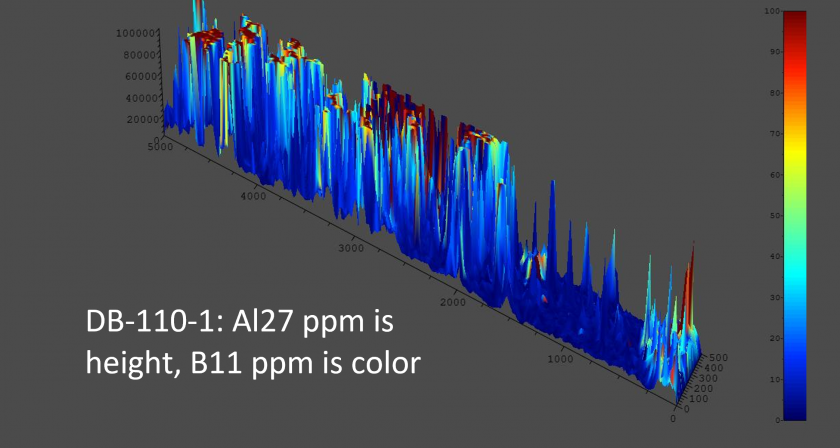
Fig. 9a, 9b: 3D visualizations of the association between boron and aluminosilicates
Knowing where is best to sample for the pH-dependent boron incorporation into the calcium carbonate structure is key for the development of the boron proxy, and these results indicate that sampling the brightest regions of calcite for this purpose is better than sampling dull regions. Although the boron concentration is significantly lower than the dull regions, it is more likely to be associated with calcite lattices.