Methodology
Elemental variations through soil carbonate nodules collected from the San Bernard National Wildlife Refuge, TX, were measured by LA-ICP-MS in two consecutive daily sessions (November 13-14, 2023) at the University of Texas at Austin Department of Earth and Planetary Sciences, using an ESI NWR193 excimer laser ablation system (193nm, 4ns pulse width) coupled to an Agilent 7500ce ICP-MS. The LA-ICP-MS system is equipped with a large format, two-volume, sample cell with fast washout (<1s) that accommodated all samples and standards in a single cell loading. The system was optimized daily for sensitivity across the AMU mass range and low oxide production (ThO/Th: 0.244%) by tuning on a standard (NIST 612), and these parameters checked from trial transections on representative specimens. Data was collected for one higher resolution (DB-110-1) and three lower resolution (DB-100-2, DB-120-2, DB-120-5) 2D maps. The higher resolution imaged area involved contiguous line traverses using a 10×10μm aperture spaced by diameter, whereas the lower resolution imaged areas used a 25×25μm aperture. Following pre-ablation (100×100μm aperture, 50μm/s scan rate, 3.22 J/cm2 fluence), transects were run over pre-determined soil carbonate map areas using a 70μm/s scan rate, 6.88J/cm2 fluence, 50Hz repetition rate, and carrier gas flows of 0.8L/min He and 0.9L/min Ar to create the low-resolution maps. The scan rate of 70μm/s was set to provide two quadrupole measurement cycle per aperture footprint. Baseline intensities were determined from 3s gas blank measurements (plus stage travel time) prior to each transect ablation. The quadrupole method used for mapping surveyed eight elements with10ms (24-25Mg, 27Al, 29Si, 43-44Ca, 55Mn, 57Fe), 25ms (137-138Ba), and 100ms (10-11B) integration times and a duty cycle of 0.3532s that corresponds with 93% measurement time. USGS MACS-3 (synthetic aragonite) was used as the primary calibration standard and NIST 612 as an external reference standard. NIST 612 standard recoveries for all maps were typically within 7% of certified reference values. One high resolution and one low resolution image conversion was performed using iolite4 software (Paton et al., 2011) for the purposes of this project, with the following global variables assigned:
Alignment: Justify
Map style: Raster
Gradient: Jet
Scale bar: Bottom Right, Half Bar
Scale type: Linear
Map Sizes (μm)/ and Range Limits (ppm)
| Sample Name | Width | Height | Mg | Al | Ca | Mn | Si | Fe | Ba | B |
| DB-100-2 | 4000 | 500 | 0-50,000 | 0-100,000 | 0-400,000 | 0-2,000 | 0-100,000 | 0-50,000 | 0-1,000 | 0-100 |
| DB-110-1 | 500 | 5000 | 0-50,000 | 0-100,000 | 0-400,000 | 0-2,000 | 0-100,000 | 0-50,000 | 0-1,000 | 0-100 |
Visibly bright and dull areas in the map area of each soil carbonate nodule were marked as regions of interest (ROI) and profiled in iolite4. The areas and profiles of the bright and dull ROI made to have the same shape and area, and average ppm values for each element were calculated using the stats inspector tool. These average ppm values and profile data were exported to Microsoft Excel to make graphs comparing the element concentrations as a function of luminosity.
Below are the reflected light and cathodoluminescence images used to determine an appropriate map area:
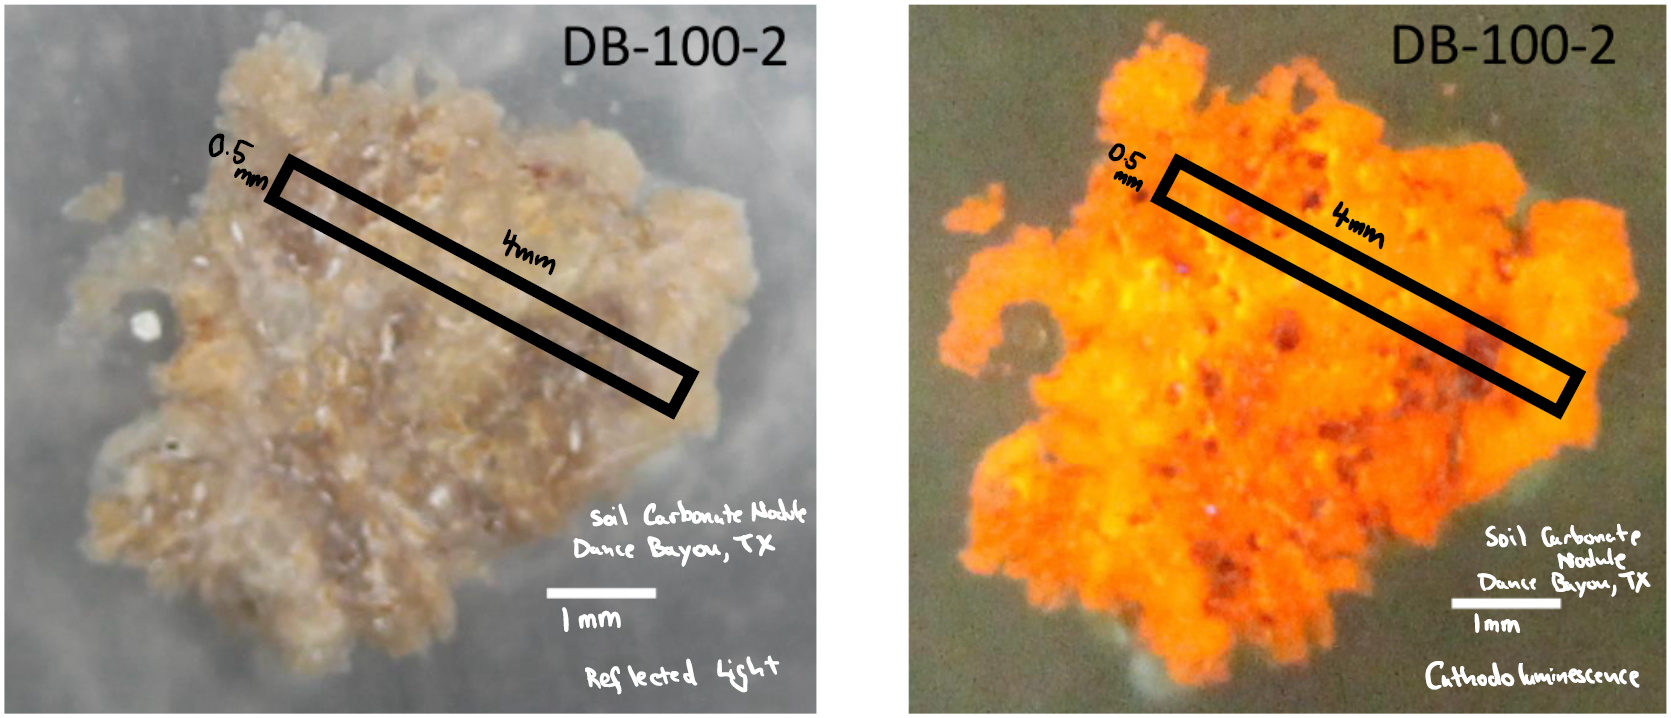
Fig. 2: Reflected light and cathodoluminescence imaging of soil carbonate nodule DB-100-2
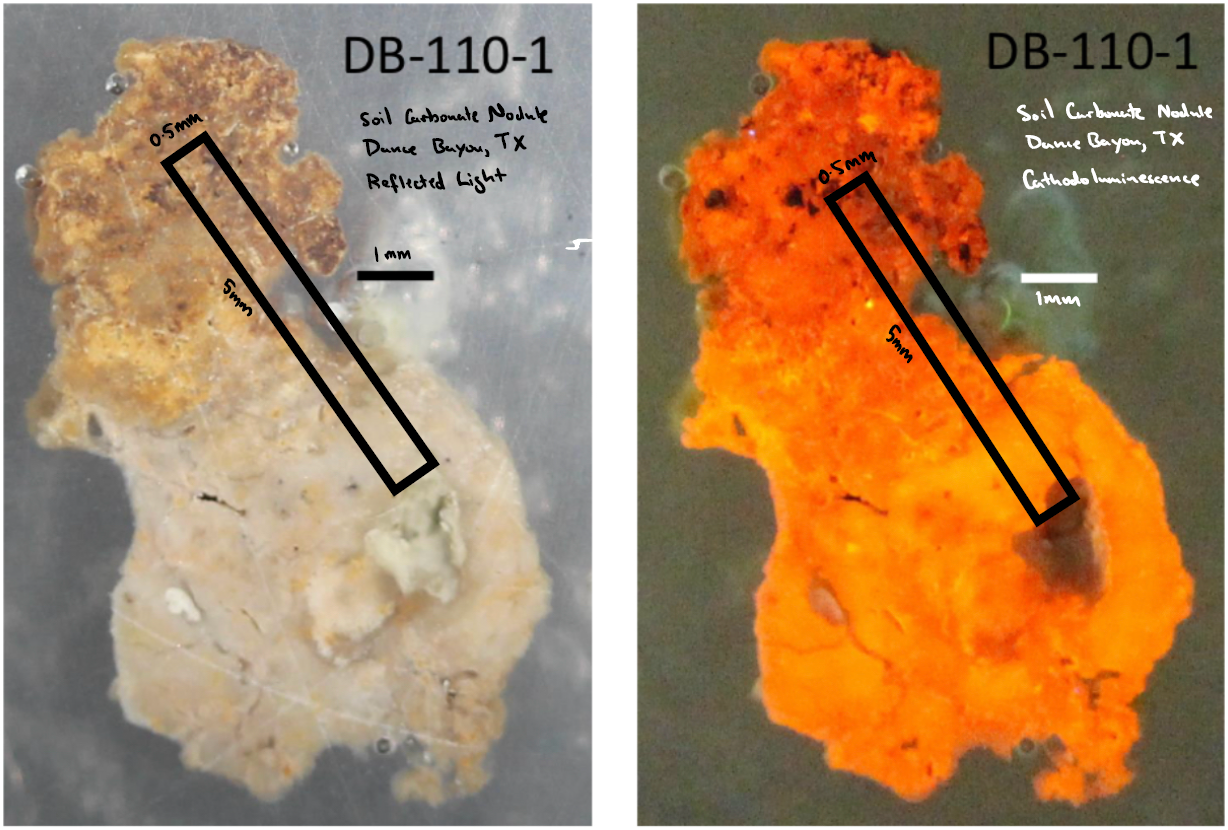
Fig. 3: Reflected light and cathodoluminescence imaging of soil carbonate nodule DB-110-1
The reflected light image was used to define bright and dull regions on the 2D maps for both nodules. ROIs were used to determine the mean value for trace elements in the bright and dull regions, and profiles were made for both luminosities to determine trace element regressions. DB-100-2 is shown here as an example:
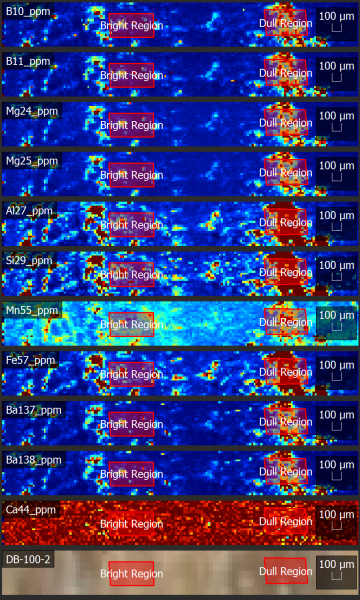
Fig. 4: Bright and dull regions of interest drawn onto 2D maps of elemental concentrations for DB-100-2
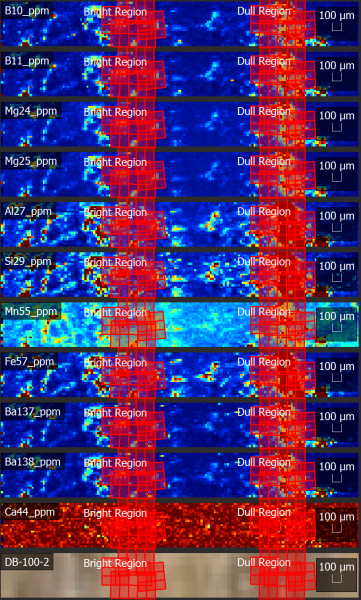
Fig. 5: Profiles drawn on top of the bright and dull regions of interest to perform trace element regressions for DB-100-2.
Quality Assurance/Quality Control:
DB-100-2:
C_MACS-3:
| Channel | Element | Measured | Accepted | % Diff | Variation (%RSD) | Minimum | Maximum | < LOD | Calibrant |
| B10_ppm | B | 8.64943 | 8.2 | 5.48 | 18.42 | 8.12505 | 9.97496 | No | MACS-3 |
| B11_ppm | B | 8.50614 | 8.2 | 3.73 | 12.22 | 7.92413 | 9.07547 | No | MACS-3 |
| Mg24_ppm | Mg | 1722.39 | 1720 | 0.14 | 5.09 | 1664.23 | 1787.53 | No | MACS-3 |
| Mg25_ppm | Mg | 1721.75 | 1720 | 0.10 | 2.21 | 1698.27 | 1744.34 | No | MACS-3 |
| Al27_ppm | Al | 405.306 | 396 | 2.35 | 10.04 | 387.991 | 438.976 | No | MACS-3 |
| Si29_ppm | Si | 408.087 | 400 | 2.02 | 14.61 | 376.792 | 452.746 | No | MACS-3 |
| Ca44_ppm | Ca | 376486 | 376900 | -0.11 | 3.69 | 369125 | 384088 | No | MACS-3 |
| Mn55_ppm | Mn | 512.341 | 512 | 0.07 | 2.08 | 504.374 | 519.203 | No | MACS-3 |
| Fe57_ppm | Fe | 10504 | 10500 | 0.04 | 0.84 | 10450.9 | 10561.2 | No | MACS-3 |
| Ba137_ppm | Ba | 59.5544 | 59.6 | -0.08 | 1.64 | 58.7805 | 59.9558 | No | MACS-3 |
| Ba138_ppm | Ba | 59.6198 | 59.6 | 0.03 | 0.44 | 59.4815 | 59.7767 | No | MACS-3 |
| Sum of Abs % Diffs | 14.1516 |
G_NIST612:
| Channel | Element | Measured | Accepted | % Diff | Variation (%RSD) | Minimum | Maximum | < LOD | Calibrant |
| B10_ppm | B | 13.9171 | 34.3 | -59.43 | 13.26 | 12.7209 | 14.9723 | No | MACS-3 |
| B11_ppm | B | 13.7561 | 34.3 | -59.89 | 4.68 | 13.3773 | 14.2942 | No | MACS-3 |
| Mg24_ppm | Mg | 59.2334 | 68 | -12.89 | 6.22 | 57.2946 | 61.2399 | No | MACS-3 |
| Mg25_ppm | Mg | 58.3916 | 68 | -14.13 | 8.77 | 55.1695 | 61.3622 | No | MACS-3 |
| Al27_ppm | Al | 9931.57 | 11167 | -11.06 | 2.33 | 9768.88 | 10064 | No | MACS-3 |
| Si29_ppm | Si | 131762 | 336061 | -60.79 | 15.53 | 122105 | 142083 | No | MACS-3 |
| Ca44_ppm | Ca | 83449.7 | 85002 | -1.83 | 0.62 | 83140.7 | 83801.1 | No | MACS-3 |
| Mn55_ppm | Mn | 33.9438 | 38.7 | -12.29 | 5.02 | 32.8701 | 35.0092 | No | MACS-3 |
| Fe57_ppm | Fe | 62.8363 | 51 | 23.21 | 9.24 | 59.145 | 66.784 | No | MACS-3 |
| Ba137_ppm | Ba | 31.2037 | 39.3 | -20.60 | 5.51 | 29.8097 | 32.2232 | No | MACS-3 |
| Ba138_ppm | Ba | 31.1977 | 39.3 | -20.62 | 4.79 | 30.3231 | 32.1086 | No | MACS-3 |
| Sum of Abs % Diffs | 296.74 |
DB-110-1:
C_MACS-3:
| Channel | Element | Measured | Accepted | % Diff | Variation (%RSD) | Minimum | Maximum | < LOD | Calibrant |
| B10_ppm | B | 8.72636 | 8.2 | 6.42 | 20.24 | 7.86478 | 9.88773 | No | MACS-3 |
| B11_ppm | B | 8.25142 | 8.2 | 0.63 | 9.70 | 7.84524 | 8.68839 | No | MACS-3 |
| Mg24_ppm | Mg | 1718.81 | 1720 | -0.07 | 2.27 | 1697.41 | 1736.66 | No | MACS-3 |
| Mg25_ppm | Mg | 1724.73 | 1720 | 0.27 | 5.75 | 1672.33 | 1806.36 | No | MACS-3 |
| Al27_ppm | Al | 404.046 | 396 | 2.03 | 14.23 | 382.493 | 451.985 | No | MACS-3 |
| Si29_ppm | Si | 811.855 | 400 | 102.96 | 140.77 | 287.362 | 1586.25 | No | MACS-3 |
| Ca44_ppm | Ca | 376943 | 376900 | 0.01 | 4.41 | 367146 | 384807 | No | MACS-3 |
| Mn55_ppm | Mn | 513.931 | 512 | 0.38 | 5.81 | 496.87 | 537.739 | No | MACS-3 |
| Fe57_ppm | Fe | 10509.6 | 10500 | 0.09 | 9.52 | 9969.24 | 11121.8 | No | MACS-3 |
| Ba137_ppm | Ba | 59.8638 | 59.6 | 0.44 | 3.95 | 58.6423 | 61.4771 | No | MACS-3 |
| Ba138_ppm | Ba | 60.9528 | 59.6 | 2.27 | 10.42 | 59.0515 | 66.5699 | No | MACS-3 |
| Sum of Abs % Diffs | 115.578 |
G_NIST612:
| Channel | Element | Measured | Accepted | % Diff | Variation (%RSD) | Minimum | Maximum | < LOD | Calibrant |
| B10_ppm | B | 15.6266 | 34.3 | -54.44 | 22.59 | 13.7744 | 17.9924 | No | MACS-3 |
| B11_ppm | B | 16.7865 | 34.3 | -51.06 | 18.76 | 15.4637 | 18.5258 | No | MACS-3 |
| Mg24_ppm | Mg | 57.2065 | 68 | -15.87 | 6.19 | 55.6695 | 59.3633 | No | MACS-3 |
| Mg25_ppm | Mg | 55.978 | 68 | -17.68 | 15.00 | 50.9829 | 60.9652 | No | MACS-3 |
| Al27_ppm | Al | 11168.8 | 11167 | 0.02 | 10.09 | 10518 | 11650.1 | No | MACS-3 |
| Si29_ppm | Si | 168169 | 336061 | -49.96 | 99.19 | 76847.6 | 238309 | No | MACS-3 |
| Ca44_ppm | Ca | 83906.6 | 85002 | -1.29 | 2.95 | 82671.5 | 85430.7 | No | MACS-3 |
| Mn55_ppm | Mn | 34.879 | 38.7 | -9.87 | 6.62 | 33.5144 | 36.3429 | No | MACS-3 |
| Fe57_ppm | Fe | 68.1588 | 51 | 33.64 | 15.28 | 61.7321 | 75.5146 | No | MACS-3 |
| Ba137_ppm | Ba | 34.535 | 39.3 | -12.12 | 12.23 | 32.6489 | 37.7602 | No | MACS-3 |
| Ba138_ppm | Ba | 32.4292 | 39.3 | -17.48 | 10.14 | 30.5845 | 33.9429 | No | MACS-3 |
| Sum of Abs % Diffs | 263.443 |