Results
Method Results and Comparisons
 |
 |
 |
 |
|
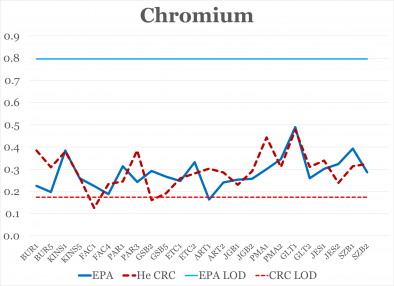
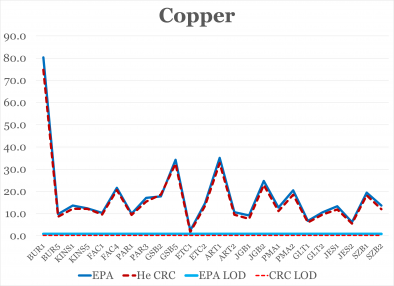
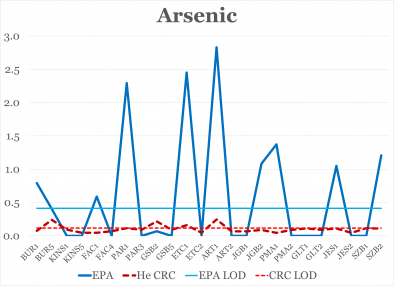
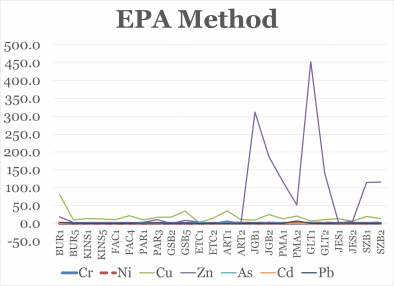
Figures 1-4: Concentrations in ppb of metals. Limits of detection (LOD) are indicated as straight lines. Upper left: Chromium EPA and CRC measurements are about the same on average but only roughly similar from point to point. EPA method readings fall below detection limits. Upper right: Copper EPA and CRC measurements were similar. Lower Left: Arsenic EPA measurements showed higher spikes than CRC measurements. Lower Right: Concentrations of all measured metals according to EPA method. |
|
| EPA and Collision Reaction Cell Comparisons | |||||||||||||
|
Location |
Concentration (ppb) | ||||||||||||
| Cr (52) | Ni (60) | Cu (63) | Zn (66) | As (75) | Cd (106, 108, 111) | Pb (206, 207, 208) | |||||||
| EPA | He CRC | % Diff. | EPA | EPA | He CRC | % Diff. | EPA | EPA | He CRC | % Diff. | EPA | EPA | |
| BUR1 | 0.2 | 0.4 | 52.4 | 0.0 | 80.4 | 74.8 | 7.2 | 18.5 | 0.8 | 0.1 | 165.5 | 0.0 | 3.0 |
| BUR5 | 0.2 | 0.3 | 44.1 | 0.0 | 9.8 | 8.6 | 12.6 | 2.7 | 0.4 | 0.2 | 50.6 | 0.0 | 0.4 |
| KINS1 | 0.4 | 0.4 | 1.4 | 0.0 | 13.6 | 12.2 | 11.1 | 0.6 | 0.0 | 0.1 | 200.0 | 0.0 | 0.0 |
| KINS5 | 0.3 | 0.3 | 1.2 | 0.0 | 12.4 | 12.2 | 1.9 | 0.0 | 0.0 | 0.0 | 200.0 | 0.0 | 0.0 |
| FAC1 | 0.2 | 0.1 | 56.1 | 0.0 | 10.3 | 9.6 | 7.4 | 0.7 | 0.6 | 0.0 | 170.7 | 0.0 | 0.0 |
| FAC4 | 0.2 | 0.2 | 21.6 | 0.0 | 21.6 | 20.6 | 5.1 | 0.0 | 0.0 | 0.1 | 200.0 | 0.0 | 0.0 |
| PAR1 | 0.3 | 0.2 | 24.5 | 0.0 | 10.0 | 9.4 | 5.9 | 3.3 | 2.3 | 0.1 | 181.1 | 0.0 | 0.9 |
| PAR3 | 0.2 | 0.4 | 45.2 | 0.1 | 17.1 | 15.4 | 10.5 | 10.5 | 0.0 | 0.1 | 200.0 | 0.0 | 1.2 |
| GSB2 | 0.3 | 0.2 | 58.0 | 0.0 | 17.8 | 18.6 | 4.3 | 0.0 | 0.1 | 0.2 | 104.0 | 0.0 | 0.0 |
| GSB5 | 0.3 | 0.2 | 33.2 | 0.0 | 34.2 | 32.5 | 5.4 | 8.7 | 0.0 | 0.1 | 200.0 | 0.0 | 0.4 |
| ETC1 | 0.2 | 0.3 | 4.9 | 0.0 | 2.4 | 1.7 | 33.7 | 3.5 | 2.5 | 0.2 | 175.5 | 0.0 | 0.0 |
| ETC2 | 0.3 | 0.3 | 16.4 | 0.2 | 14.6 | 13.5 | 8.5 | 0.0 | 0.0 | 0.0 | 200.0 | 0.0 | 0.0 |
| ART1 | 0.2 | 0.3 | 59.7 | 1.0 | 35.1 | 32.7 | 7.1 | 6.5 | 2.8 | 0.2 | 168.1 | 0.0 | 0.2 |
| ART2 | 0.2 | 0.3 | 17.2 | 0.9 | 10.6 | 9.5 | 11.0 | 0.0 | 0.0 | 0.1 | 200.0 | 0.0 | 0.0 |
| JGB1 | 0.3 | 0.2 | 9.6 | 0.5 | 9.2 | 7.6 | 18.6 | 311.8 | 0.0 | 0.1 | 200.0 | 0.0 | 0.0 |
| JGB2 | 0.3 | 0.3 | 12.4 | 1.1 | 24.7 | 22.8 | 7.8 | 186.9 | 1.1 | 0.1 | 169.7 | 0.0 | 0.0 |
| PMA1 | 0.3 | 0.4 | 38.4 | 0.3 | 12.8 | 11.1 | 13.5 | 117.4 | 1.4 | 0.0 | 187.3 | 0.0 | 0.1 |
| PMA2 | 0.3 | 0.3 | 11.0 | 0.5 | 20.5 | 18.5 | 10.4 | 51.7 | 0.0 | 0.1 | 200.0 | 0.0 | 6.8 |
| GLT1 | 0.5 | 0.5 | 2.5 | 0.6 | 6.7 | 6.0 | 11.1 | 452.8 | 0.0 | 0.1 | 200.0 | 0.0 | 0.0 |
| GLT2 | 0.3 | 0.3 | 18.0 | 0.9 | 10.6 | 9.6 | 9.6 | 139.9 | 0.0 | 0.1 | 200.0 | 0.0 | 0.0 |
| JES1 | 0.3 | 0.3 | 11.7 | 0.2 | 13.3 | 11.9 | 11.7 | 1.0 | 1.0 | 0.1 | 161.7 | 0.0 | 0.8 |
| JES2 | 0.3 | 0.2 | 30.2 | 0.6 | 6.2 | 5.5 | 10.6 | 6.6 | 0.0 | 0.0 | 200.0 | 0.0 | 0.4 |
| SZB1 | 0.4 | 0.3 | 22.4 | 0.4 | 19.5 | 18.2 | 6.6 | 114.6 | 0.0 | 0.1 | 200.0 | 0.0 | 0.0 |
| SZB2 | 0.3 | 0.3 | 12.2 | 1.3 | 13.6 | 12.0 | 12.6 | 115.8 | 1.2 | 0.1 | 167.0 | 0.0 | 0.0 |
| Median | 0.3 | 0.3 | 19.8 | 0.2 | 13.5 | 12.1 | 10.0 | 6.6 | 0.0 | 0.1 | 200.0 | 0.0 | 0.0 |
| Average | 0.3 | 0.3 | 25.2 | 0.4 | 17.8 | 16.4 | 10.2 | 64.7 | 0.6 | 0.1 | 179.2 | 0.0 | 0.6 |
| EPA Limit | 100.0 | 100.0 | 100.0 | 1300.0 | 1300.0 | 5000.0 | 10.0 | 10.0 | 5.0 | 15.0 | |||
| Below Limit? | YES! | YES! | YES! | YES! | YES! | YES! | YES! | YES! | YES! | YES! | |||
Table 6: EPA and Collision Reaction Cell Comparisons. 0.0 indicates a result below 1/10 the limit of detection (LOD). Values below limit of detection are shaded lighter.