Proposal
Summary
Using ICP-MS, we expect to validate drinking water safety at UT Austin. We will test twelve buildings on campus to ensure that water quality is consistent. We will contact the relevant authorities if we find arsenic, lead, cadmium, copper, zinc, nickel, or chromium levels that exceed EPA or ISO guidelines. If we do not find levels exceeding guidelines, we will know that the water is safe for human consumption.
Research Objective
Our primary objective is to test the levels of arsenic, lead, cadmium, copper, zinc, nickel, and chromium in the drinking water at UT Austin. Our secondary objective is to compare the EPA’s interference equation method with the ISO’s collision reaction cell method. Many agencies test and control drinking water standards; our goal is to test the efficiency of these processes to ensure that drinking water on campus is safe for consumption.
Significance
Each of the metals can have severe negative health consequences:
- Arsenic-contaminated water can cause skin and circulatory problems; cancer in the lungs, bladder, skin, kidney, nasal passages, liver, and prostate; pregnancy complications; and reduced cognitive function and premature death in young people (“Drinking Water Contaminants”).
- Prolonged low-dosage lead exposure can lead to a decline in cognitive function, hypertension, other heart conditions, and renal disease (Schwartz & Hu).
- Cadmium can damage the kidneys, skeleton system, and respiratory system, and it can cause cancer (“10 Chemicals of Public Health Concern”).
- Although limited amounts of copper are healthy, excessive copper exposure can lead to liver damage, abdominal pain, nausea, cramps, diarrhea, and vomiting (“Copper: Fact Sheet for Consumers”). Copper may also be linked to Cardiovascular disease and Alzheimer’s disease. It can be especially harmful to people with certain pre-existing conditions.
- Zinc is also healthy in limited amounts (“Zinc: Fact Sheet for Health Professionals.”). However, like copper, excessive consumption can lead to negative health outcomes. These include nausea, dizziness, headaches, gastric distress, vomiting, and loss of appetite. Prolonged excessive zinc consumption can lead to deficiencies in Copper absorption.
- Nickel exposure can cause allergies, cardiovascular and kidney diseases, lung fibrosis, and lung and nasal cancer (Genchi et. al.).
- Certain species of chromium can have harmful effects on the respiratory, skin, renal, gastrointestinal, hepatic, cardiovascular, hematological, reproductive, developmental, genotoxic, and carcinogenic effects (“Chromium (CR) Toxicity: What Are the Physiologic Effects of Chromium Exposure?”).
This project is significant because results exceeding the maximum limits indicate that the UT Austin community is not safe from these health risks and concerns.
Literature Review
We will use the EPA’s Method 200.8 for ICP-MS analysis using interference equations (“EPA Method 200.8: Determination of Trace Elements in Waters and Wastes …”). This analytical method is designed to test for the presence of contaminants in drinking, ground, and surface water. The process can be used for all of the elements we are testing for. The recommended isotopes and elemental equations according to EPA 200.8 are as follows:
| Element | Symbol | Isotope | Elemental Equation |
| Arsenic | As | 75 | (1.000) (⁷⁵C) – (3.127) [(⁷⁷C) – (0.815) (⁸²C)] |
| Lead | Pb | 206, 207, 208 | (1.000)(²⁰⁶C) + (1.000) [(²⁰⁷C) + (1.000) (²⁰⁸C)] |
| Cadmium | Cd | 106, 108, 111, 114 | (1.000) (¹¹¹C) – (1.073) [(¹⁰⁸C) – (0.712) (¹⁰⁶C)] |
| Copper | Cu | 63, 65 | (1.000) (⁶³C) |
| Zinc | Zn | 66, 67, 68 | (1.000) (⁶⁶C) |
| Nickel | Ni | 60, 62 | (1.000) (⁶⁰C) |
| Chromium | Cr | 52, 53 | (1.000) (⁵²C) |
For our analysis of drinking water using collision reaction cells, we will use the ISO’s ISO 17294-2:2023 method (“ISO 17294-2:2023 Water quality – Application of ICP-MS– Part 2: Determination of selected elements including uranium isotopes.”). A previous analysis measured 28 elements in environmental waters, bottled water, and tap water using the ISO 17294-2 method with the Agilent 7850 (Kubota, Tetsuo, and Agilent Technologies, Inc). This paper used the previous version of this method, published in 2016, but it is still a useful guide for conducting our analysis using the current method.
The ISO website offers a table of isotopes often used in water analysis of our listed elements. Our class handout lists common interferences for each of these.
|
Element
|
Symbol
|
Isotope
|
Abundance
|
Common Interferences | ||||||
| Ar | N | O | C | S | P | Cl | ||||
| Arsenic | As | ⁷⁵As | 100 | ³⁶Ar³⁸ArH, ³⁶Ar³⁹K | ⁵⁹Co¹⁶O, ⁵⁸Ni¹⁷O, ⁴³Ca¹⁶O₂, ⁴²Ca¹⁶O¹⁷O, ⁵⁸Fe¹⁷O, ⁵⁷Fe¹⁸O, ⁴⁰Ca¹⁷O¹⁸O | ¹²C³¹P¹⁶O₂ | ⁴⁰Ar³⁵Cl, ³⁸Ar³⁷Cl | |||
|
Lead
|
Pb
|
²⁰⁶Pb | 24.1 | ¹⁹⁰Pt¹⁶O | ||||||
| ²⁰⁷Pb | 22.1 | ¹⁹¹Ir¹⁶O, ¹⁹⁰Pt¹⁷O | ||||||||
| ²⁰⁸Pb | 52.4 | ¹⁰²Pt¹⁶O, ¹⁹¹Ir¹⁷O, ¹⁹⁰Pt¹⁸O | ||||||||
|
Cadmium
|
Cd
|
¹¹¹Cd | 12.8 | ³⁸Ar₂¹⁷O¹⁸O, ³⁸Ar⁴⁰Ar¹⁶O¹⁷O, ³⁶Ar⁴⁰Ar¹⁷O₂ | ³⁹K₂¹⁶O₂H, ⁹⁵Mo¹⁶O, ⁹²Zr¹⁸O, ⁹⁴Zr¹⁶O | |||||
| ¹¹⁴Cd | 28.73 | ³⁸Ar⁴⁰Ar¹⁸O₂, ⁴⁰Ar₂¹⁶O¹⁸O, ⁴⁰Ar₂¹⁷O₂ | ⁹⁸Mo¹⁶O, ⁹⁸Ru¹⁶O | |||||||
|
Copper
|
Cu
|
⁶³Cu | 69.17 | ⁴⁰Ar²³Na, ³⁶Ar¹²C¹⁴NH, ³⁸Ar²⁵Mg | ⁴⁶Ca¹⁶OH, ⁴⁴Ca¹⁸OH, ⁴⁷Ti¹⁶O, ⁴⁶Ti¹⁷O, ⁴⁶Ca¹⁷O, ⁴⁵Sc¹⁸O | ³¹P¹⁶O₂ | ¹²C¹⁶O³⁵Cl, ¹⁴N¹²C³⁷Cl, ²⁶Mg³⁷Cl, ¹³C¹⁵N³⁵Cl | |||
| ⁶⁵Cu | 30.83 | ³⁶Ar¹³C¹⁵NH, ³⁸Ar¹²C¹⁴NH, ³⁶Ar¹⁴N¹⁵N, ³⁶Ar¹³C¹⁶O, ³⁶Ar¹²C¹⁷O, ⁴⁰Ar²⁵Mg | ¹⁴N¹⁶O₂¹⁹F | ⁴⁹Ti¹⁶O, ⁴⁸Ti¹⁷O, ⁴⁷Ti¹⁸O, ⁴⁸Ca¹⁶OH, ⁴⁶Ca¹⁸OH, ⁴⁸Ca¹⁷O | ³²S¹⁶O₂H, ³²S¹⁶O¹⁷O, ³³S¹⁶O₂, ³²S³³S | ³¹P¹⁶O¹⁸O, ³¹P¹⁶O¹⁷OH, ³¹P¹⁷O₂ | ¹²C¹⁸O³⁵Cl, ¹²C¹⁶O³⁷Cl, ¹³C¹⁵N³⁷Cl, ¹³C¹⁷O³⁵Cl | |||
|
Zinc
|
Zn
|
⁶⁴Zn | 48.6 | ⁴⁰Ar²⁴Mg, ³⁶Ar¹⁴N₂, ³⁶Ar¹³C¹⁴NH, ³⁶Ar¹²C¹⁵NH, ³⁶Ar¹²C¹⁶O, ³⁸Ar²⁶Mg | ⁴⁸Ti¹⁶O, ⁴⁸Ca¹⁶O, ⁴⁷Ti¹⁷O, ⁴⁶Ti¹⁸O, ⁴⁶Ca¹⁷OH | ³²S¹⁶O₂, ³²S₂ | ³¹P¹⁶O₂H, ³¹P¹⁶O¹⁷O | ¹²C¹⁷O³⁵Cl, ¹³C¹⁶O³⁵Cl | ||
| ⁶⁶Zn | 27.9 | ³⁸Ar¹³C¹⁴NH, ³⁸Ar¹²C¹⁵NH, ³⁶Ar¹⁵N₂, ³⁸Ar¹⁴N₂, ³⁸Ar¹²C¹⁶O, ³⁶Ar¹²C¹⁸O, ³⁶Ar¹³C¹⁷O, ³⁶Ar¹⁴N¹⁶O, ⁴⁰Ar²⁵Mg | ¹⁵N¹⁶O₂¹⁹F | ⁵⁰Cr¹⁶O, ⁴⁸Ti¹⁸O, ⁴⁹Ti¹⁷O, ⁵⁰Ti¹⁶O, ⁵⁰V¹⁶O, ⁴⁸Ca¹⁸O, ⁴⁸Ca¹⁷OH | ³⁴S¹⁶O₂, ³²S¹⁷O₂, ³²S³⁴S, ³³S¹⁶O¹⁷O, ³³S¹⁶O₂H, ³³S₂, ³²S¹⁶O¹⁸O, ³²S¹⁶O¹⁷OH | ³¹P¹⁶O¹⁸OH, ³¹P¹⁷O¹⁸O, ³¹P¹⁷O₂H | ¹²C¹⁷O³⁷Cl, ¹³C¹⁸O³⁵Cl | |||
| ⁶⁸Zn | 18.8 | ⁴⁰Ar¹⁴N₂, ⁴⁰Ar¹²C¹⁶), ⁴⁰Ar¹³C¹⁴NH, ⁴⁰Ar¹²C¹⁵NH, ³⁸Ar¹⁵N₂, ³⁸Ar¹²C¹⁸O, ³⁸Ar¹³C¹⁷O, ³⁶Ar¹⁴N¹⁸O, ³⁶Ar¹⁵N¹⁷O, ³⁸Ar¹⁴N¹⁶O | ¹⁴N¹⁷O¹⁸O¹⁹F, ¹⁵N¹⁷O₂¹⁹F | ⁵²Cr¹⁶O, ⁵⁰Cr¹⁸O, ⁵⁰Ti¹⁸O, ⁵⁰V¹⁸O, ⁵¹V¹⁷O | ³⁶Ar³²S, ³²S¹⁸O₂, ³³S¹⁷O¹⁸O, ³⁴S₂, ³⁴S¹⁶O¹⁸O, ³⁶S¹⁶O₂, ³⁴S¹⁷O₂, ³²S³⁶S, ³²S¹⁷O¹⁸OH, ³⁴S¹⁶O¹⁷OH, ³³S¹⁶O¹⁸OH, ³³S¹⁷O₂H | ³¹P¹⁸O₂H | ³⁵Cl¹⁶O¹⁷O | |||
|
Nickel
|
Ni
|
⁵⁸Ni | 68.077 | ⁴⁰Ar¹⁸O, ⁴⁰Ar¹⁷OH | ⁴⁰Ca¹⁸O, ⁴⁰Ca¹⁷OH, ⁴²Ca¹⁶O, ⁴⁰K¹⁸O, ⁴¹K¹⁷O | ²³Na³⁵Cl | ||||
| ⁶⁰Ni | 26.223 | ³⁶Ar²⁴Mg | ⁴⁴Ca¹⁶O, ⁴³Ca¹⁶OH, ⁴²Ca¹⁸O, ⁴³Ca¹⁷O, ⁴⁴Ca¹⁶O, ⁴²Ca¹⁷OH, ⁴²Ca¹⁸O, ⁴³Ca¹⁷O | ²³Na³⁷Cl, ²⁵Mg³⁵Cl | ||||||
|
Chromium
|
Cr
|
⁵²Cr | 83.789 | ⁴⁰Ar¹²C, ³⁸Ar¹⁴N, ³⁶Ar¹⁵NH, ³⁶Ar¹⁶O, ³⁸Ar¹³CH | ¹⁵N¹⁸O₂H | ⁴⁰Ar¹²C, ¹²C₄ | ³⁶S¹⁶O, ³⁴S¹⁸O, ³³S¹⁸OH, ³⁴S¹⁷OH, ³⁶S¹⁵NH | ³⁵Cl¹⁶OH, ³⁷Cl¹⁵N, ³⁵Cl¹⁷O, H¹⁴N³⁷Cl | ||
| ⁵³Cr | 9.501 | ⁴⁰Ar¹²CH, ³⁶Ar¹⁷O, ³⁸Ar¹⁵N, ³⁸Ar¹⁴NH, ³⁶Ar¹⁶OH, ⁴⁰Ar¹³C | ⁴⁰Ar¹³C | H³⁶S¹⁶O, ³⁶S¹⁷O, H³⁴S¹⁸O | ³⁵Cl¹⁸O, ³⁷Cl¹⁶O, ³⁵Cl¹⁷OH, H¹⁵N³⁷Cl | |||||
Each sample will need to be diluted so that sodium and calcium levels do not interfere with the machine. According to the EPA method, nitric acid will be used for this dilution. Multielement stock standard solutions may be prepared by diluting 1.0 mL of each single element stock standard to 100 mL with a reagent water containing 1% nitric acid. Stock standard preparation procedures can be found in the EPA 200.8 method.
Materials and Methods
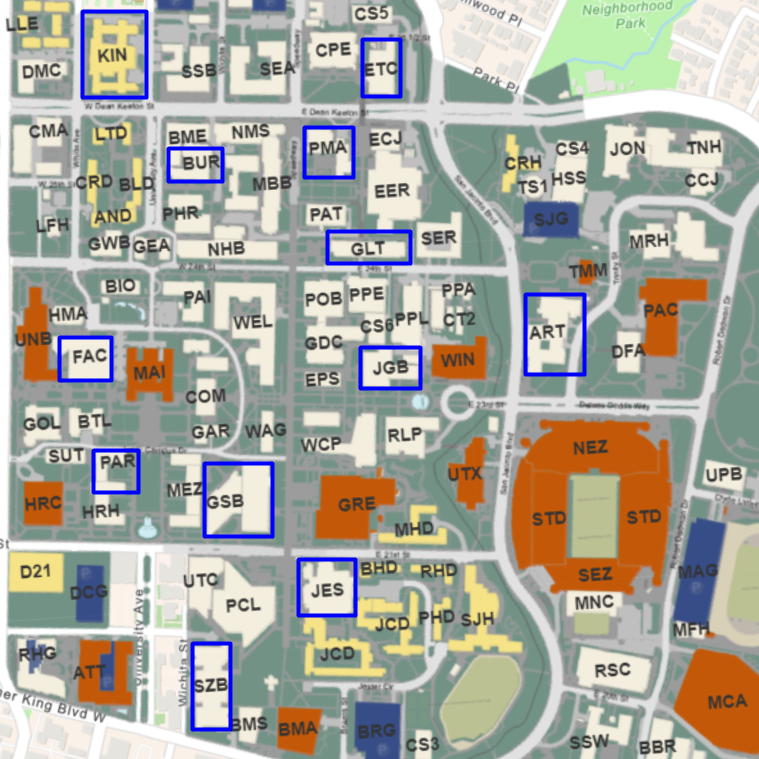
We will collect two samples each from twelve different buildings, at the top and bottom floors. This will help account for variation across campus and variation from floor to floor. We will test the following buildings: ETC, PMA, GLT, JGB, GSB, KIN, FAC, PAR, BUR, ART, SZB, and JES.
We will use inductively coupled plasma mass spectrometry, also known as ICP-MS, to test for contaminants in the water. The water samples will be mixed with stability solutions to create liquid solutions, which will then be tested using ICP-MS technology. We will analyze the data according to the EPA standards for each respective element, using Method 200.8 from the EPA for ICP-MS.
Possible Outcomes: Similar or Different Results
For each metal, the two methods have the potential to show results that are either similar or different.
If they show similar results:
This would indicate that the two methods are both valid and produce relatively similar readings. It would be consistent with the hypothesis that both are good ways to find drinking water safety.
If they show significant differences:
This would indicate a flaw in one or both methods since both need to be sensitive to the listed metals. We could conclude that at least one of the methods is not a good way to measure drinking water safety.
Possible Outcomes: Action
Each metal has the potential to exceed maximum standards or fall within a safe range. The EPA standard is legally enforced in the USA. The ISO, however, does not make enforceable regulations. They can only offer guides and recommendations. This means that the EPA standard is more relevant from a legal perspective, and only the EPA regulations are actionable.
If a metal exceeds maximum EPA standards:
We will immediately contact the University of Texas at Austin Food and Drinking Water Safety Program, which ensures drinking water on campus is safe for consumption. It is their responsibility to test food and drinking water for possible contamination and to notify UT Austin community members of contamination risks. They will take steps to remove the contaminants and protect students and faculty.
If it does NOT exceed maximum standards:
This would indicate that the water meets the EPA water quality standards and is safe for consumption. The methods used to filter and clean the water are effective in removing contaminants.
If a metal exceeds ISO standards but not EPA standards, we can inform the public, but we cannot enforce a change in water purification practices.
Timeframe and Budget
- All samples will be ready to analyze by November 2nd, 2023.
- The final website with all findings will be published by December 7th, 2023.
- We will be testing twelve buildings, with two samples per building for a total of twenty-four samples ($408).
- List of Buildings: JGB, JES, PMA, ETC, GLT, GSB, KIN, FAC, ART, PAR, BUR, and SZB.