Method
Sample Preparation
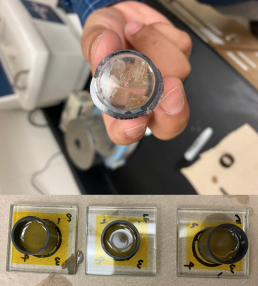
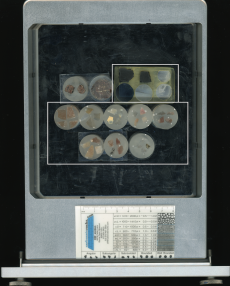
Representative geological samples from each source location were broken by hand to produce small fragments of rock for the analysis. These fragments were placed in 1 inch resin mounts, 4 samples per mount. These mounts were sanded down to ensure a flattened surface and to reveal the samples surfaces.
Samples and NIST standards were then mounted into the laser ablation stage.
|
|
|
Laser Ablation
Initial method development was conducted at the ICPMS laboratory at the University of Texas at Austin. However, due to lack of sufficient laser energy, a high enough fluence value could not be achieved and chert samples could not be ablated. A minimum of 7 J/cm2 was required, only 4.10 J/cm2 (95%) could be achieved.
Chert samples were sent to technicians at Elemental Scientific Lasers (Bozeman, MT) for measurement via LA-ICP-MS. An Agilent 8900 (G3665A) ICP-MS instrument was employed, equipped with an ESL193HE laser ablation platform.
Samples were mounted into the laser chamber on December 1, 2022. Completion of laser ablation occurred on December 1, 2022. Final data reduction using Lolite software (Univ. Melb, Aus) occurred between Dec 2 2022 – Dec 5 2022.
LA-ICP-MS Tuning
Spots were placed using ActiveView2 software. Three spots were placed on each sample, to account for micro-variation in the sample. Care was taken to avoid inclusions or overlap with resin residue.
The following steps were undertaken during the first stage of method development conducted at the University of Texas. First, the H2 tank was changed, laser energy was calibrated and the cell was purged. To set up for pre-ablation, z-positions were adjusted in order to focus on all samples spots and standards. To determine pre-ablation parameters, incremental laser energies (45, 70, 80, 90%) were tests on a spot size of 125 μm to determine which intensity seemed appropriate (=90%). The instrumented was tuned up in solution mode using a pulse/analog calibration. The laser was tuned on a NIST 612 standard, oxide production and fractionation was monitored. Masses ranging the AMU range were monitored (see below).
Tuning Parameters (Uni. Texas)
| Tuning Standard | NIST 612 |
| Monitored Masses | 7, 43, 89, 141, 232, 248/232, 238/232 |
| 141Pr (ppm) | 37.2 |
| 141Pr (cps) | 3364.8 |
| 141PR(%RSD) | 3.04 |
| 141Pr(cps/ppm) | 904.46 |
| 248/232 | 0.313 % |
| 238/232 | 123.813 |
The following tests were conducted on sacrificial sample spots. Test proved unsuccessful at ablating chert samples, it was determined at this stage that a higher fluence variation was required (more than 5 J/cm2).
Testing Parameters (Uni. Texas)
| Parameters | Test 1 | Test 2 |
| Laser energy (%) | 60, 70, 80, 90 | 90 |
| Rep rate (Hz) | 10 | 20, 30, 40, 50 |
| Spot (μm) | 125 | 125 |
| He (mL/min) | 850 | 850 |
| Ar (mL/min) | 650 | 650 |
| Dwell time (s) | 60 | 45 |
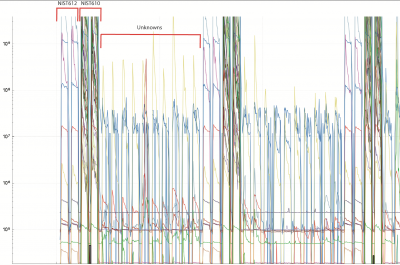
The analytical sequence for laser ablation conducted at Elemental Scientific Lasers (Bozeman, MT) was analyses of NIST 610 and 612 followed up 10 unknowns, sequence repeated until all unknown were analysed.
Pre-ablation and ablation parameters are as follows, both used a laser energy of 43%, fluence variation of 7 J/cm2, rep rate of 5 Hz, spot size of 125 μm, sampling depth of 8 mm for ablation, integration time of 0.1 s, and a dwell time of 1s and 40s for pre-ablation and ablation, respectively.
Final Plasma Conditions (based on tuning at Elemental Scientific Lasers):
| Parameters | Values | Parameters | Values | Parameter | Values |
| RF Power | 1550 W | Extract 1 (Ion Lens) | -20 V | Analog HV (Detector) | 2199 V |
| RF Matching | 1.8 V | Extract 2 (Ion Lens) | -80 V | Pulse HV (Detector) | 967 V |
| Torch-H | -0.2 mm | Omega Bias | -60 V | AMU Gain (Q Pole) | 125 |
| Torch-V | -0.2 mm | Omega Lens | -40 V | AMU Offset (Q Pole) | 126 |
| Carrier Gas | 1.00 L/min | OctP RF | 140 V | Axis Gain | 0.9999 |
| Makeup gas | 0 L/min | OctP Bias | -8 V | Axis Offset | 0.06 |
| Reaction Cell | OFF | Detector Discriminator | 3.3 mV | QP Bias | -5 V |
Total analysis duration time: 2:13:34 hrs
Data Reduction
Time resolved intensities were turned into concentration (ppm) using Iolite software (Univ. Melbourne, Australia), 29Si was used as the internal standard. Calculations for limits of detection were based on Longerich et al. (1996). Reduction of data resulted from fitting baselines for each element, and fitting a spline to standards and unknown values.
Data Quality
Based on comparison between averages of standards run as unknowns and the GeoRem reference values, majority of recoveries were determined to be good. Only analytes between 85Rb and 141Pr showed poor recovery rates (~70%).
Recoveries for NIST 610 as Compared to GeoRem Values (ppm)
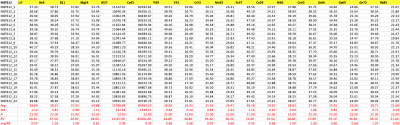
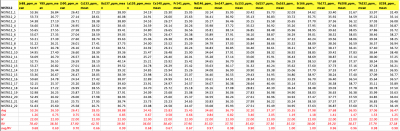
Concentrations, LOD, and Signal-Noise for Unknowns and Standards
| Analytes | Certified Ref. Value | Conc. of NIST612 run as unknown | Std. of NIST612 run as unknown | Recovery Fractions for NIST612 | Elemental concentration in unknowns | LOD for unknowns | Signal to noise | ||
| Max | Min | Median | |||||||
| Li7 | 40.20 | 38.80 | 1.12 | 0.97 | 15.64 | -0.05 | 1.81 | 0.18 | 13.34 |
| Be9 | 37.50 | 38.53 | 0.81 | 1.03 | 0.53 | -0.05 | 0.15 | 0.03 | 4.66 |
| B11 | 34.30 | 37.05 | 0.98 | 1.08 | 85.17 | 9.11 | 49.30 | 1.41 | 31.29 |
| Mg24 | 68.00 | 54.88 | 1.11 | 0.81 | 864.60 | 5.16 | 12.14 | 0.10 | 342.56 |
| Al27 | 11167.00 | 11028.84 | 122.63 | 0.99 | 727.59 | 3.65 | 173.17 | 0.25 | 746.19 |
| Ca43 | 85002.00 | 84560.30 | 1149.51 | 0.99 | 1635.17 | 64.16 | 173.49 | 116.65 | 1.94 |
| Ti49 | 44.00 | 39.06 | 0.84 | 0.89 | 185.75 | 0.05 | 12.80 | 0.32 | 46.78 |
| V51 | 38.80 | 26.43 | 0.44 | 0.68 | 11.35 | 0.09 | 1.79 | 0.01 | 355.05 |
| Cr53 | 36.00 | 35.43 | 0.69 | 0.97 | 24.55 | 0.08 | 3.48 | 0.19 | 23.72 |
| Mn55 | 38.70 | 26.47 | 0.34 | 0.68 | 12.37 | 0.00 | 0.31 | 0.05 | 15.98 |
| Fe57 | 51.00 | 48.58 | 1.16 | 0.95 | 1609.98 | 5.94 | 159.05 | 1.18 | 219.80 |
| Co59 | 35.50 | 24.20 | 0.45 | 0.68 | 0.27 | -0.02 | 0.03 | 0.00 | 10.26 |
| Ni60 | 38.80 | 38.83 | 0.60 | 1.00 | 18.40 | 0.00 | 0.68 | 0.10 | 18.50 |
| Cu63 | 37.80 | 37.84 | 1.08 | 1.00 | 6.56 | 0.06 | 0.55 | 0.05 | 19.85 |
| Zn66 | 39.10 | 35.25 | 0.82 | 0.90 | 6.41 | 0.00 | 0.35 | 0.12 | 4.90 |
| Ga69 | 36.90 | 25.26 | 0.36 | 0.68 | 15.24 | 0.01 | 0.43 | 0.01 | 104.63 |
| Ge72 | 36.10 | 38.71 | 0.71 | 1.07 | 1.01 | -0.30 | 0.24 | 0.13 | 2.41 |
| Rb85 | 31.40 | 21.66 | 0.45 | 0.69 | 0.72 | 0.01 | 0.14 | 0.01 | 16.64 |
| Sr88 | 78.40 | 53.26 | 1.26 | 0.68 | 54.30 | 0.17 | 0.66 | 0.01 | 147.00 |
| Y89 | 38.30 | 26.59 | 0.75 | 0.69 | 4.52 | -0.04 | 0.01 | 0.00 | 45.13 |
| Zr90 | 37.90 | 26.41 | 0.75 | 0.70 | 11.32 | 0.00 | 0.57 | 0.02 | 42.83 |
| Cs133 | 42.70 | 28.05 | 0.56 | 0.66 | 0.13 | -0.04 | 0.00 | 0.01 | 0.97 |
| Ba137 | 39.30 | 38.88 | 0.85 | 0.99 | 2456.39 | 0.07 | 3.16 | 0.30 | 159.92 |
| La139 | 36.00 | 24.45 | 0.67 | 0.68 | 1.98 | -0.03 | 0.01 | 0.00 | 49.16 |
| Ce140 | 38.40 | 25.83 | 0.58 | 0.67 | 2.24 | -0.03 | 0.01 | 0.00 | 38.62 |
| Pr141 | 37.90 | 25.45 | 0.66 | 0.67 | 0.43 | -0.04 | 0.00 | 0.00 | 30.80 |
| Nd146 | 35.50 | 34.60 | 0.84 | 0.97 | 4.69 | 0.00 | 0.20 | 0.01 | 77.33 |
| Sm147 | 37.70 | 36.79 | 0.82 | 0.98 | 0.48 | -0.05 | 0.00 | 0.00 | 17.30 |
| Eu153 | 35.60 | 32.20 | 3.40 | 0.90 | 0.11 | -0.05 | 0.00 | 0.00 | 7.02 |
| Gd157 | 37.30 | 37.37 | 2.05 | 1.00 | 0.58 | -0.04 | 0.00 | 0.01 | 6.64 |
| Dy163 | 35.50 | 35.35 | 1.19 | 1.00 | 0.84 | -0.03 | 0.00 | 0.01 | 4.95 |
| Er166 | 38.00 | 37.98 | 1.18 | 1.00 | 0.63 | -0.05 | 0.00 | 0.00 | 4.53 |
| Yb172 | 39.20 | 37.68 | 1.41 | 0.96 | 0.51 | -0.06 | 0.00 | 0.01 | 3.39 |
| Pb208 | 38.57 | 36.95 | 1.47 | 0.96 | 1.97 | -0.01 | 0.10 | 0.07 | 3.60 |
| Th232 | 37.79 | 37.06 | 1.53 | 0.98 | 0.23 | -0.03 | 0.01 | 0.01 | 2.00 |
| U238 | 37.38 | 36.47 | 1.25 | 0.98 | 12.44 | 0.21 | 1.53 | 0.34 | 6.29 |