
Outreach
There are those who reason well, but they are greatly outnumbered by those who reason badly.
– Galileo Galilei –
Professional Development for High-school teachers using Arduino
OnRamps Professional Learning Institute
One of the most affordable and simplest ways to predict volcanic eruptions is by measuring the slope, or “tilt,” of the ground on the side of a volcano. Tiltmeters are used to monitor subtle changes in inclination that reflect the inflation and deflation of magma chambers underground. To learn more about tilt and monitoring (see the US Geological Survey Volcano Hazards Program).
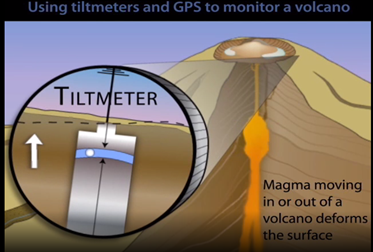
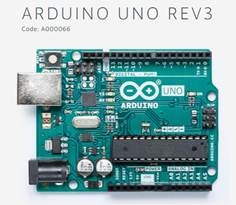
In this workshop, the students build their own tiltmeter using an Arduino UNO microcontroller board and associated sensors. Using a physical model of a volcano, the student measures and records the tilt as the subsurface magma chamber “inflates” and “deflates.” The student will analyze the data with MATLAB, evaluating and interpreting the data by comparison to real, authentic data from Mt. St. Helen’s eruption of 1980.
By the end of the workshop, you will be able to
- Describe and diagram how tilt measurements reflect subsurface igneous processes in volcanic systems;
- Follow and execute a circuit plan to build a tiltmeter on an Arduino board;
- Collect, record and analyze data from a tiltmeter using the MATLAB interface;
- Interpret tilt data in the context of volcanic eruptions;
- Evaluate the reliability of tilt data to anticipate volcanic eruptions;
Research Traineeship Experience (RTX)
Developing a dripping rate data logger
Over the years, RDL members have worked with undergraduate students from the RTX program to develop an instrument to measure droplet dripping rates from stalactites in caves. Such an instrument is important for understanding sedimentation rates in stalagmites and for constraining models for past climate studies.
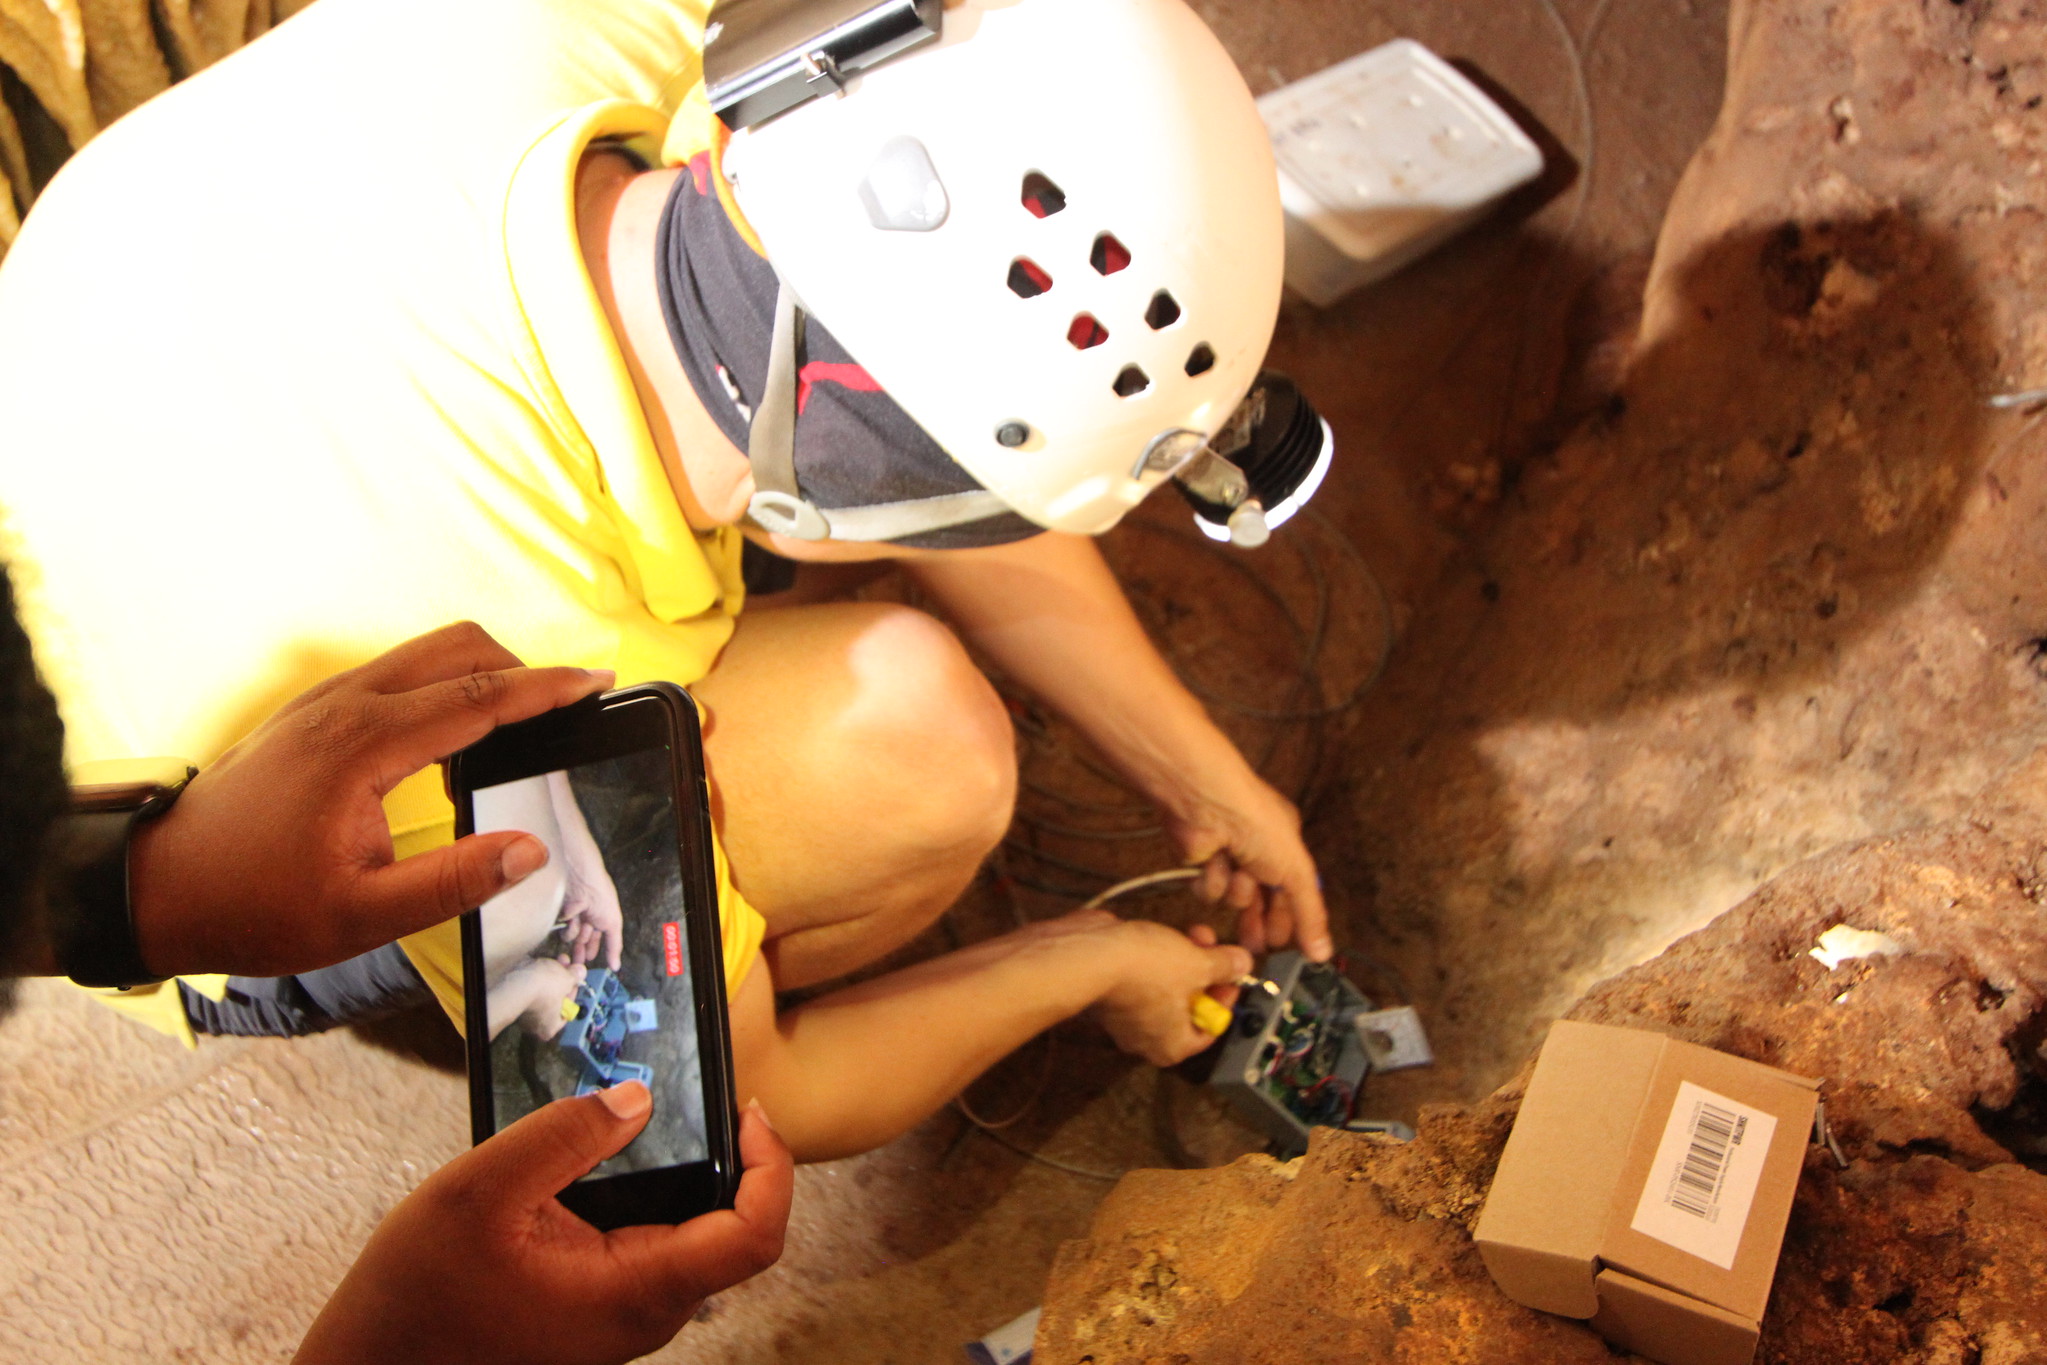 Nicola Tisato installing the data logger in the Inner Space Cavern |
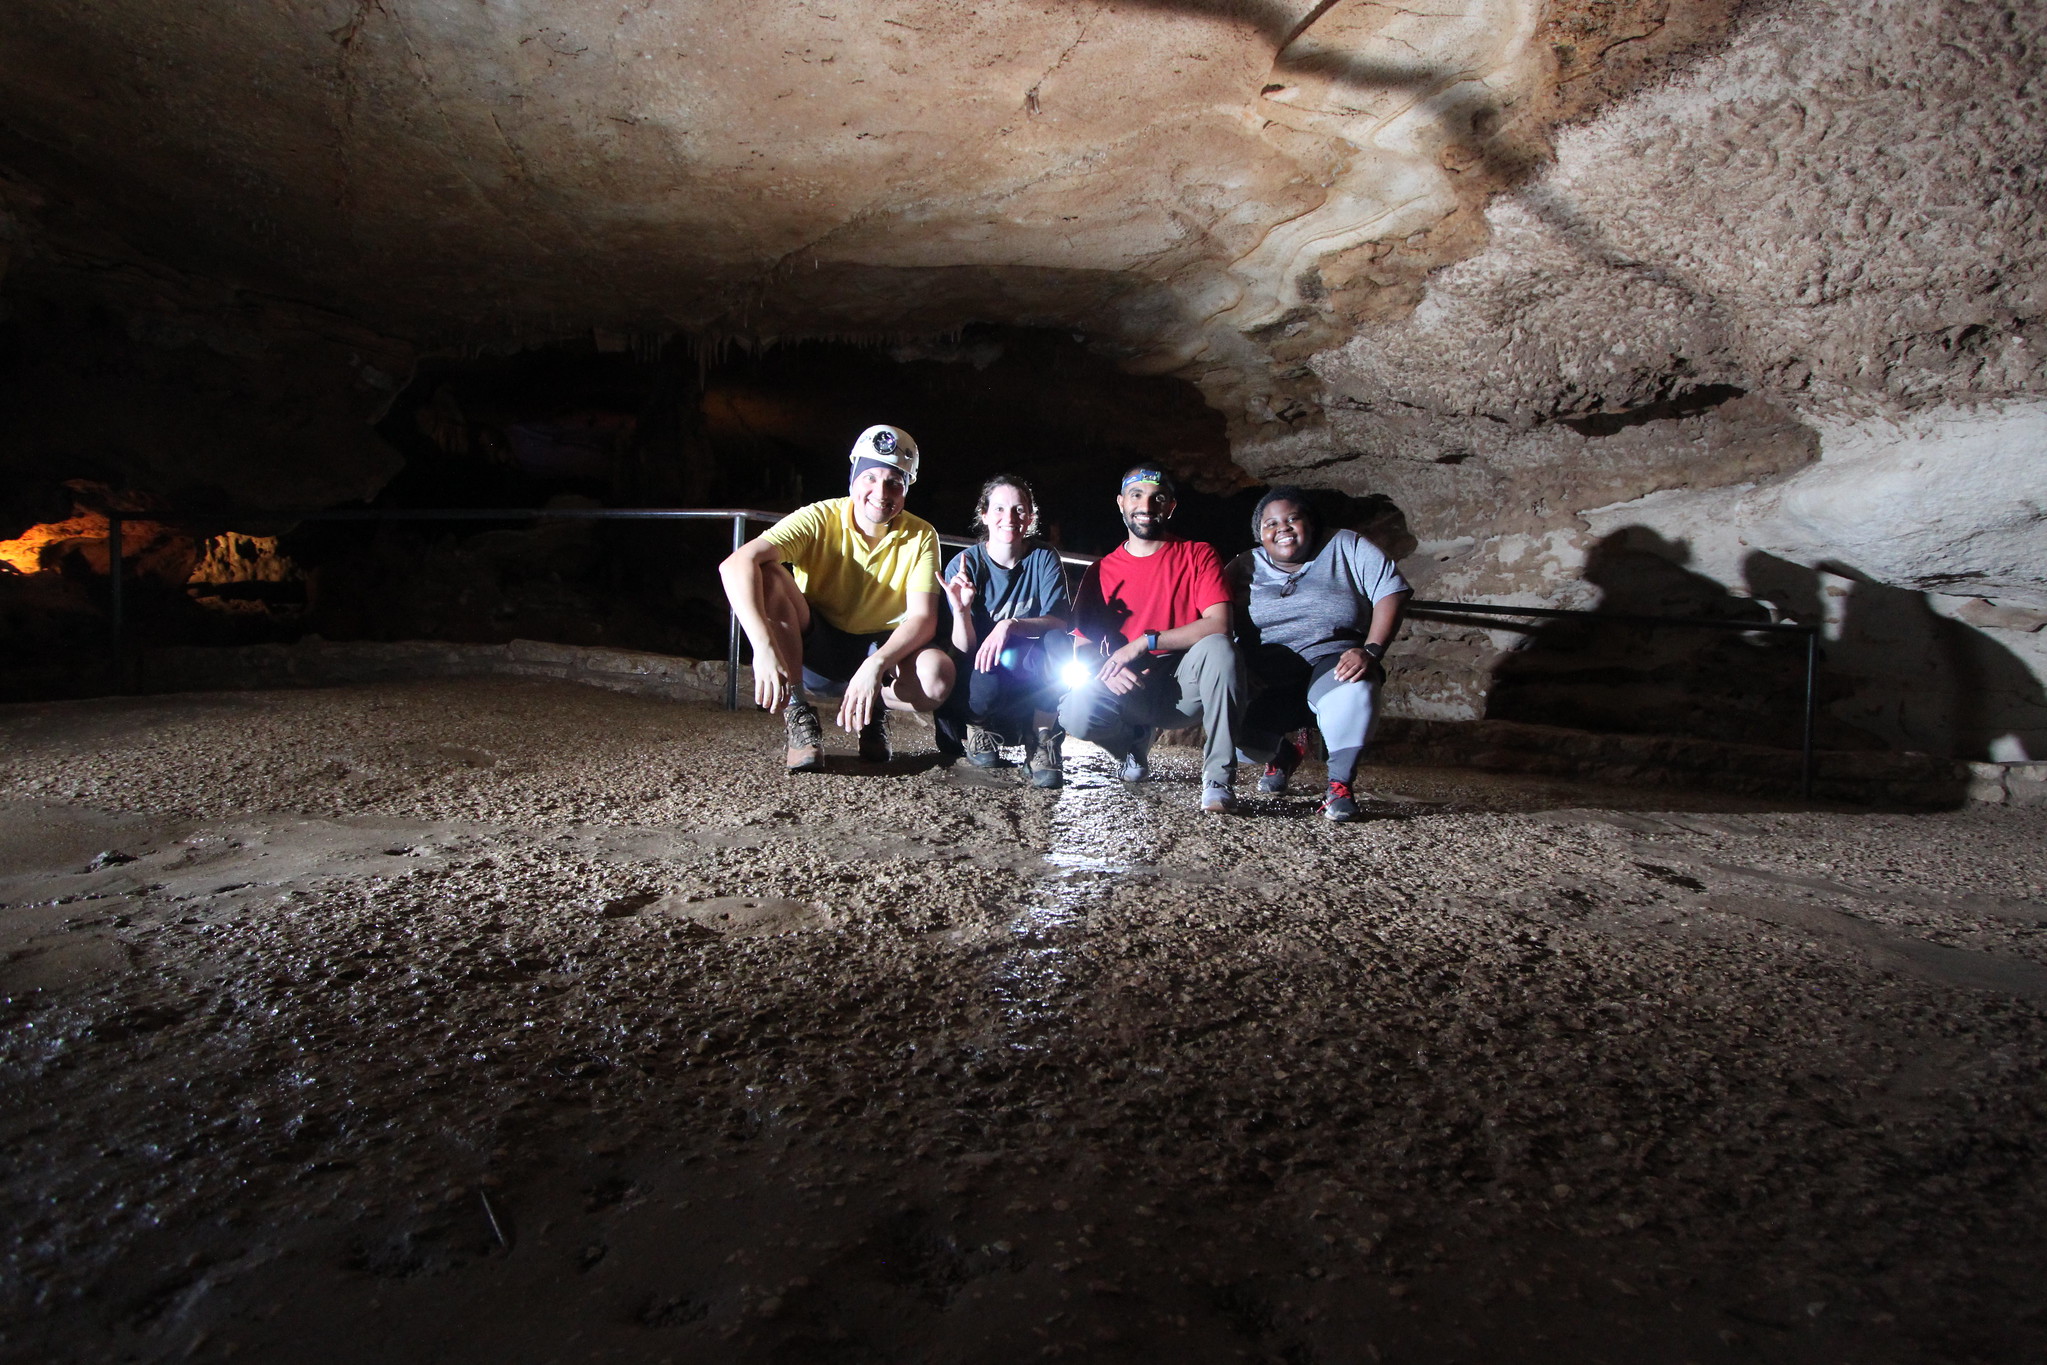 From left to right: Nicola Tisato, Carolyn Bland, Omar Alamoudi and Caylen Thorn (2022 RTX student) in Inner space Cavern (Austin area) after having installed the data logger. |
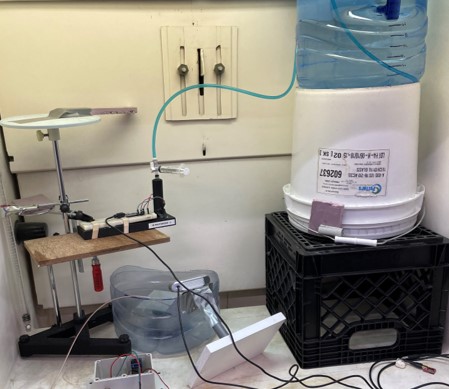 Water dripping data logger tested before deployment in the cave. |
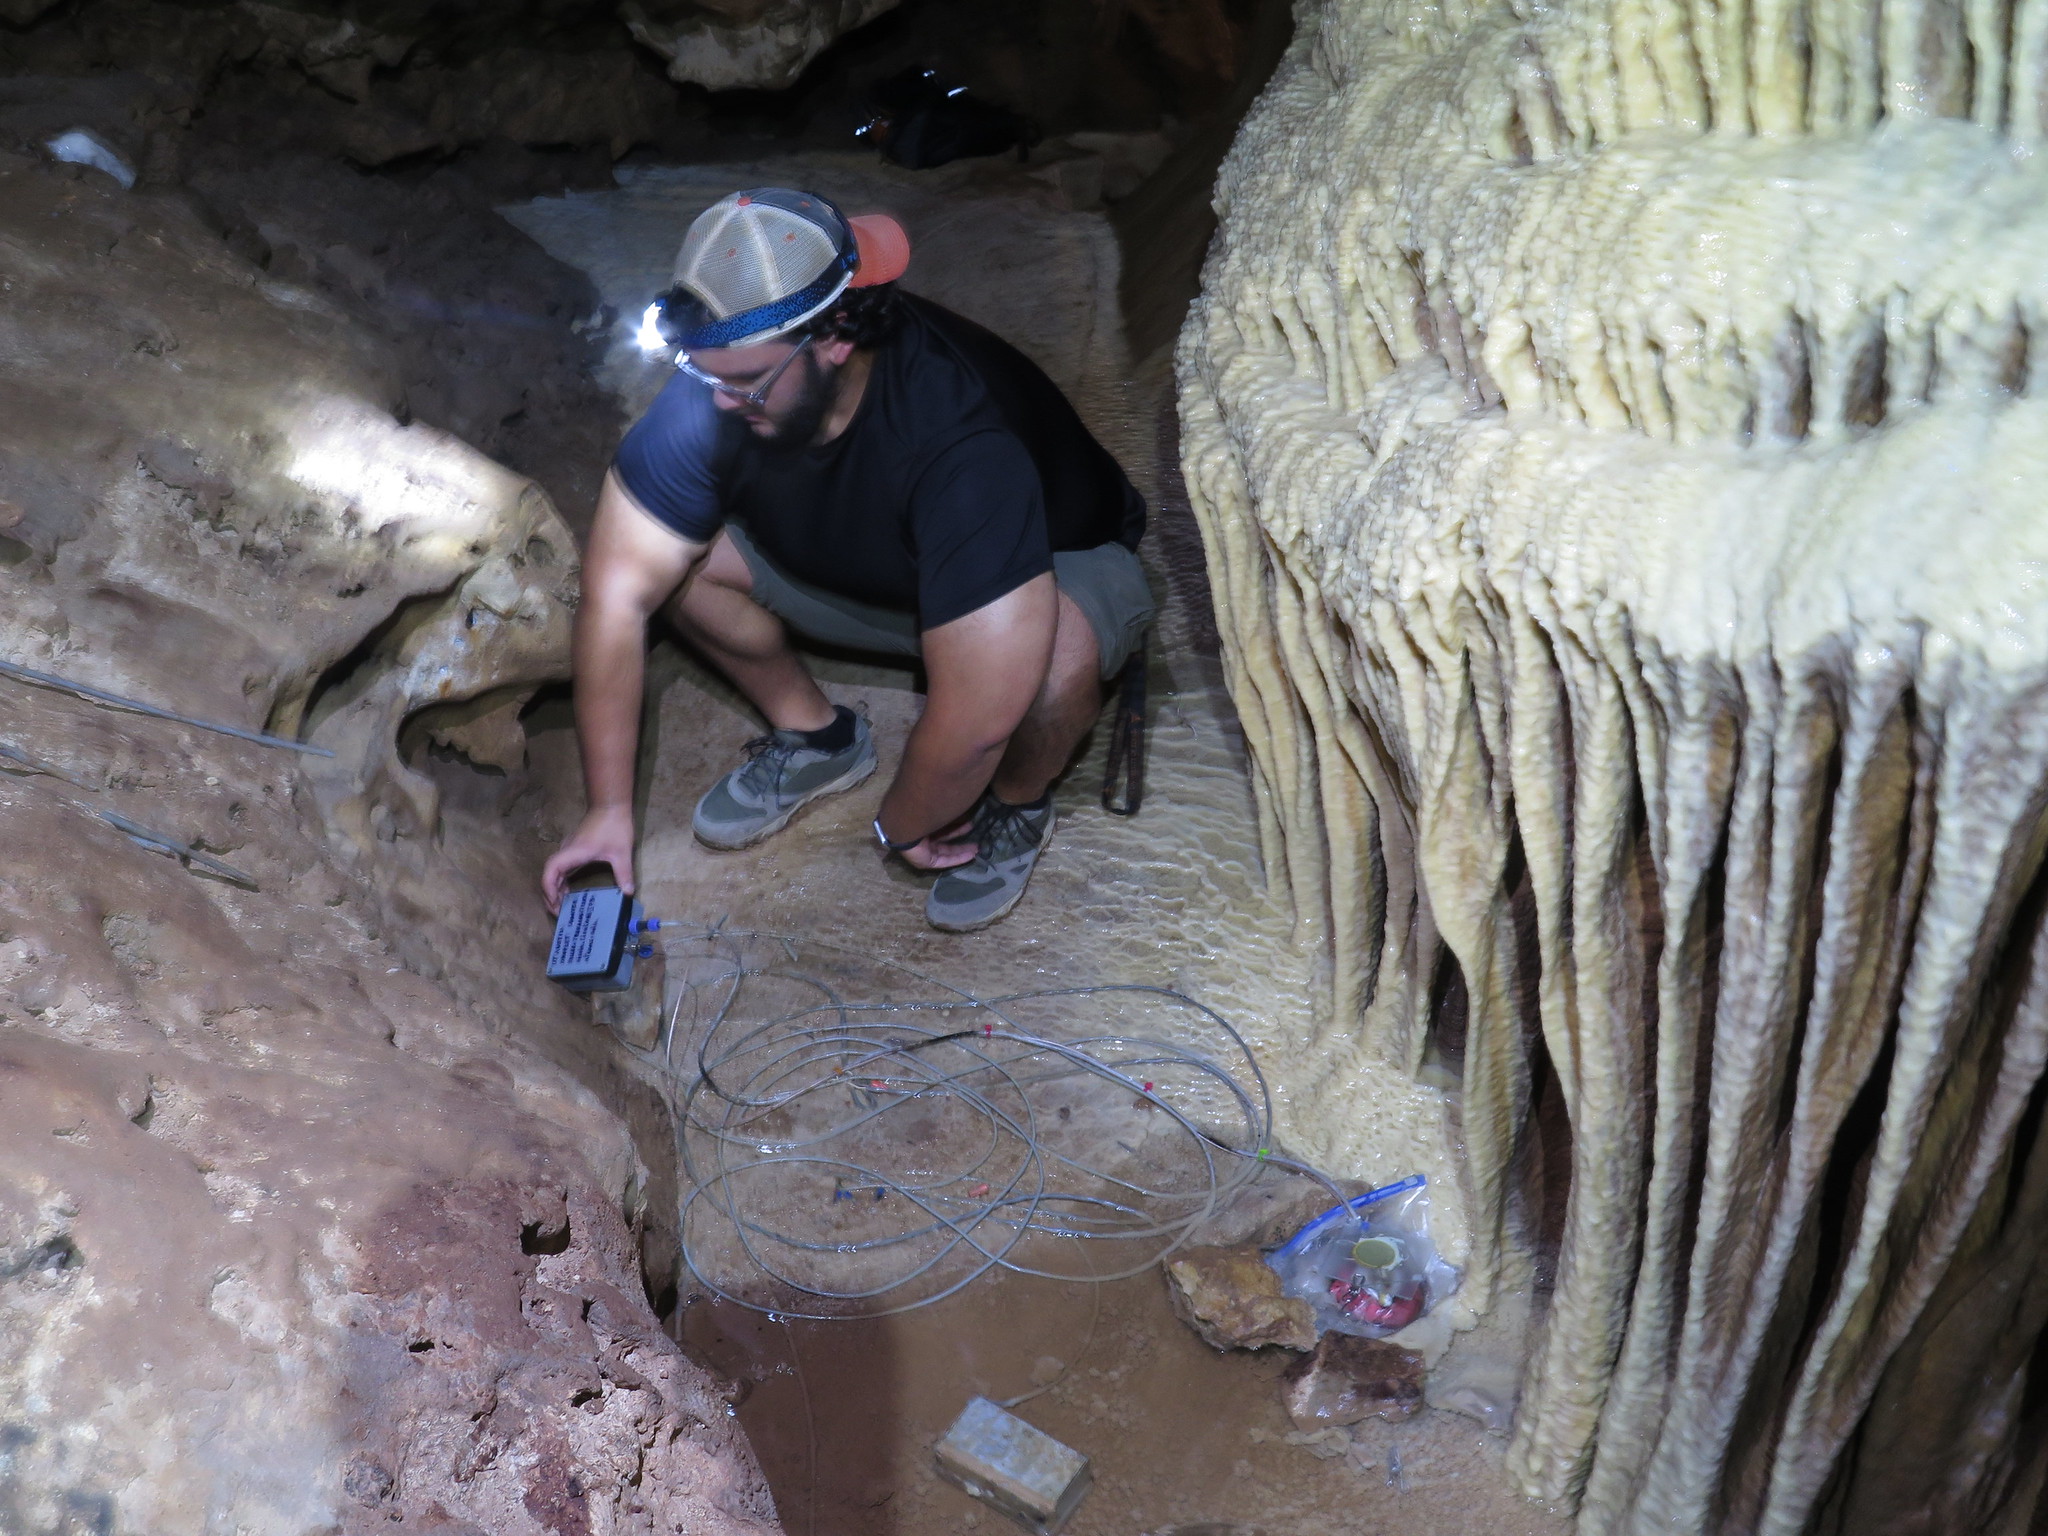 2023 RTX student Enrique Morales installing the data logger in Inner Space Cavern (Austin area) |
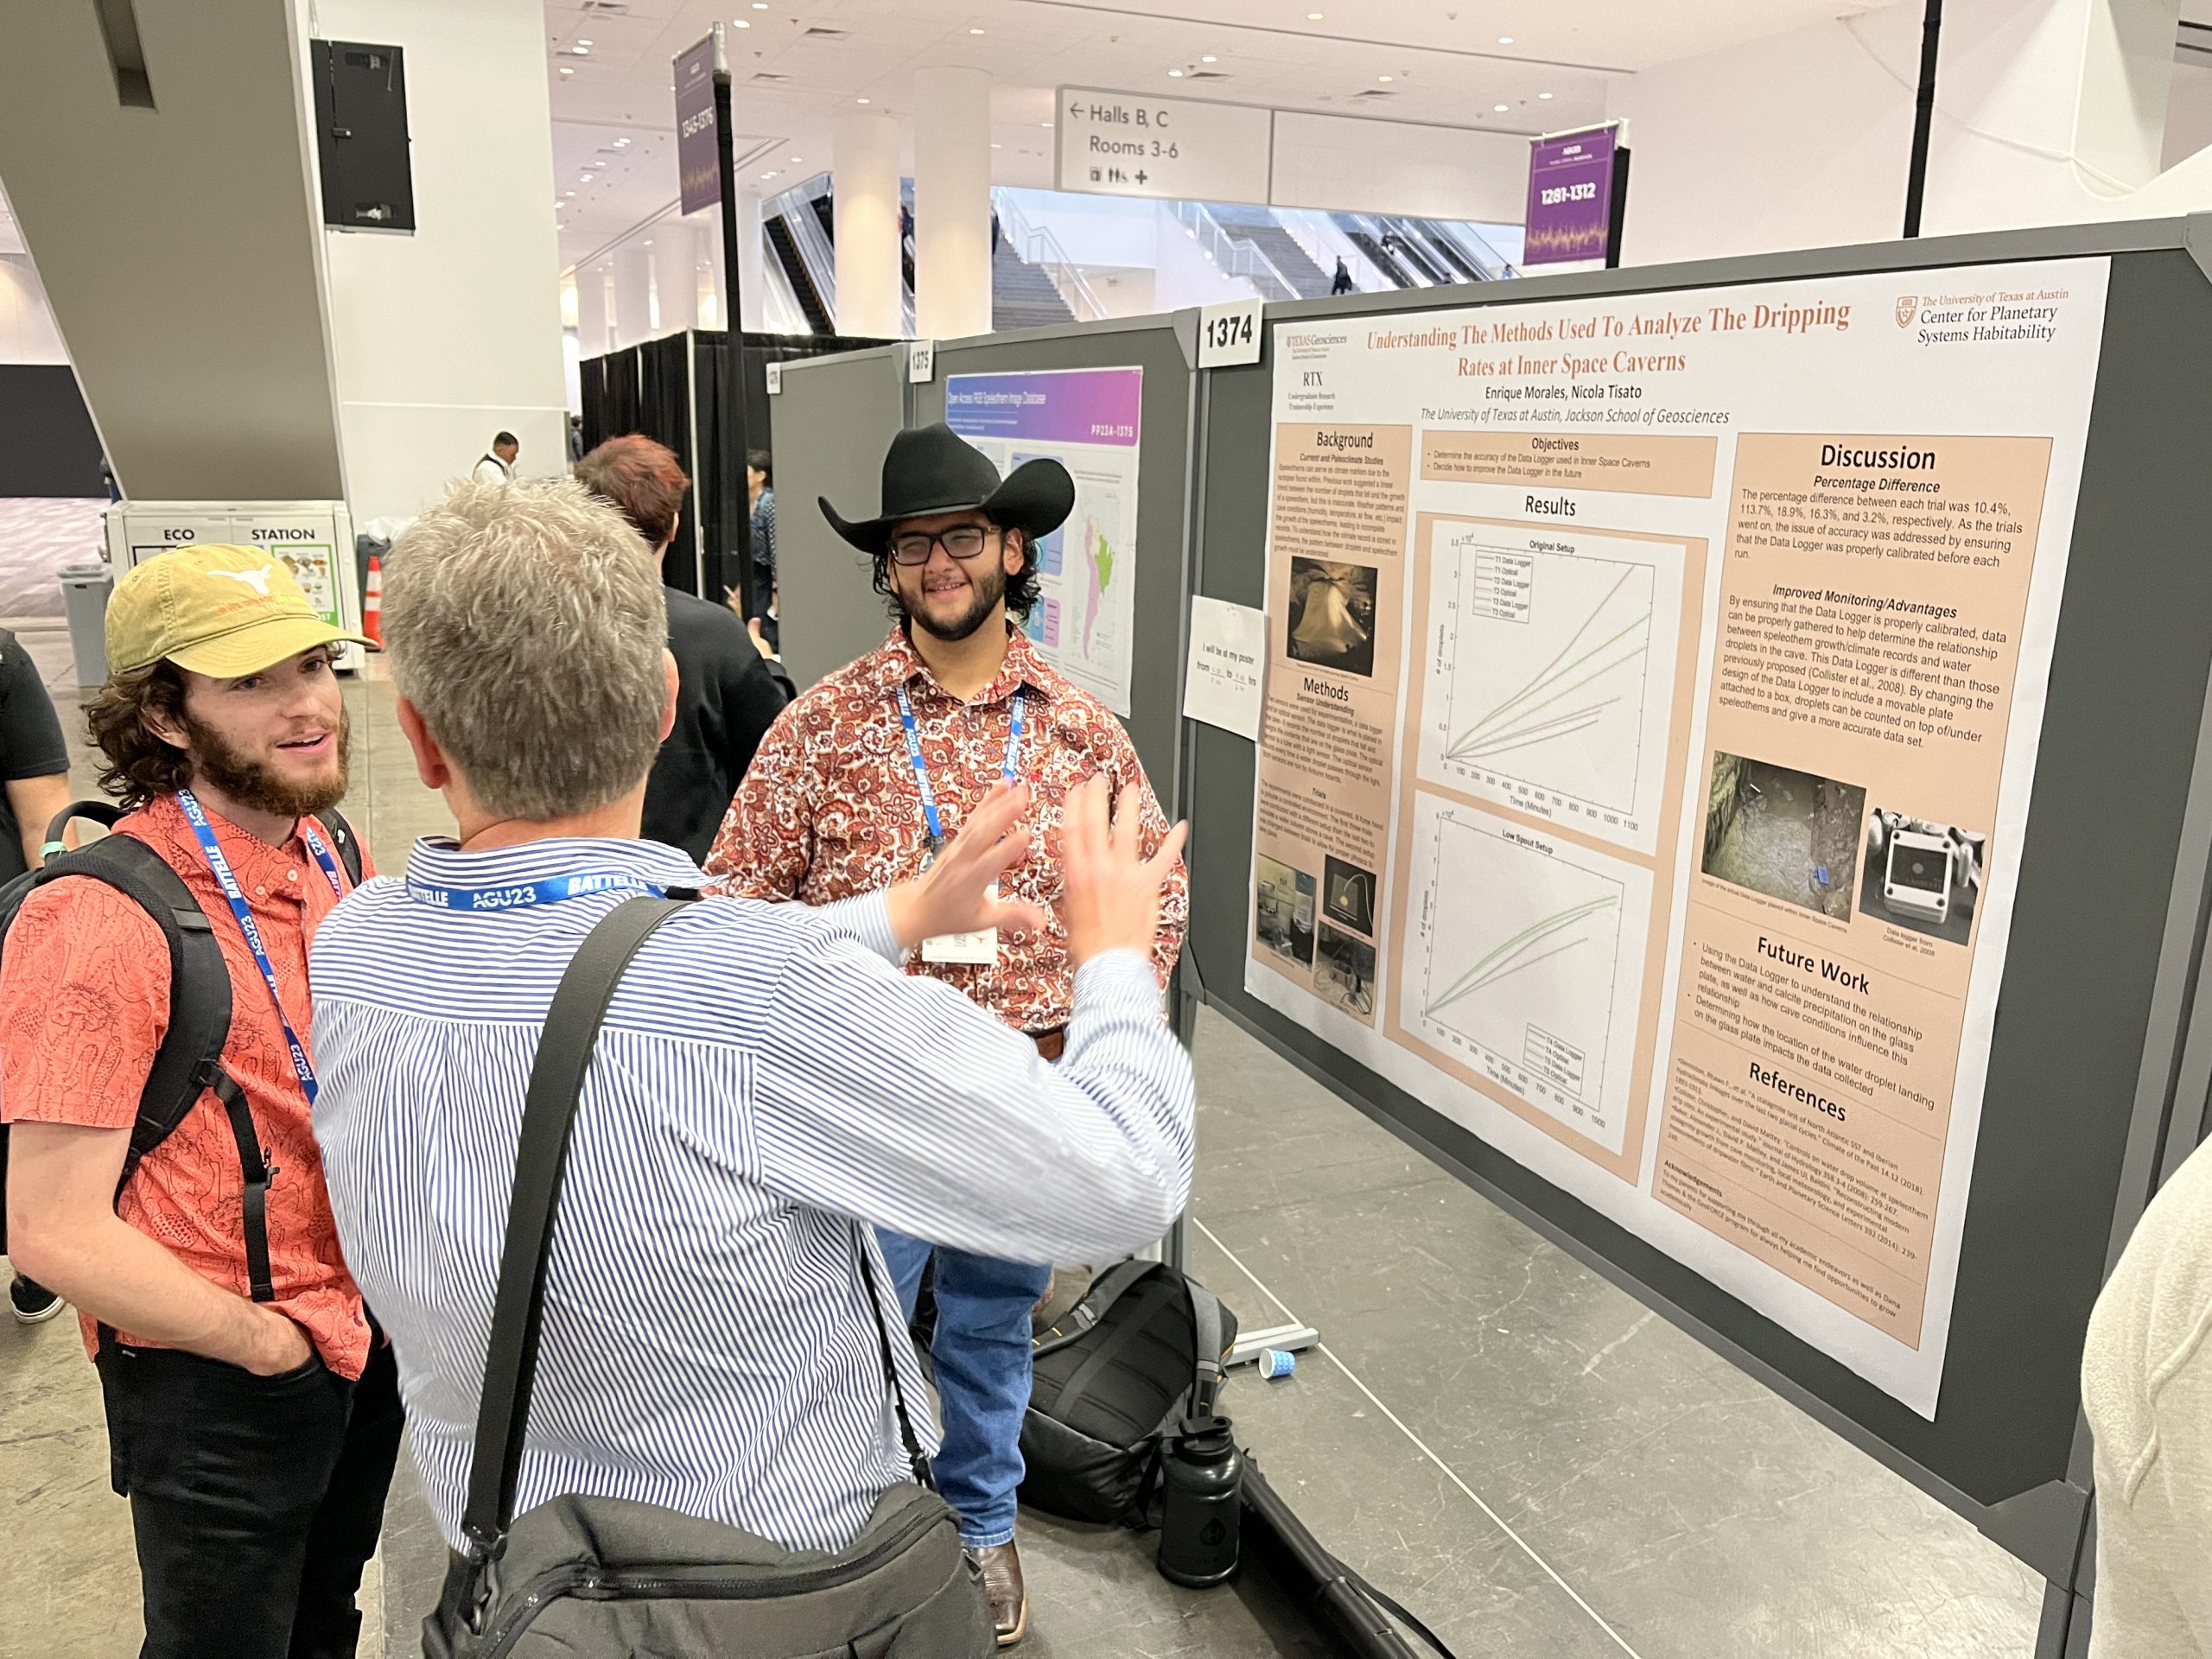
2023 RTX student Enrique Morales (the one with the cowboy hat) presenting his RTX work at AGU fall meeting 2023.
GeoForce 12th Grade Academy
Since 2024 the RDL collaborates with the GeoForce 12th Grade Academy
How Earthquakes work
Earthquakes or seismic events are vibrations of the Earth’s surface due to the sudden failure and slip of rocks along faults and fractures in the subsurface. Every year, earthquakes cause tens of thousands of casualties and huge material losses. Predicting Earthquakes could save lives and reduce these losses. However, to predict seismic events, scientists need to formulate better models that describe earthquake mechanics. Improved models will allow, for example, to interpret observations such as foreshock events or other phenomena happening prior to large earthquakes. In the last 20 years, scientists have discovered that faults producing Earthquakes often deform slowly, producing what we call slow-slip events (SSEs).
Understanding why slow-slip events happen and other deformation phases before an Earthquake is key to understand Earthquake mechanics. Interestingly, similar deformation phases are also observed in laboratory experiments (labquakes) where rock samples or analog materials are forced to slip one against the other and produce laboratory earthquakes (or labquakes) following the sudden slip of the samples. Scientists believe that studying labquakes will provide insights into Earthquake mechanics and might provide a chance to predict seismic events.
We will use the rotary shear apparatus that is installed at the Rock Deformation Laboratory of UT Austin and test plexiglas samples as analogs to rocks (see figure below).
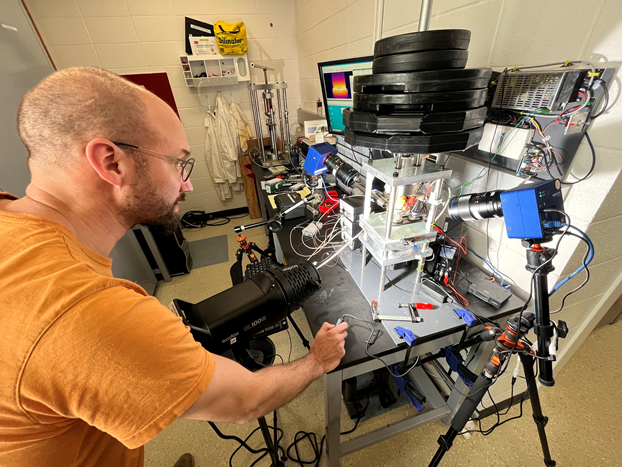
Dr. Benoit Cordonnier (ESRF) performing a stick-slip experiment with the rotary shear apparatus at the Rock Deformation Laboratory. The inset shows details of the cylindrical Plexiglas samples. The bottom sample rotates, rubbing against the top sample, which is glued onto sensors to measure friction. The two samples are vertically loaded thanks to the barbell weights on top of the apparatus. The experiment is recorded using two high-speed cameras.
What students will do: we will perform stick-slip experiments in which two cylinders (a few cm in size) are forced to slip one against the other along a fault. We will measure the resistance to slip, which is also called friction and the temperature of the fault. Along with friction, we will also acquire the vibration generated by the labquake (acoustic emissions) that resemble the seismic vibrations generated by an Earthquake.
Plexiglas (PMMA) is often used to study labquakes and because it is transparent it allows observing the evolution of the fault zone before and during the slip. We will use a high speed camera capable of recording 10,000 frame per second to investigate the deformation of the fault before, during and after earthquakes (see figure below).
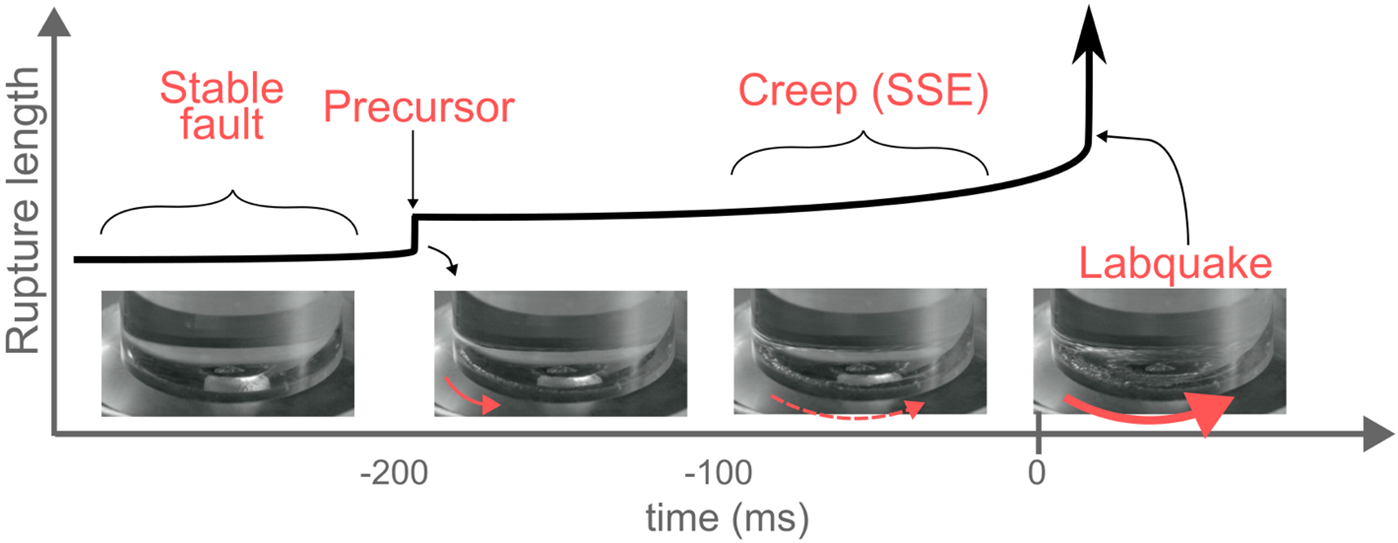
Dimension of the failed fault (rupture length) vs. time and four frames extracted from an high-speed movie. Continuos and dashed red arrows indicate the fast and slow slip of the fault, respectively. The arrow thickness is proportional to the slip amount.
Each experiment will last 1 to 2 hours and all the data will be acquired digitally and shared with the students through a server. The days after the experiments will be dedicated to analyze the data. We will focus on a few stick-slip events (labquakes) that exhibit precursor events. We will prepare plots of friction, temperature and acoustic emission activity vs. time and compare them to the high-speed videos. The final scope of the activity is to study and gain insights on the signature of acoustic emissions that are produced by Earthquake precursors (see figure below).
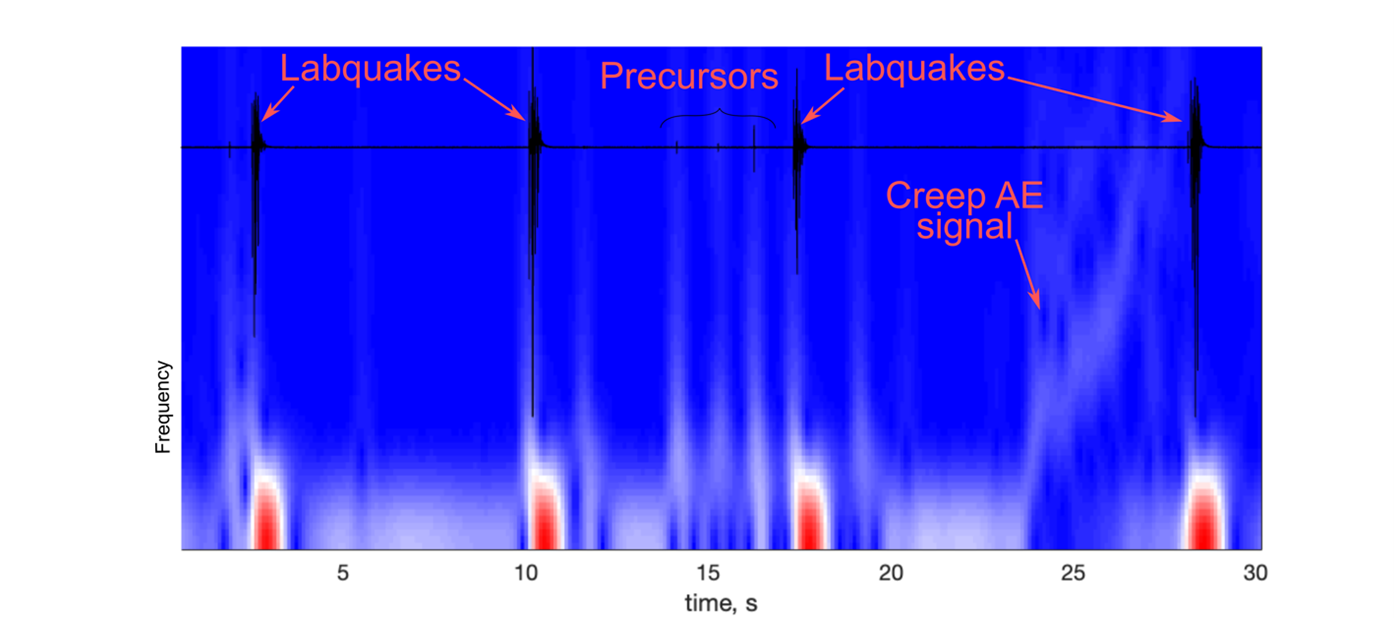
Frequency analysis of labquakes with and without precursors and slow-slip events (creep).
Before performing the experiments we will prepare the plexiglas samples using workshop tools and machines. The Students will assist the machining of the samples, which is made with a lathe, and will polish the slipping surfaces using a flat plane and sand paper. Data analysis and visualization will be performed using softwares for data analysis such as Matlab, Python or Julia lang.
Elementary school lectures
Earthquakes!
This is a one-hour lecture tailored to 3rd-5th graders. The lecture is divided in 4 parts:
1) Presentation of UT Austin and the study of Earthquakes in the RDL and other laboratories;
2) Where are Earthquakes in the world? Global tectonics, induced seismicity (Texas and Oklahoma) – resources to understand earthquakes (e.g., www.usgs.gov);
3) How big can an earthquake be? All together, we will do the spring-load experiment showing the relationship between earthquake size and force, we will also plot the relationship between force and earthquake size.
4) Q&A
The total time of the lecture can vary between 40 min to 1.5 hours. Here is a pre-recording of the lecture.
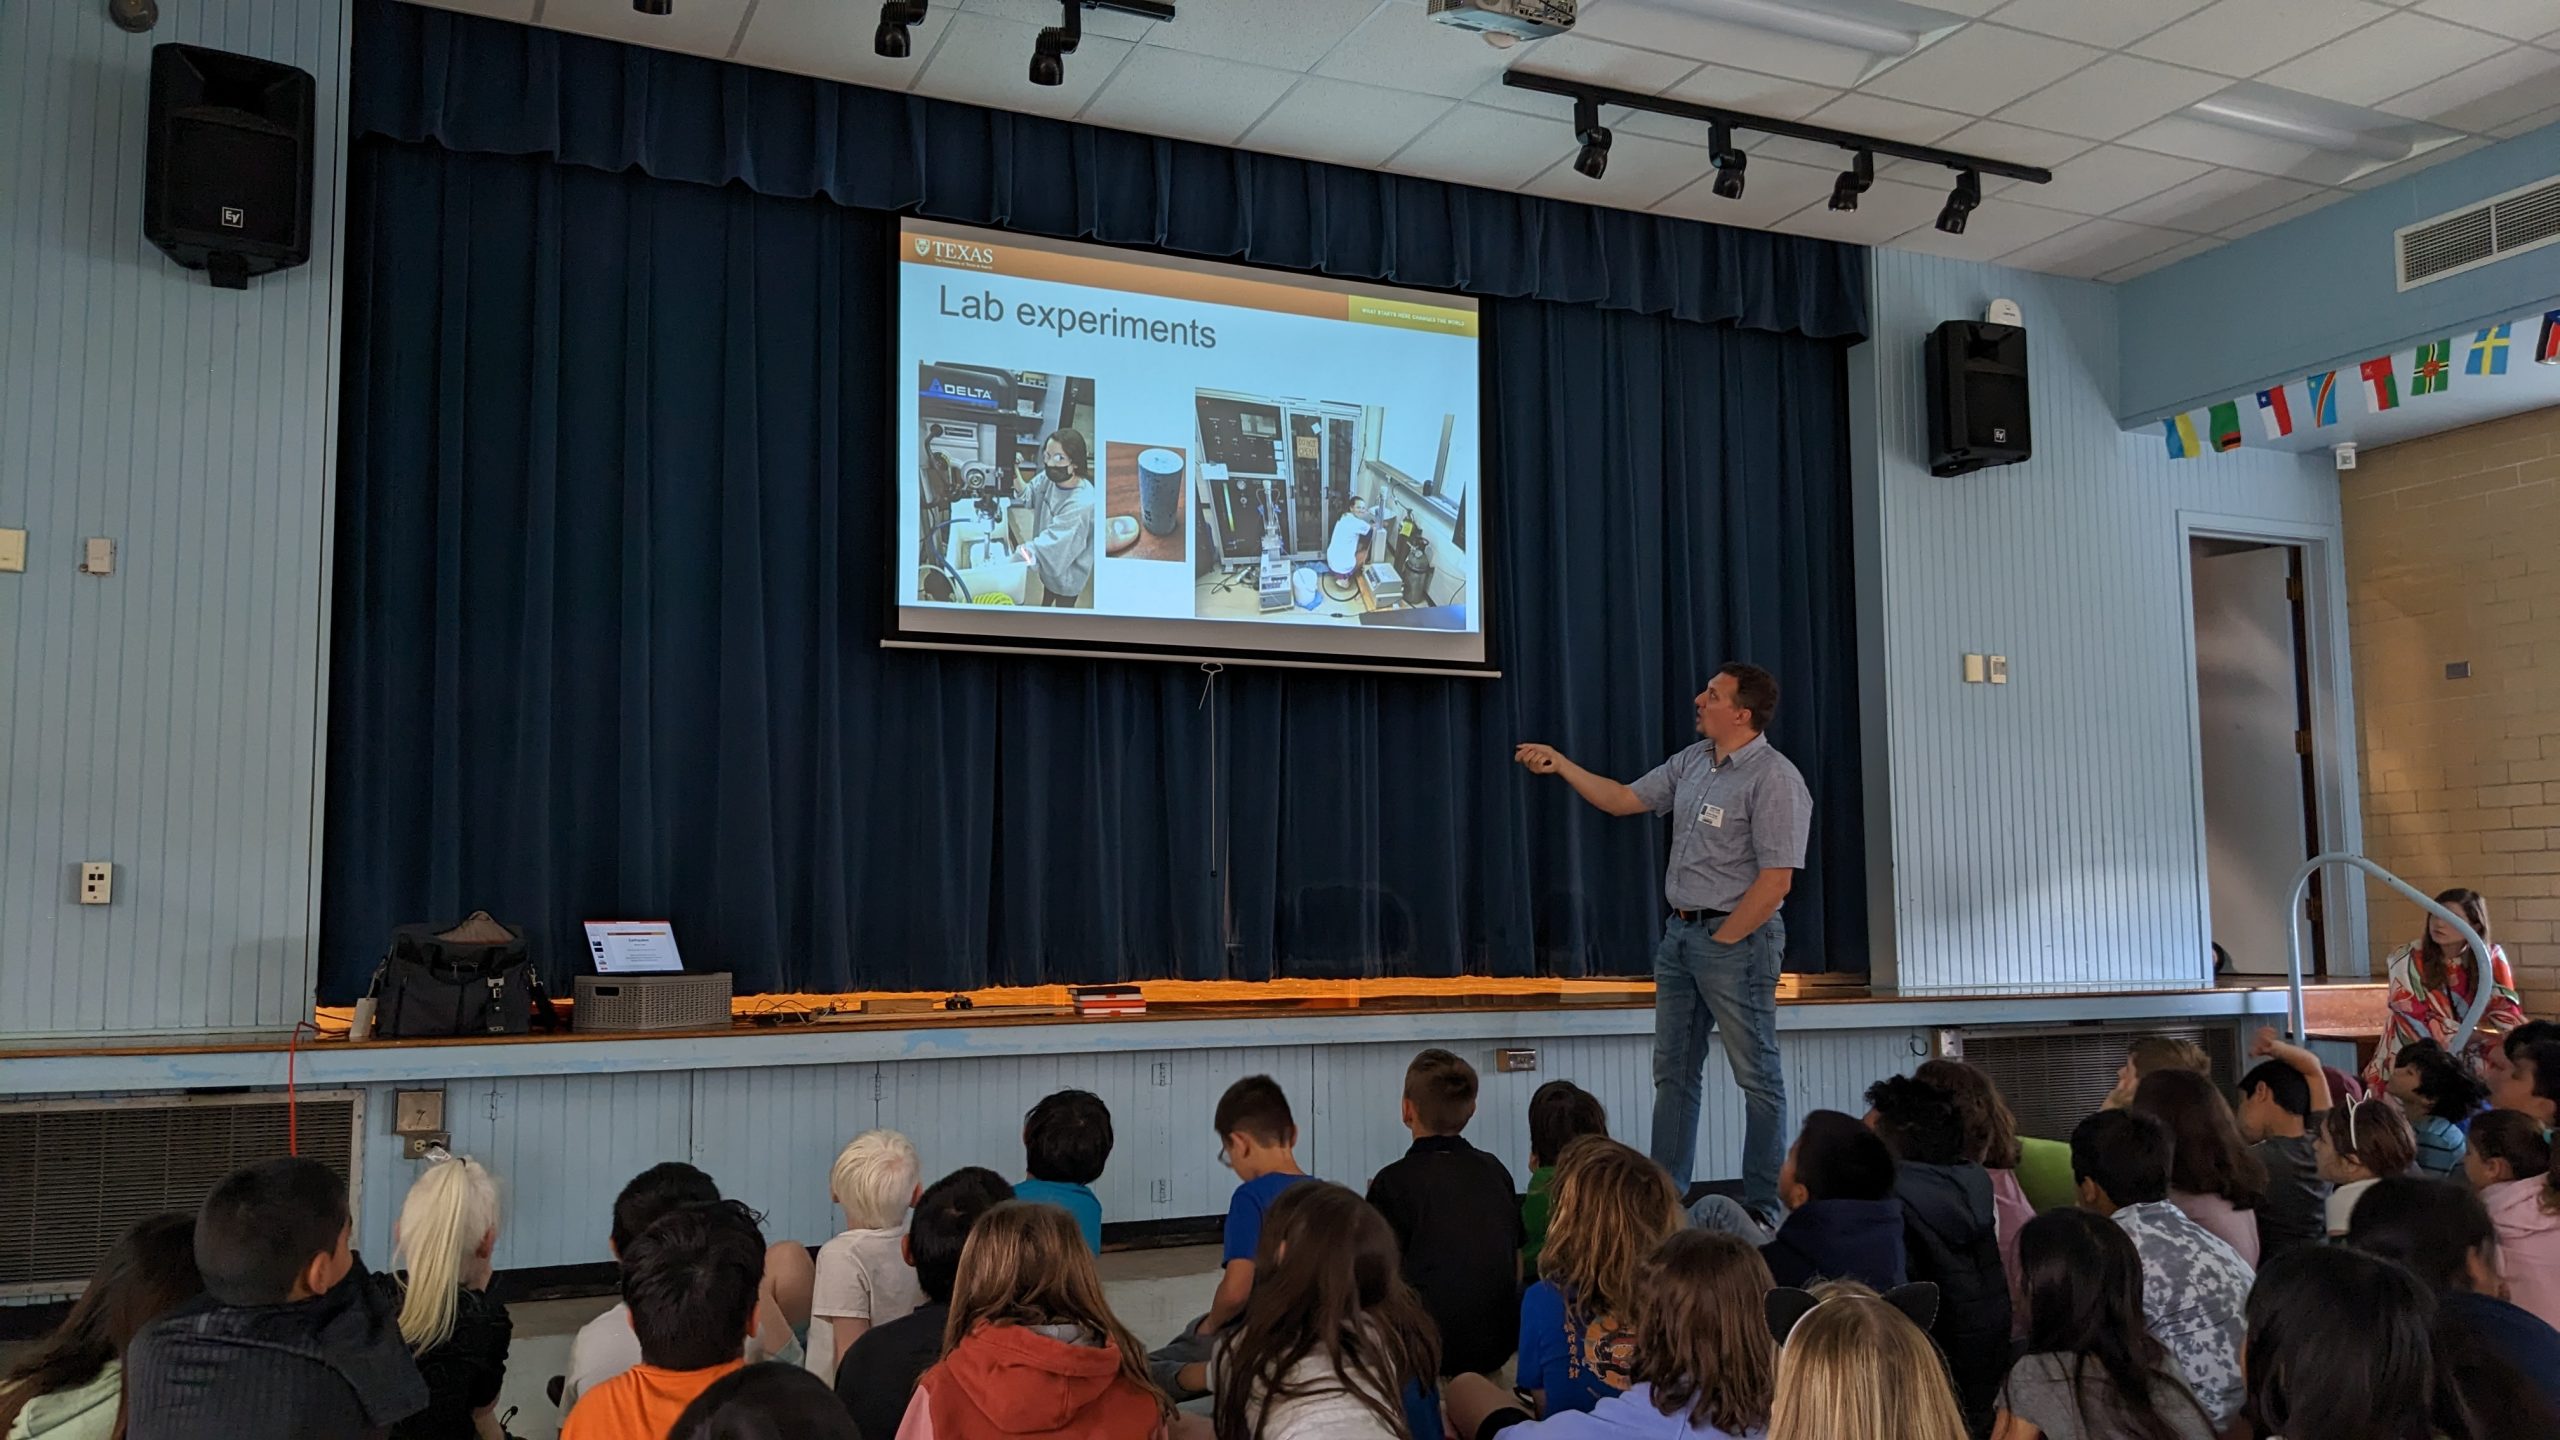
Nicola Tisato at Reilly Elementary School (Austin – TX) in 2023 giving the Earthquake lecture to 3rd and 4th graders.
In-situ needed items: digital projector and screen