Methodology
Sample Selection
A dataset of ten unionid bivalve shells collected across the Wichita River Watershed was reviewed based on completeness, and the TDS of the water at their sample location. To show the eastward salinity gradient of the watershed contributed by Permian evaporites west of the sampling area, three shells were selected from Lake Kemp, Holiday Creek at Wichita Falls, and and eastern portion of the Wichita River river reaches with high, intermediate, and low TDS in water at the collection locations. A fourth specimen was selected from the Little Wichita River, which gives insight into a nearby environment with different water sources. This set of of specimens was useful for comparison of water composition reflected in carbonate composition across the WRW system.
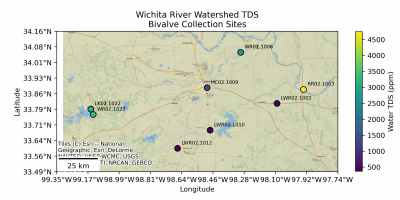
Figure 1. Wichita River Watershed TDS of Water at Bivalve Collection Localities
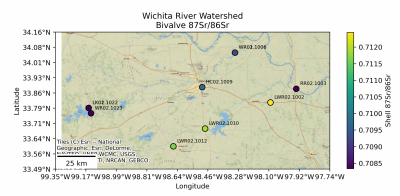
Figure 2. Wichita River Watershed Bivalve 87Sr/86Sr
Sample Preparation
Following selection, shells were cut longitudinally from umbo to ventral margin using an Isomet saw with water cooling to minimize damage to sample and equipment. The sectioned halves were mounted in epoxy resin containing an indium tracer and left to cure for ~3 days. Embedded specimens were trimmed to form a billet of ~2 mm thickness and polished on a rotating wheel using a progressive grit sequence from 20 μm to 0.5 μm. Polishing helped to produce a smooth surface suitable for laser ablation.
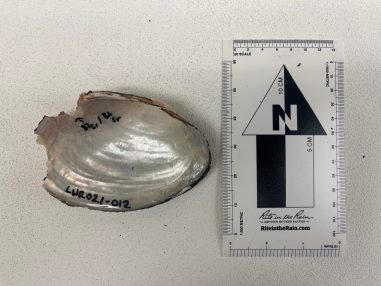
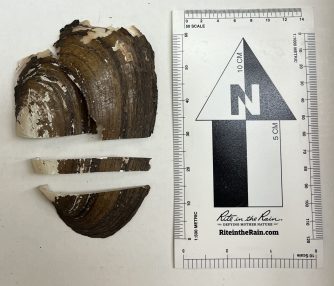
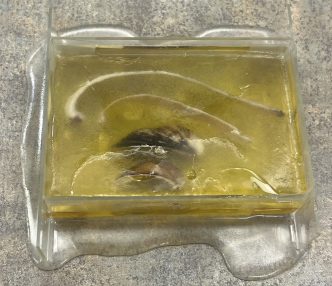
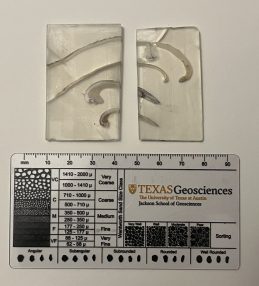
Figure 2. From Left to Right: Specimen LWR021-012 (Uncut), Specimen LWR021-012 (Cut transect), Specimens Curing in Epoxy Resin Mount, Final Cut and Polished Billets for Analysis
Laser Ablation Setup
Elemental data of shell transects was collected using an NWR193 excimer laser ablation system. Ablation conditions were selected using Agilent MassHunter suited to to carbonate material and to allow for high resolution data from growth layers of shells.
| Spot geometry | 10×75 μm rectangular aperture |
| Scan speed | 5 μm/s |
| Fluence | 3.8 J/cm² |
| Repetition rate | 10 Hz |
| Carrier gas flows | He = 0.80 L/min; Ar = 0.80 L/min |
| Sampling depth | 7 mm |
| Sampling period | 0.347 s per cycle |
Before data on shell transects were collected, pre ablation at a reduced energy was used to remove surface contamination. Three consecutive analytical sessions were performed. The first was terminated early for NIST610 upon noticing the equipment was focused on the bottom of the glass slide. The final session was used to collect reading for final standard transect of NIST610, which timed out during the second session
ICP-MS Instrumentation and Selected Analytes
Elemental measurements were collected using an Agilent 8900 ICP-MS/MS run entirely in no gas mode, with all analytes measured at a 20 ms dwell time. The analytes were selected to capture variability relating to reconstructing seasonal shifts in water chemistry, TDS, redox effects, and human pollution in the Wichita River Watershed. Calcium 43Ca was used as the internal standard for concentration normalization with an assumed 40.0432 wt%. The table below summarizes possible uses of data collected on each analyte.
| Salinity and Water Chemistry (TDS) | Na23, Sr88, Ba137/Ba138 |
| Temperature/Seasonality | Mg24/Mg25 (Uses Mg/Ca) |
| Redox/Runoff | Mn55, Fe57 |
| Internal Standard/Proxy Ratios | Ca43, Ca44 |
| Anthropogenic Pollution | Pb208 |
| Other | Zn66/Zn68, Se77/Se82 |
Analytical Sequence
In transects of bivalve shells as unknown, ordering from 1-4 is determined by transect proximity to umbo of shell, with 1 being most proximal to umbo and 4 being most distal to umbo. Transects were collected from the periostracum of the shell’s outer surface, to the inner surface of the shell.
-
MACS-3: 1-3
-
NIST 612: 1-3
-
NIST 610: 1-3
-
Unknowns:
WR01-006-04
WR01-006-01
WR01-006-02
WR01-006-03
HC02.1-009-01
HC02.1-009-02
HC02.1-009-03
HC02.1-009-04
LK01-22-04
LK01-22-03
LK01-22-02
LK01-22-01
LK021-012-01
LK021-012-02
LK021-012-03
LK021-012-04 -
MACS-3: 4-6
-
NIST 612: 4-6
-
NIST 610: 4-6
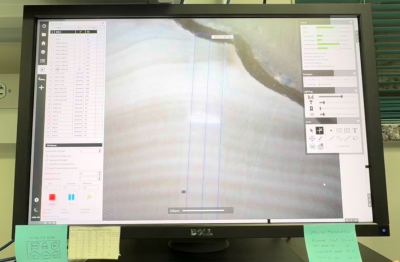
Figure 3. Ablation Transect of Shell Perpendicular to Growth Layers
Iolite Reduction
Laser ablation data was processed using Iolite 4 set to “Trace Elements” for the data reduction scheme. Laser log files assigned time intervals to the 3 ablation datasets in this timeseries. The first was terminated early for NIST610 upon noticing the equipment was focused on the bottom of the glass slide, while the second timed out while recording final NIST610 standard and had to be repeated. Baselines were automatically selected by iolite and manually verified. Spline baselines were assigned to the unknowns, linear baselines were assigned to the standards.
All concentrations were internally standardized to 43Ca, assuming 40.0432 wt% Ca. MACS-3 served as the primary calibration standard, with NIST 610 and NIST 612 used as secondary quality control materials. NIST610-1 was excluded due to low intensities across all analytes, and NIST612 yielded unreliable readings due to focus on bottom of slide during data collection. Sensitivity drift was corrected by linear interpolation by bracketing standard blocks. After this, the concentrations were exported as a timeseries for each shell transect.
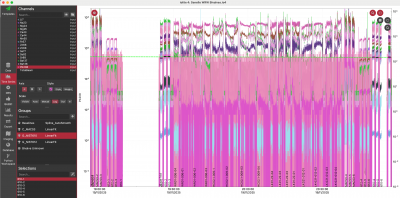
Figure 4. Timeseries as displayed in Iolite 4. Gaps visible between 3 stitched datasets in timeseries. Omitted NIST610 bracket notably falls below line outlined by other brackets.
Quality Control and Measurement Quality
Performance of ablation was assessed using measurements of NIST 610, NIST 612, and MACS-3.
1. Reduced through the MACS-3 calibration curve.
- NIST610 – Recoveries had an average of 88% for major elements, excluding considerable bias in Fe (40Ca17O and 40Ar17O interference) and Pb.
- NIST612 – Recoveries were low across set of analytes, typically falling below 40%. Likely, this is the result of misfocusing during data acquisition.
QC1: MACS-3
| Analyte | RefValue | MeanMeasured | Recovery | 2SE | LOD | n | |
| Li7 | 62.9 | 62.9 | 1 | 3.07 | 0.08 | 6 | |
| Na23 | 5850 | 5849.99 | 1 | 620.44 | 0.17 | 6 | |
| Mg24 | 1720 | 1720 | 1 | 64.73 | 0.04 | 6 | |
| Mg25 | 1720 | 1720 | 1 | 67.42 | 0.16 | 6 | |
| Ca44 | 376900 | 376900.06 | 1 | 11675.32 | 15.75 | 6 | |
| Mn55 | 512 | 512 | 1 | 16.44 | 0.11 | 6 | |
| Fe57 | 10500 | 10500 | 1 | 553.37 | 1.34 | 6 | |
| Zn66 | 124 | 124 | 1 | 6.43 | 0.09 | 6 | |
| Zn68 | 124 | 124 | 1 | 6.71 | 0.6 | 6 | |
| Sr88 | 6640 | 6639.96 | 0.99999 | 303.05 | 0.01 | 6 | |
| Ba137 | 59.6 | 59.6 | 1 | 3.1 | 0.01 | 6 | |
| Ba138 | 59.6 | 59.6 | 1 | 3.15 | 0 | 6 | |
| Pb208 | 59.7 | 59.7 | 1 | 5.59 | 0.02 | 6 |
QC2: NIST610
| Analyte | RefValue | MeanMeasured (ppm) | Recovery | 2SE | LOD | n |
| Li7 | 468 | 422.51 | 0.9 | 9.93 | 0.15 | 5 |
| Na23 | 99415 | 82390.36 | 0.83 | 2023.98 | 0.63 | 5 |
| Mg24 | 432 | 439.02 | 1.02 | 8.93 | 0.07 | 5 |
| Mg25 | 432 | 449.28 | 1.04 | 13.29 | 0.45 | 5 |
| Ca44 | 82144 | 82411.54 | 1 | 2212.5 | 30.4 | 5 |
| Mn55 | 444 | 395.04 | 0.89 | 7.89 | 0.2 | 5 |
| Fe57 | 458 | 294.45 | 0.64 | 8.08 | 2.35 | 5 |
| Zn66 | 460 | 372.52 | 0.81 | 9.3 | 0.13 | 5 |
| Zn68 | 460 | 388.59 | 0.84 | 8.08 | 1.23 | 5 |
| Sr88 | 515.5 | 435.87 | 0.85 | 11.99 | 0.04 | 5 |
| Ba137 | 452 | 344.25 | 0.76 | 7.89 | 0.02 | 5 |
| Ba138 | 452 | 344.12 | 0.76 | 7.98 | 0.01 | 5 |
| Pb208 | 426 | 254.74 | 0.6 | 6.33 | 0.02 | 5 |
QC3: NIST612 (Misfocused Readings)
| Analyte | RefValue | MeanMeasured | Recovery | 2SE | LOD | n |
| Li7 | 40.2 | 1.52 | 0.04 | 0.06 | 0.11 | 5 |
| Na23 | 103858 | 81845.81 | 0.79 | 883.25 | 0.17 | 5 |
| Mg24 | 68 | 27.31 | 0.4 | 0.36 | 0.17 | 5 |
| Mg25 | 68 | 27.02 | 0.4 | 0.89 | 0.54 | 5 |
| Ca44 | 85002 | 85390.2 | 1 | 982.65 | 1330.78 | 5 |
| Mn55 | 38.7 | 1.14 | 0.03 | 0.07 | 0.16 | 5 |
| Fe57 | 51 | 12.75 | 0.25 | 1.03 | 2.03 | 5 |
| Zn66 | 39.1 | 2.03 | 0.05 | 0.16 | 0.15 | 5 |
| Zn68 | 39.1 | 6.78 | 0.17 | 0.48 | 1.09 | 5 |
| Sr88 | 78.4 | 39.52 | 0.5 | 0.5 | 0.84 | 5 |
| Ba137 | 39.3 | 2.45 | 0.06 | 0.1 | 0.01 | 5 |
| Ba138 | 39.3 | 2.47 | 0.06 | 0.05 | 0.06 | 5 |
| Pb208 | 38.57 | 1.4 | 0.04 | 0.04 | 0.05 | 5 |
2. Reduced through the NIST610 calibration curve.
- MACS-3 – Recoveries had an average of 117% for major elements, excluding considerable positive bias in Fe (40Ca17O and 40Ar17O interference) and Pb.
- NIST612 Recoveries were low across set of analytes, typically falling below 40%. Likely, this is the result of misfocusing during data acquisition.
QC1: NIST610
| Analyte | RefValue | MeanMeasured | Recovery | 2SE | LOD | n | |
| Li7 | 468 | 468 | 1 | 10.99 | 0.18 | 5 | |
| Na23 | 99415 | 99415.05 | 1 | 2423.02 | 0.84 | 5 | |
| Mg24 | 432 | 432 | 1 | 8.73 | 0.07 | 5 | |
| Mg25 | 432 | 432 | 1 | 12.74 | 0.45 | 5 | |
| Ca44 | 82144 | 82144 | 1 | 2202.44 | 31.55 | 5 | |
| Mn55 | 444 | 444 | 1 | 8.87 | 0.23 | 5 | |
| Fe57 | 458 | 458 | 1 | 12.52 | 3.92 | 5 | |
| Zn66 | 460 | 460 | 1 | 11.47 | 0.17 | 5 | |
| Zn68 | 460 | 460 | 1 | 9.56 | 1.51 | 5 | |
| Se77 | 138 | 138 | 1 | 5.12 | 2.04 | 5 | |
| Se82 | 138 | 138 | 1 | 4.53 | 6 | 5 | |
| Sr88 | 515.5 | 515.5 | 1 | 13 | 0.05 | 5 | |
| Ba137 | 452 | 452 | 1 | 10.34 | 0.03 | 5 | |
| Ba138 | 452 | 452 | 1 | 10.45 | 0.01 | 5 | |
| Pb208 | 426 | 426 | 1 | 10.53 | 0.04 | 5 |
QC2: MACS-3
| Analyte | RefValue | MeanMeasured | Recovery | 2SE | LOD | n |
| Li7 | 62.9 | 69.26 | 1.101113 | 3.38 | 0.1 | 6 |
| Na23 | 5850 | 6804.17 | 1.163106 | 757.25 | 0.22 | 6 |
| Mg24 | 1720 | 1661.2 | 0.965814 | 62.91 | 0.04 | 6 |
| Mg25 | 1720 | 1629.56 | 0.947419 | 64.13 | 0.16 | 6 |
| Ca44 | 376900 | 373025.3 | 0.98972 | 11568.39 | 16.3 | 6 |
| Mn55 | 512 | 574.22 | 1.121523 | 18.44 | 0.13 | 6 |
| Fe57 | 10500 | 15997.22 | 1.523545 | 843.44 | 2.24 | 6 |
| Zn66 | 124 | 151.83 | 1.224435 | 7.88 | 0.12 | 6 |
| Zn68 | 124 | 146.73 | 1.183306 | 7.94 | 0.75 | 6 |
| Se77 | 59.6 | 5.86 | 0.098322 | 1.06 | 0.97 | 6 |
| Se82 | 59.6 | 5.68 | 0.095302 | 1.68 | 3.36 | 6 |
| Sr88 | 6640 | 7840.65 | 1.180821 | 357.91 | 0.01 | 6 |
| Ba137 | 59.6 | 77.55 | 1.301174 | 4.04 | 0.01 | 6 |
| Ba138 | 59.6 | 77.12 | 1.29396 | 4.1 | 0.01 | 6 |
| Pb208 | 59.7 | 98.13 | 1.643719 | 9.25 | 0.03 | 6 |
QC3: NIST612 (Misfocused Readings)
| Analyte | RefValue | MeanMeasured | Recovery | 2SE | LOD | n |
| Li7 | 40.2 | 1.67 | 0.0416 | 0.06 | 0.11 | 6 |
| Na23 | 103858 | 96835.66 | 0.9324 | 1121.91 | 0.17 | 6 |
| Mg24 | 68 | 26.58 | 0.3909 | 0.44 | 0.17 | 6 |
| Mg25 | 68 | 25.69 | 0.3778 | 0.93 | 0.54 | 6 |
| Ca44 | 85002 | 84660.78 | 0.996 | 910.67 | 1330.78 | 6 |
| Mn55 | 38.7 | 1.29 | 0.0334 | 0.08 | 0.16 | 6 |
| Fe57 | 51 | 1156.8 | 22.683 | 2778.27 | 2.03 | 6 |
| Zn66 | 39.1 | 19.71 | 0.5042 | 0.96 | 0.15 | 6 |
| Zn68 | 39.1 | 3.34 | 0.0854 | 0.87 | 1.09 | 6 |
| Sr88 | 78.4 | 2.48 | 0.0316 | 0.14 | 0.84 | 6 |
| Ba137 | 39.3 | 7.97 | 0.2028 | 0.26 | 0.01 | 6 |
| Ba138 | 39.3 | 1.29 | 0.0328 | 0.57 | 0.06 | 6 |
| Pb208 | 38.57 | 5.57 | 0.1445 | 1.52 | 0.05 | 6 |