Discussion and Findings
A. Quality of Results
The methodology used in this project, overall, seemed to produce quality LA-ICP-MS data for analyte concentrations. However, data seemed to be of higher quality when reduced using some standards compared to others. The accuracy of data was determined by treating the different reference materials as unknowns, and then reducing them against one another to look at their recoveries against their known values. MACS-3, NIST610, and NIST612 were the standards used in this experiment.
When NIST 610 was used to reduce MACS-3, its known concentrations came to a grand average recovery of 120.31% ± 20, and a grand average recovery of 117.64% ± 12 when anomalously high values for Fe and Pb were excluded. This reflects an overall over recovery of the standard, making analysis with this data questionable.
When MACS-3 was used to reduce NIST610, its known concentrations came to a grand average recovery of 84% ± 13, and a grand average recovery of 0.88% ± 10 when anomalously low values for Fe and Pb were excluded. This reflects a more accurate data collection using reduction by MACS-3 than reduction by NIST610, so data reduced by MACS-3 was used for analysis.
The inaccurate recoveries seen in the data for Fe can possibly be attributed interference from 40Ca17O or 40Ar17O. Unlike the other two standards, NIST612 reported very low recoveries when reduced by both the other standards. When reduced by MACS-3 it was represented by a grand recovery of 29% ± 32, and when reduced by NIST610 it was represented by a grand recovery of 32.64% ± 33.4. This could likely be explained by a misfocus during ablation on the incorrect side of the glass slide, and therefore data reduced using NIST612 was omitted from analysis. Precision across the six readings of each standard appeared to be relatively consistent with one another, with unknown data for shell transects falling above limits of detection for most analytes and having low uncertainties.
B. Results Implications to Research Question
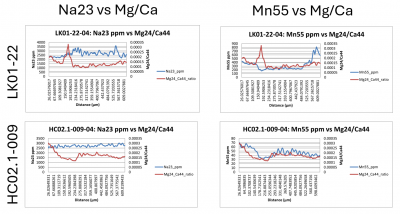
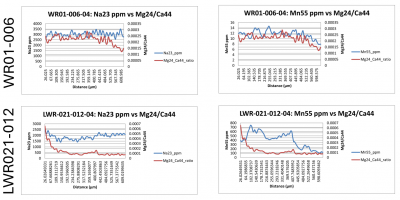
1. Na vs Mg/Ca
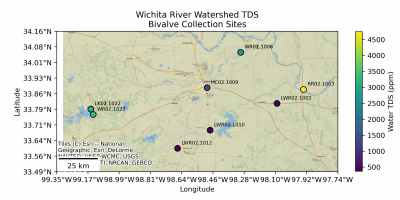
Across the Wichita River Watershed, we can see that sodium concentrations seem to reflect the overall west to east salinity gradient shown by the TDS values of the site locations as seen above in Figure 1. Interconnected Lake Kemp, Holiday Creek, and East Wichita River bivalve samples show relatively consistent Na, falling into a range between roughly 1000-2000ppm depending on point in the growth series. The specimen from the Little Wichita shows a much lower Na concentration falling consistently around 500ppm. This pattern validates prior TDS data of water from these locations, with strong evaporite influence in the samples from the Wichita River Watershed. The lower Na concentration in the Little Wichita River sample is consistent with its freshwater source of Kickapoo Lake to its west without the same evaporite influence. When plotted against Mg/Ca, Na shows little sensitivity to seasonal temperature fluctuations.
2. Mn vs Mg/Ca
Manganese displays strong spatial differences driven by local redox conditions. Lake Kemp and the Little Wichita River samples both seem to show Mn enrichments during intervals of low Mg/Ca, representing cooler periods. This is expected stronger reducing conditions during cooler periods, with lower rates of water cycling and oxygenation in more stagnant bodies. In these environments showing Mn enrichment, Lake Kemp and the Little Wichita, concentrations of Mn fall between 350-600ppm Mn. This is compared to the much lower concentrations of Mn in Holiday Creek and the East Wichita River with a more constant water inflow and water turnover, falling between 20-30ppm.
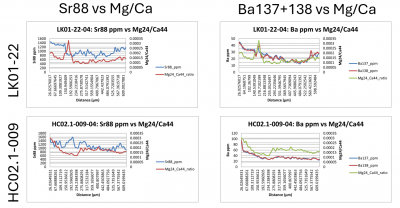
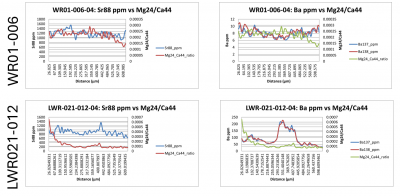
3. Sr vs Mg/Ca
Likewise to concentrations of Na, we can see that Sr concentrations seem to reflect similar consistency across the Wichita River Watershed falling into a consistent range of around 1000ppm with variability. The specimen from the Little Wichita also shows a low Sr concentration likewise to sodium, reflective of its different, more freshwater, source of water influx. This pattern validates prior TDS data of water from these locations, with strong evaporite influence in the samples from the Wichita River Watershed.
4. Ba vs Mg/Ca
Ba shows a trend of low concentrations across the Wichita Watershed, around 30ppm consistently for both Ba137 and Ba 138. We observe especially high concentrations and variability of Ba in the Little Wichita River Sample, with fluctuations ranging from around 50ppm-225ppm. Here, higher influence of terrestrial runoff may deliver a greater amount of Ba to the Little Wichita River compared to the Wichita River, which receives a greater influx of stream water from the west.
C. Improvement to Method
Some room for possible future work could involve expanding the spatial coverage of shell samples to better trace mixing of different bodies of water, especially water that may mix into Lake Kemp to lower its salinity compared to WR further east. In this study, only the fourth and most distal transect of each specimen was analyzed to capture the most recent hydrological data. Future work could also incorporate all 4 transects from current shell data to get a longer temporal record of the water chemistry in each location. An improvement that I could have made to this project would be closer observation when focusing on standards and samples when collecting laser ablation data for a more complete quality control protocol, since NIST612 had to be omitted as a result of misfocus.
D. Final Budget
- Original Estimated Cost:
- (8 hours of ablation) × ($60/hr) = $480
- Actual Cost:
- (1.752 hours of ablation) × ($65/hr)= $113.88