Results
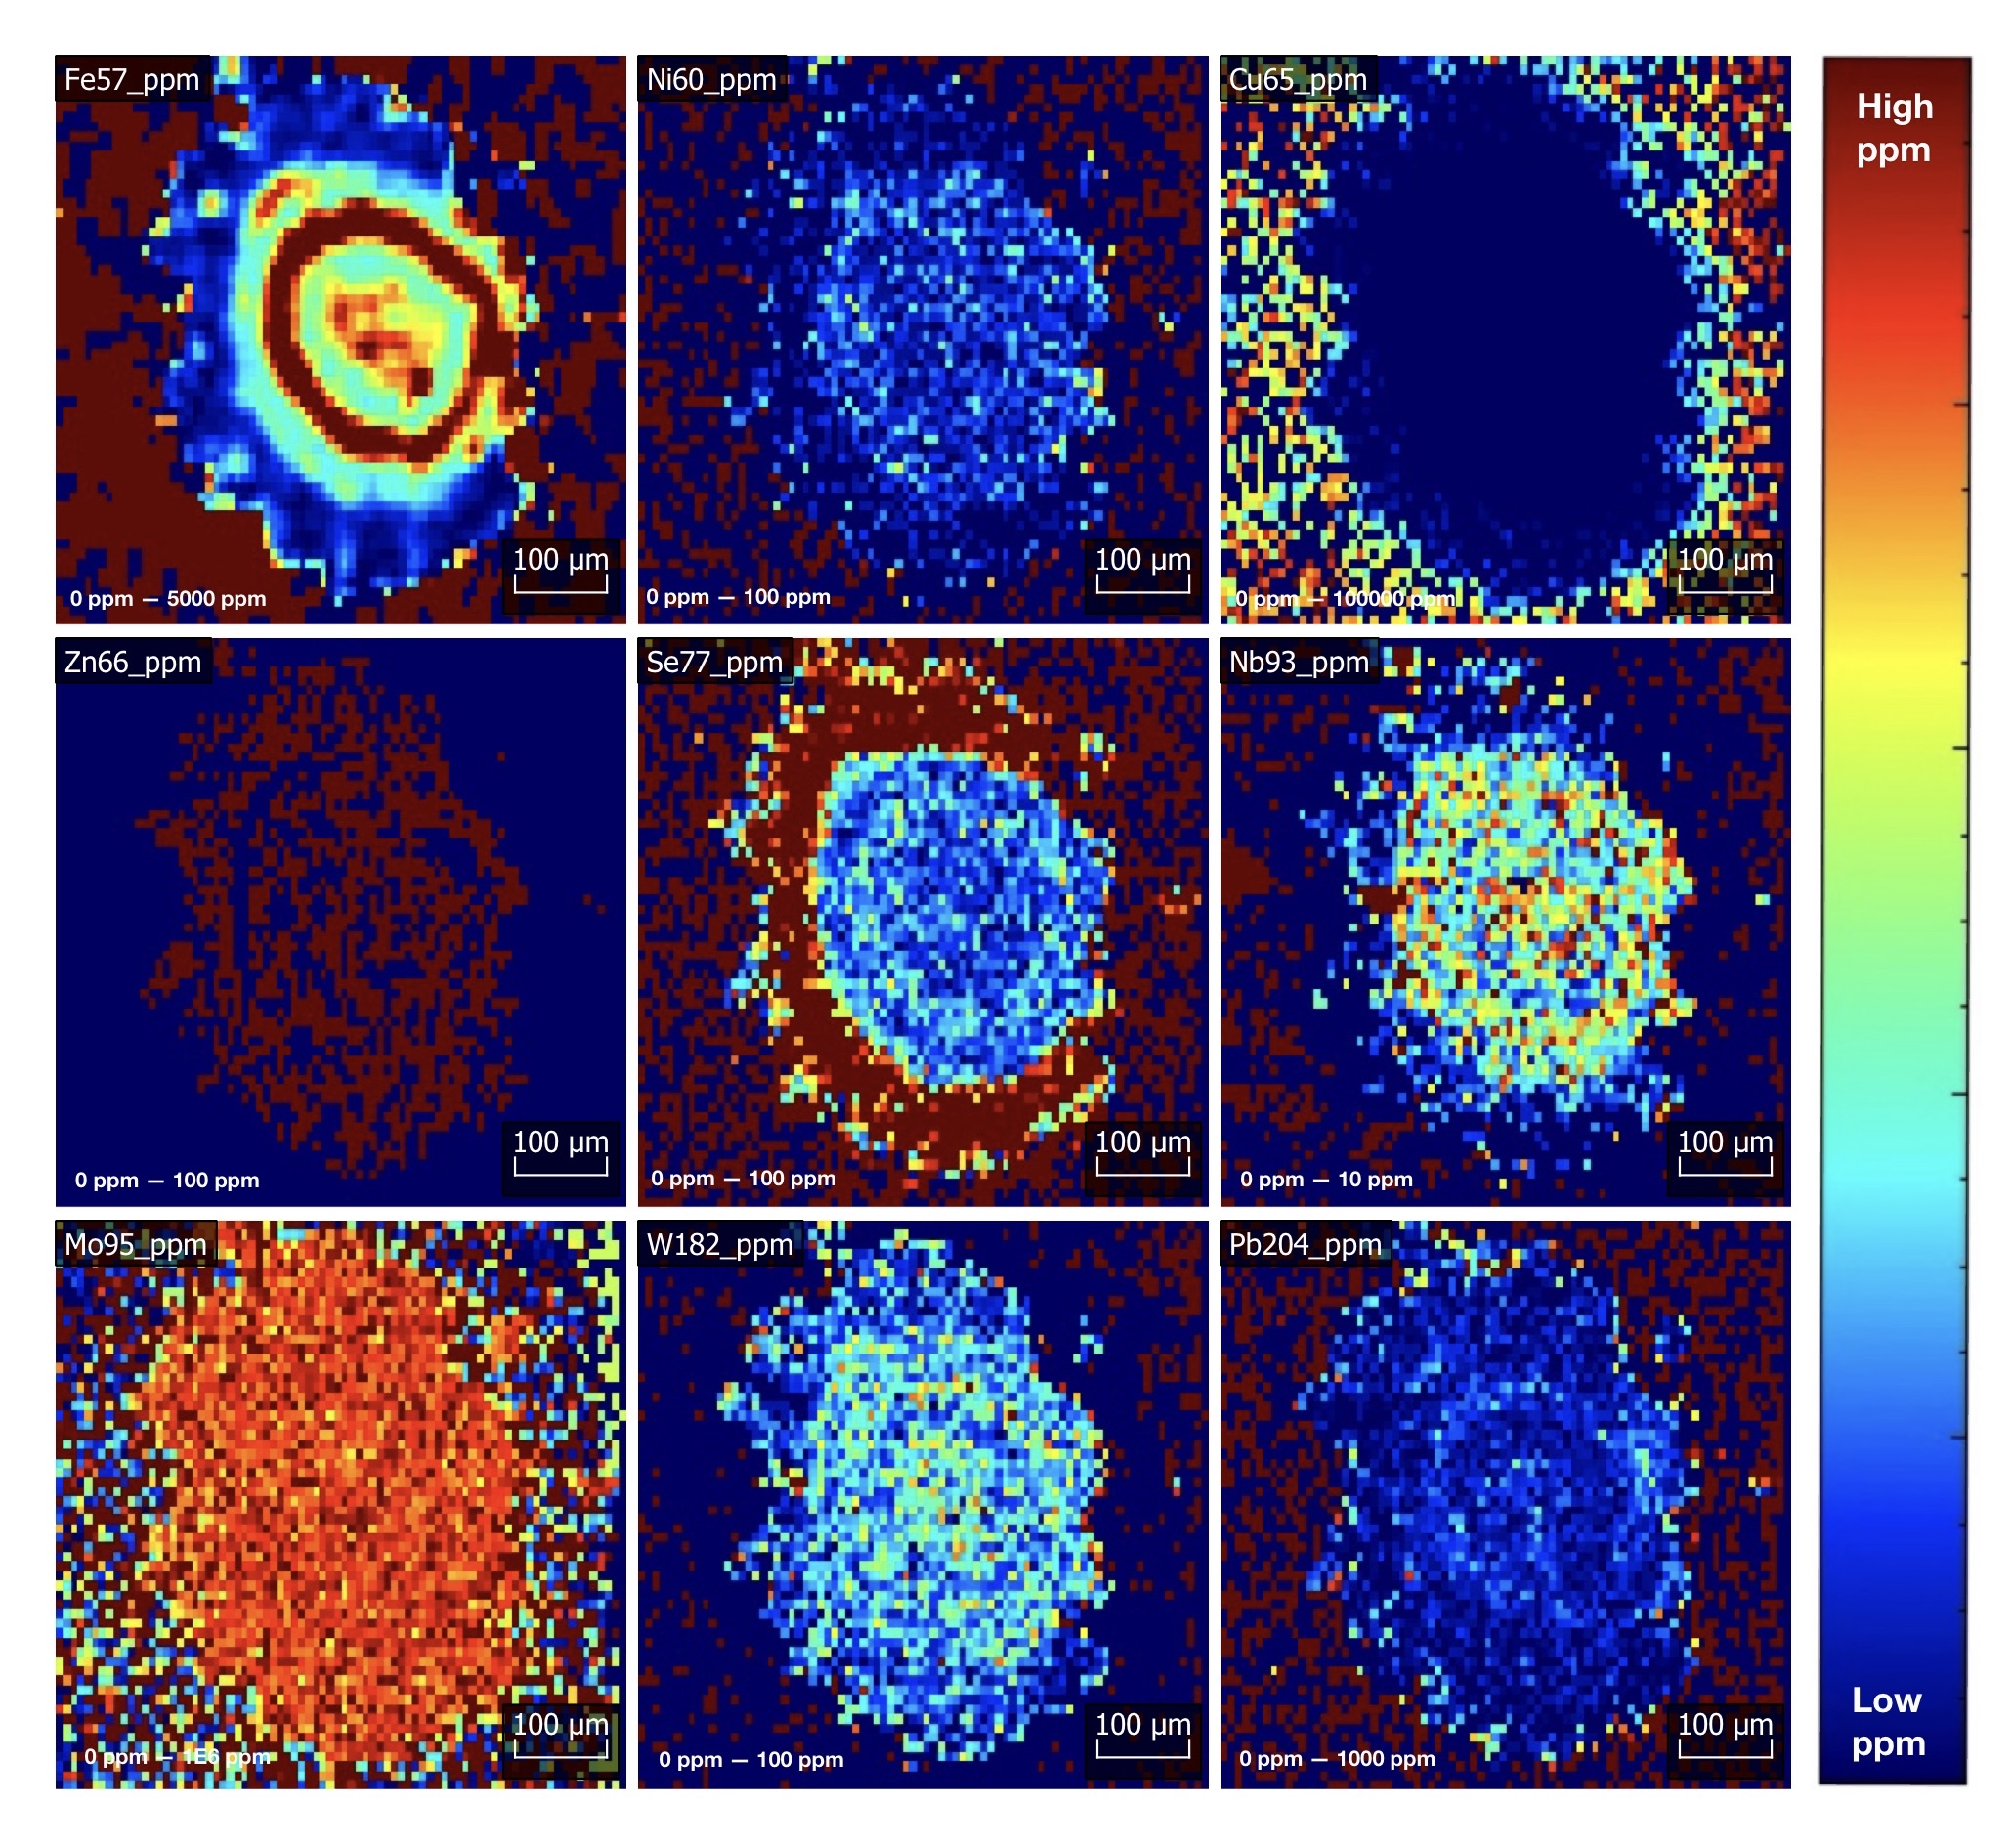
The LA-ICP-MS scans consisted of two separate sets, a series of line scans and two 2D maps. The line scans covered the full array of isotopes listed in the initial proposal. Though not every isotope yielded actionable results, often due to interference, most did. The second series of scans was to create two separate 2D maps of molybdenite. Both 2D maps used a 10µm resolution and scanned for a total of 10 elements, one being the internal standard (97Mo), and the other 9 being 57Fe, 60Ni, 65Cu, Zn66, 77Se, 93Nb, 95Mo, 182W, and 204Pb. Some of these isotopes would present issues, particularly 66Zn due to a strong interference. Others, including 93Nb and 204Pb had lesser issues that will be discussed later in the discussion section, hence why they are excluded from the line scan data table, but nonetheless yielded results for the 2D maps. Figure 5.1 is the first of the 2D maps; it is a relatively large grain of bladed molybdenite that will be used in the discussion to compare and contrast against Figure 5.2 which is the second of the 2D maps and is a molybdenite spherule.
Figure 5.1
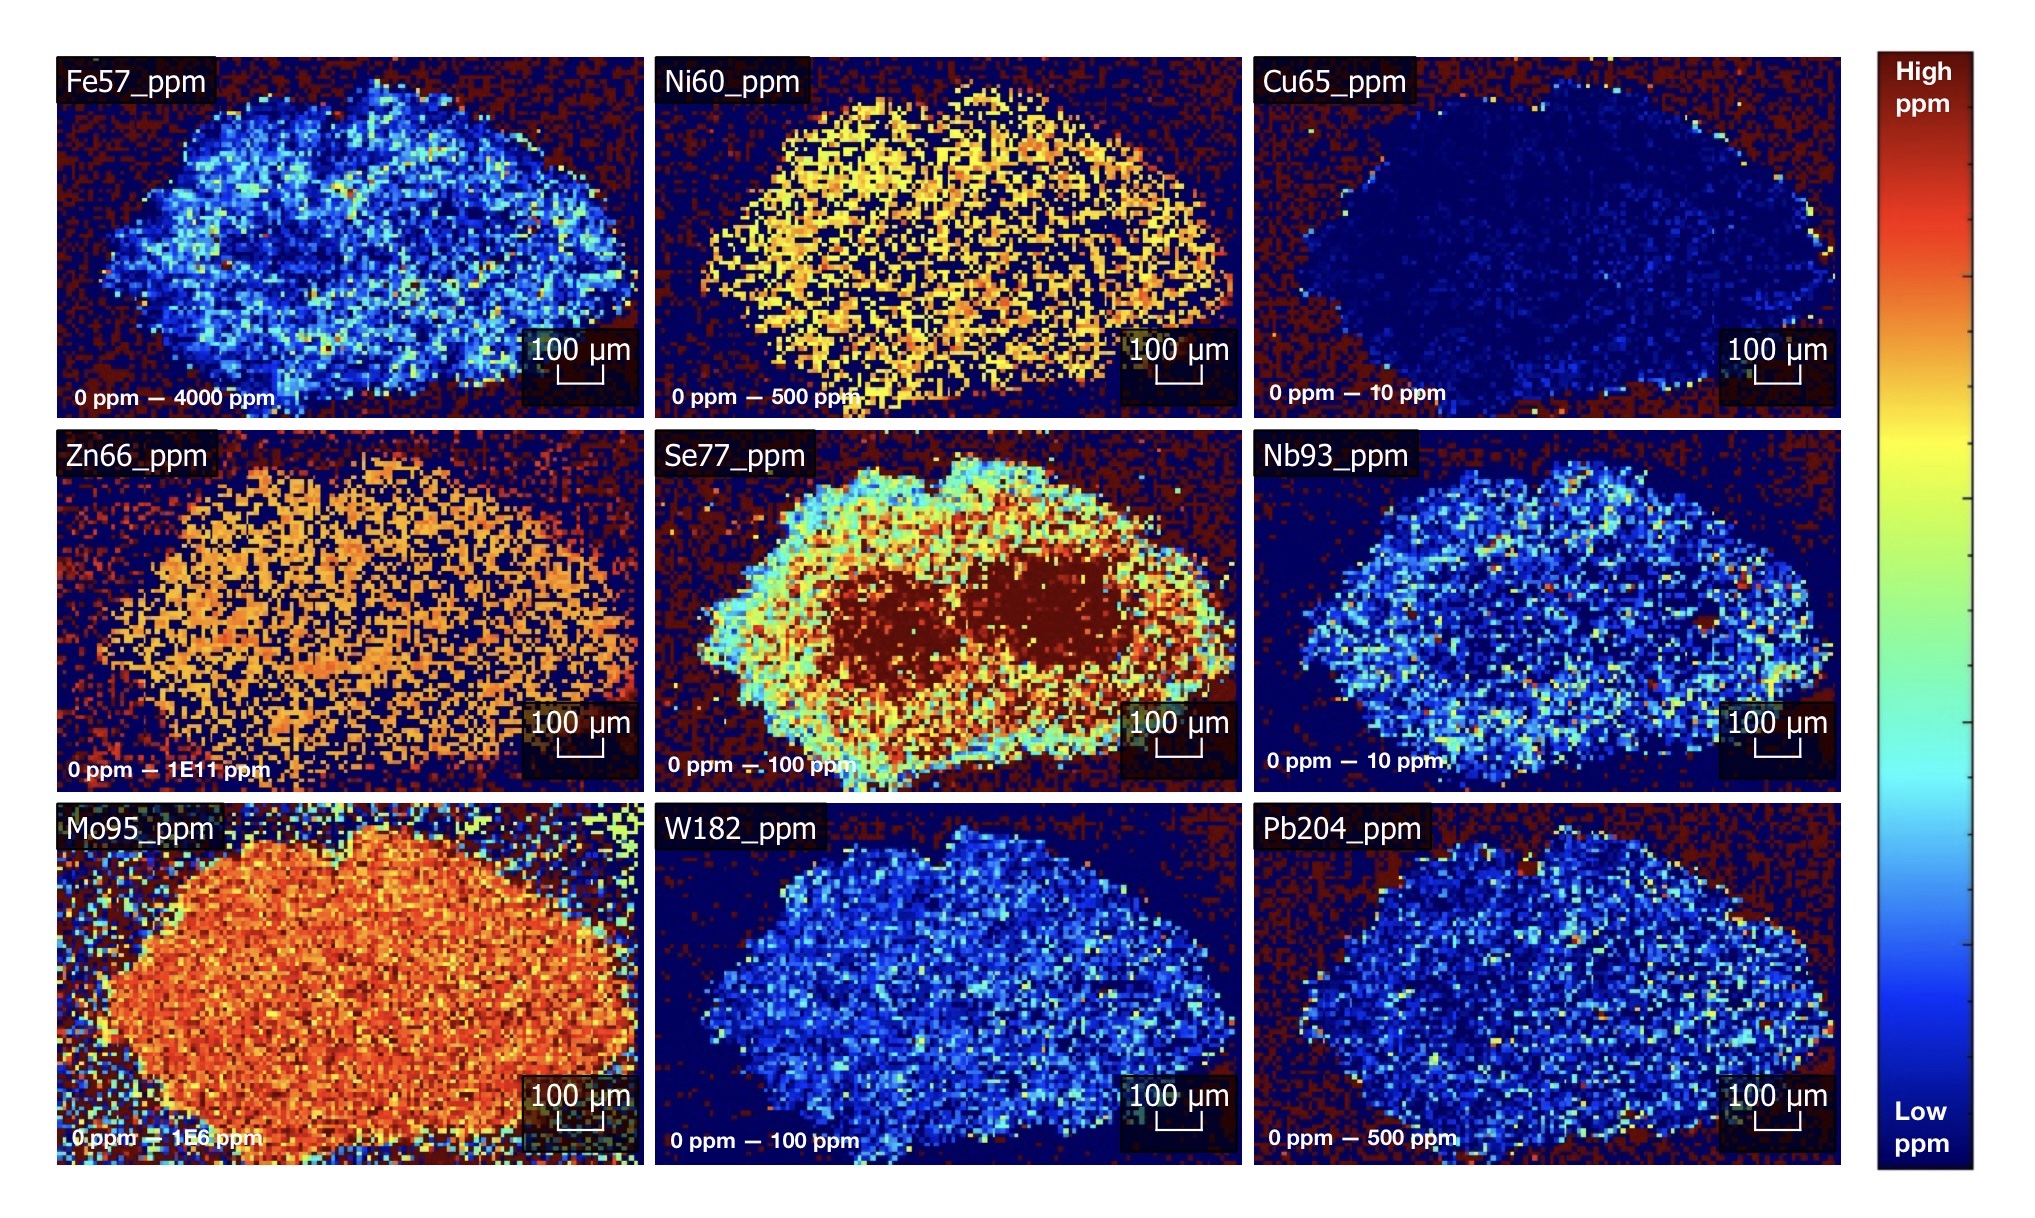
Figure 5.2
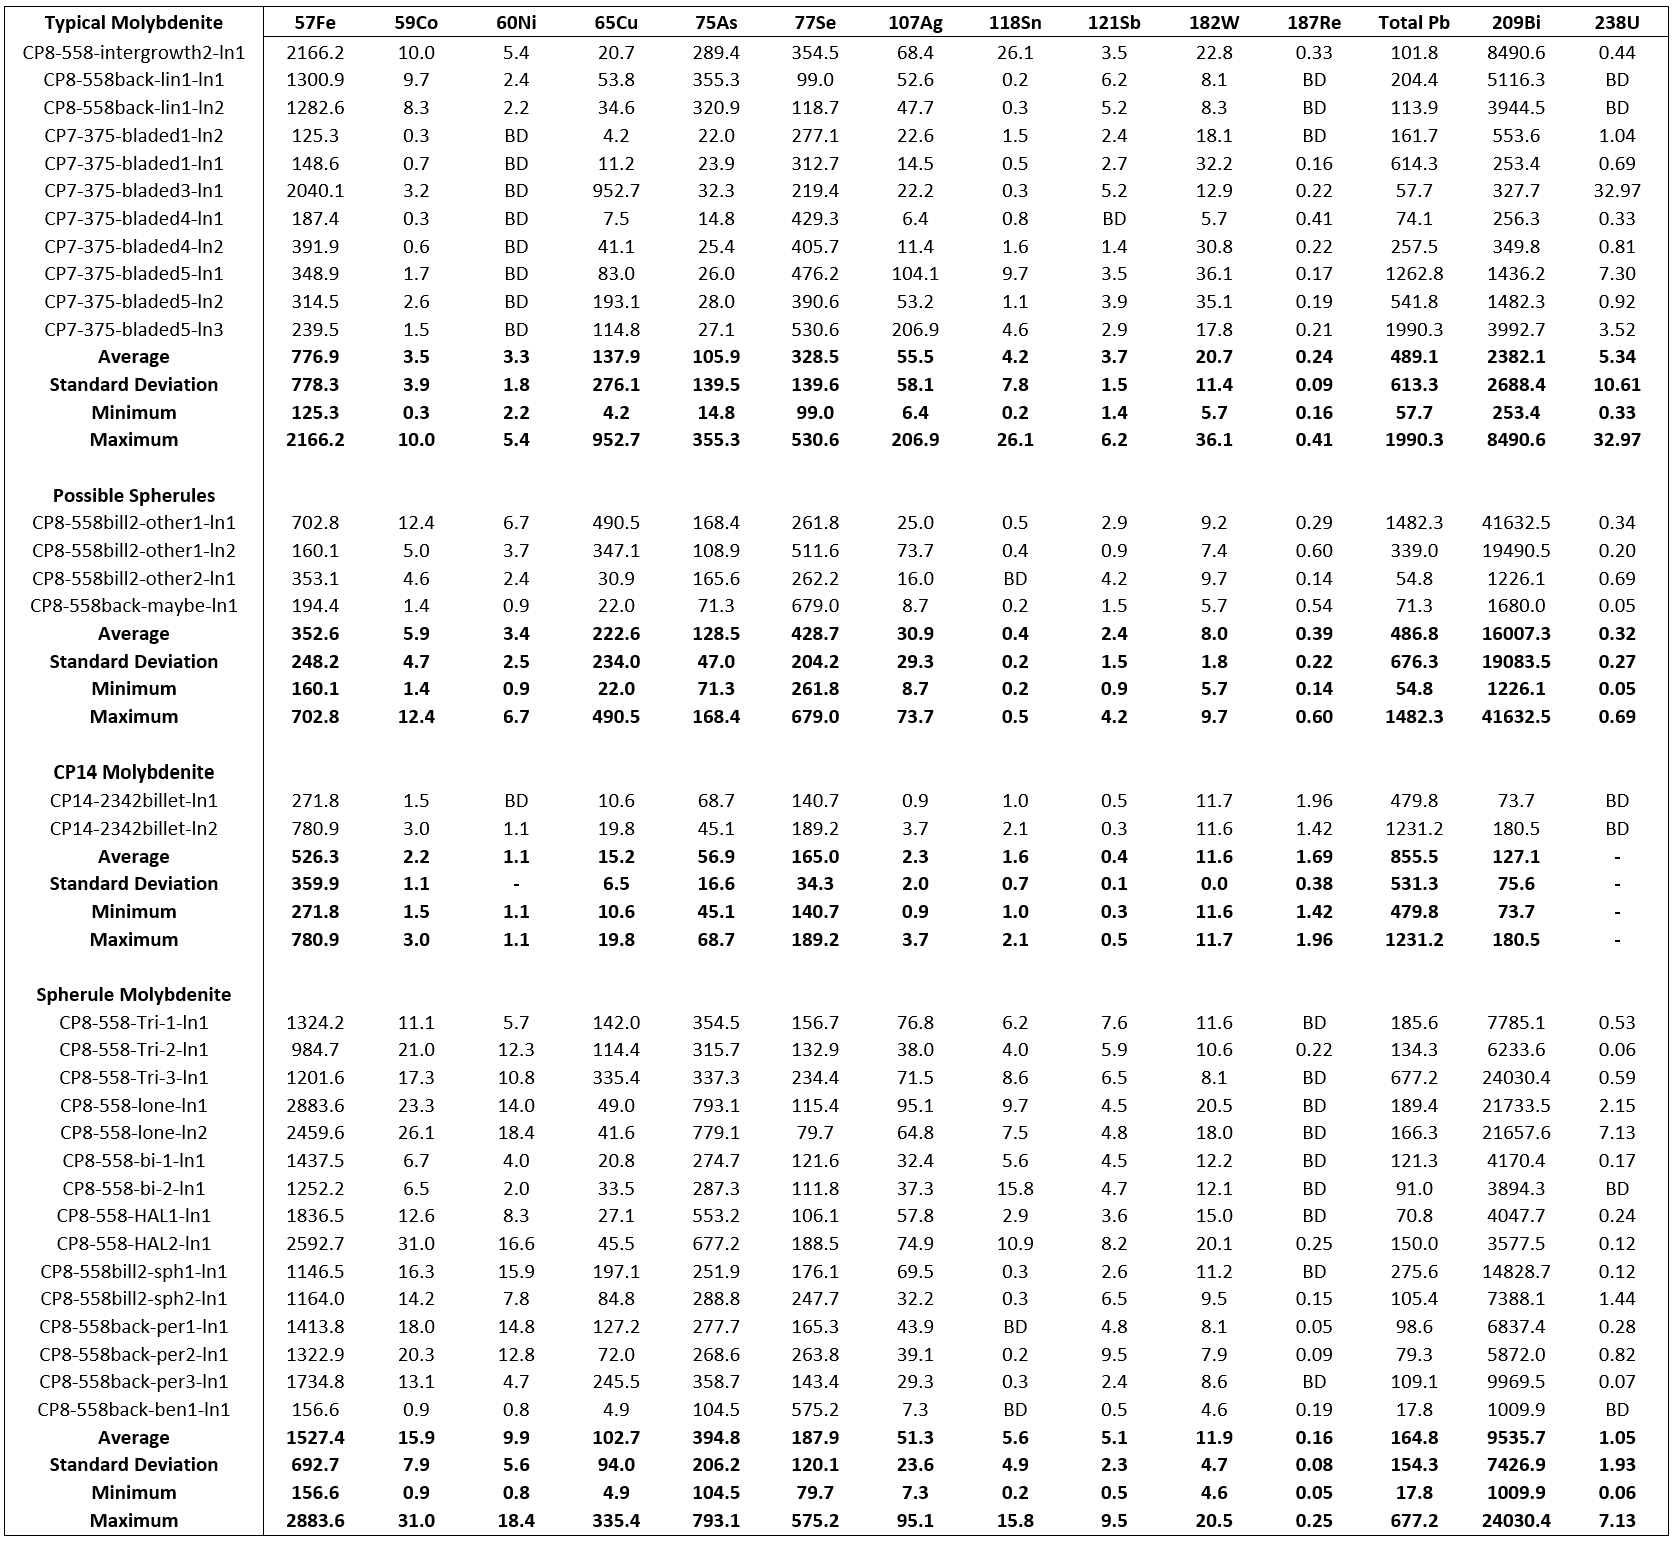
The results of the line scans are broken up into four categories. Category ‘Typical Molybdenite’ is reserved for molybdenite found within the thin section and billet that has a more common molybdenite habit, whether that be euhedral bladed or a more anhedral vein bound molybdenite. Category ‘CP14’ is reserved for common molybdenite habits found within the CP14-2342 thin section, broken out separately from the other regular molybdenite habits due to CP14 simply not having as good of exposures, the molybdenite here had more gaps, inclusions, and was smaller in size making unwanted contributions or skews to occur. Category ‘Maybe Spherules’ are grains that appear similar to the enigmatic molybdenite spherules but had some attributes that suggested that they may not be spherules, but rather bladed/typical molybdenite that simply had a similar shape. Finally, category ‘Molybdenite Spherules’ is reserved for positively identified molybdenite spherules, the focus of this experiment.
Spreadsheet of LA-ICP-MS results from Cave Peak Molybdenite. Values are in PPM.
Figure 5.3
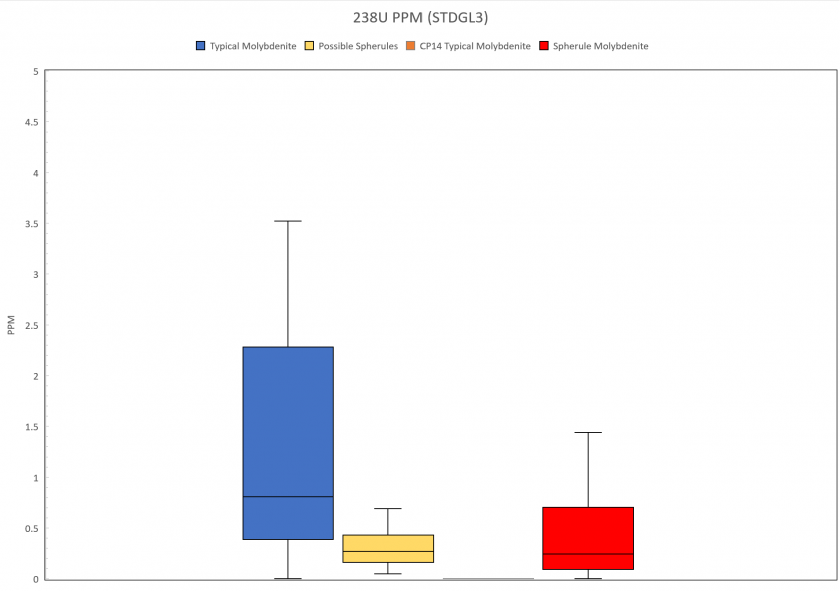
Below are box and whisker plots for each isotope within each of the four categories of molybdenite.
Figure 5.4
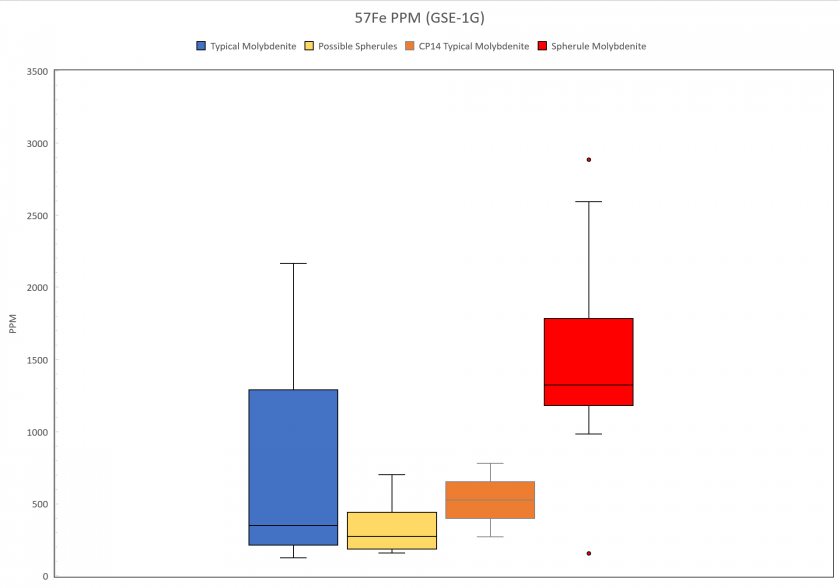
Figure 5.5
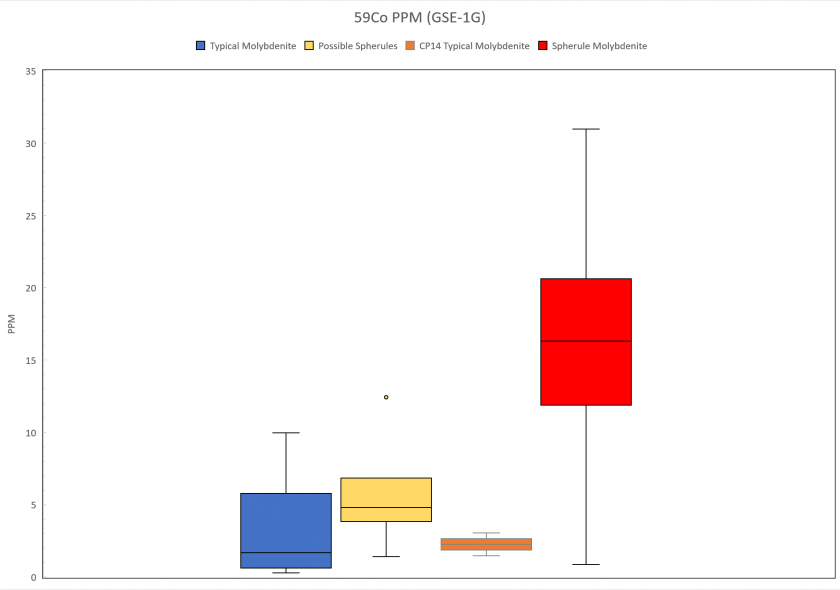
Figure 5.6
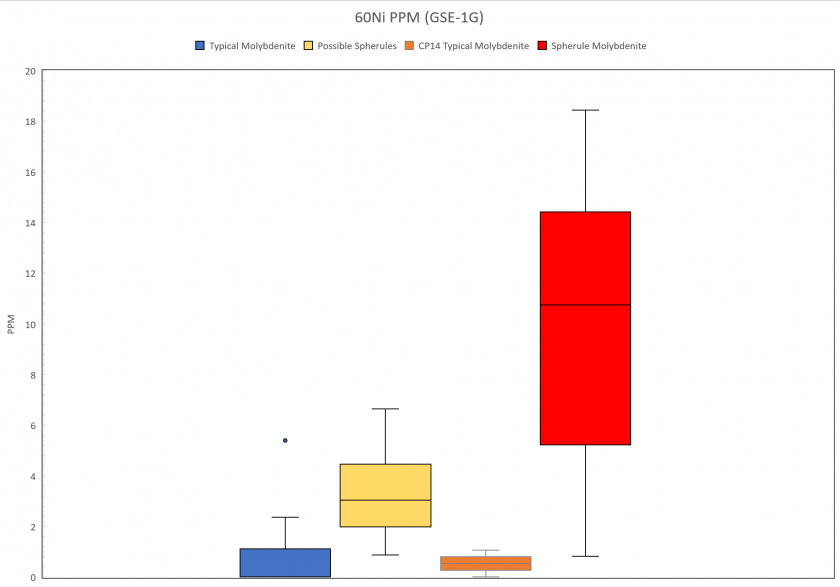
Figure 5.7
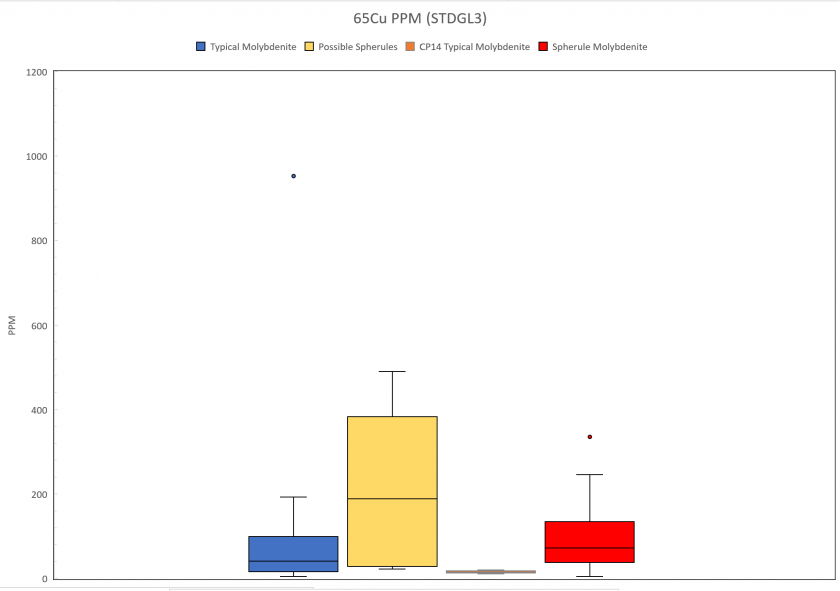
Figure 5.8
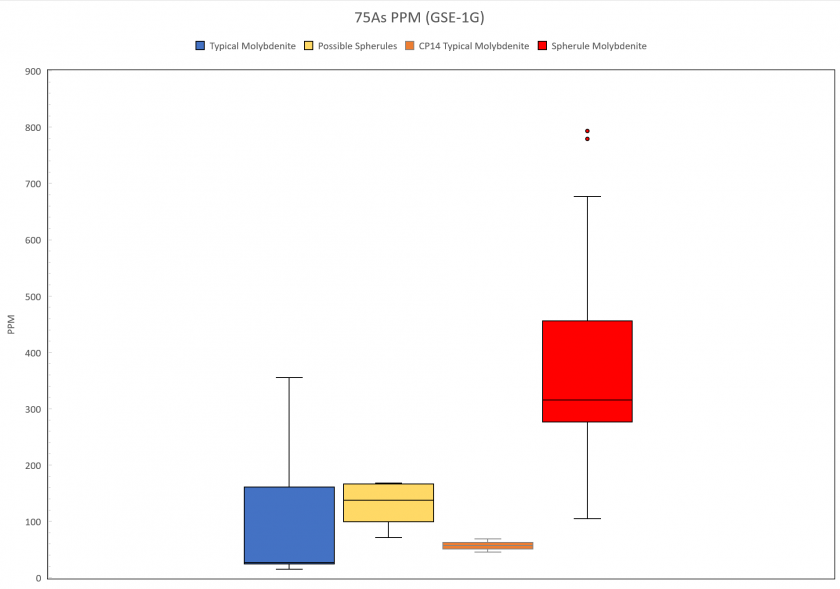
Figure 5.9
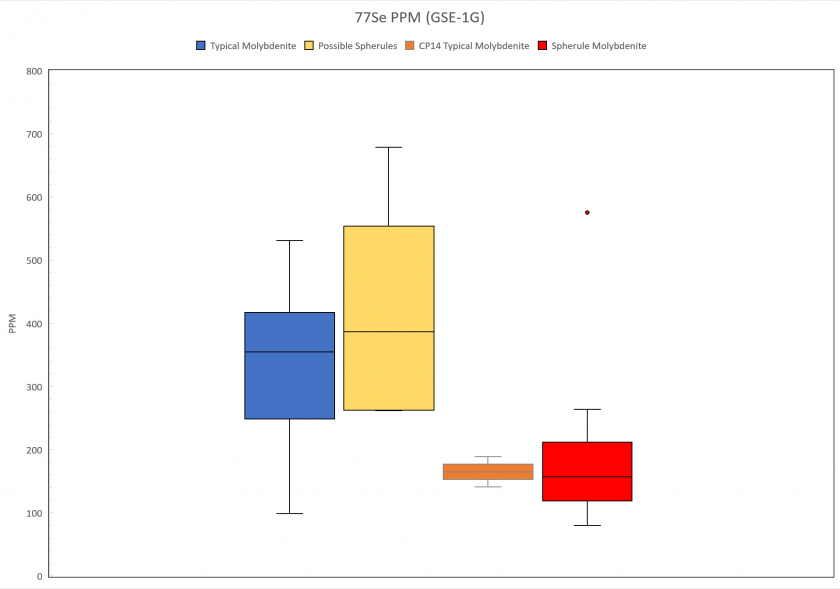
Figure 5.10
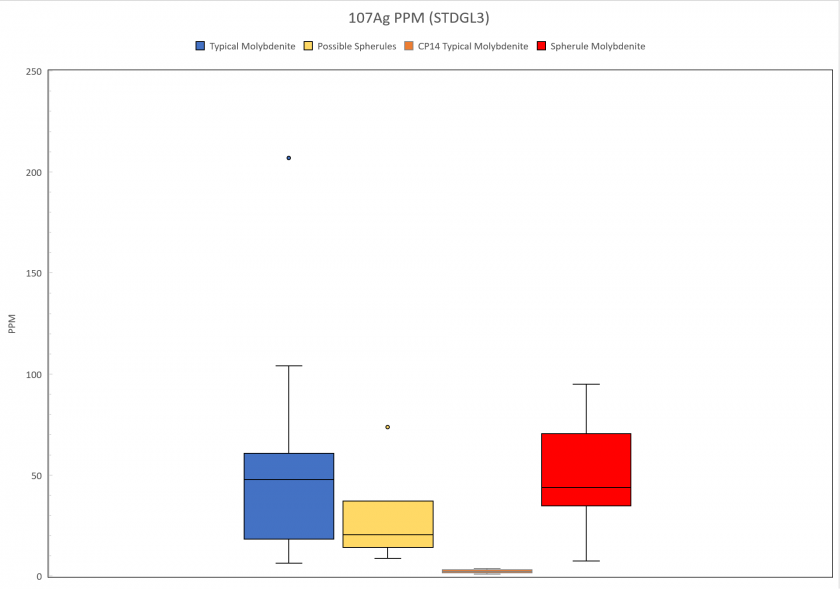
Figure 5.11
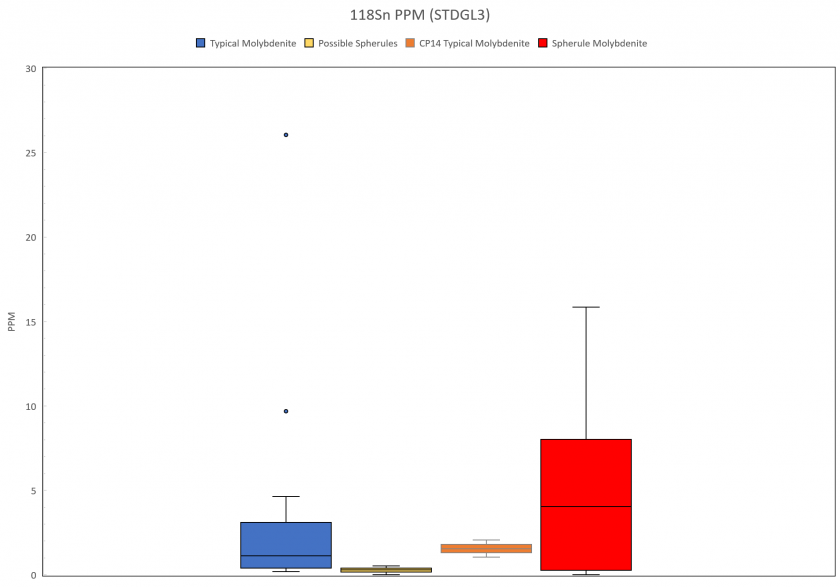
Figure 5.12
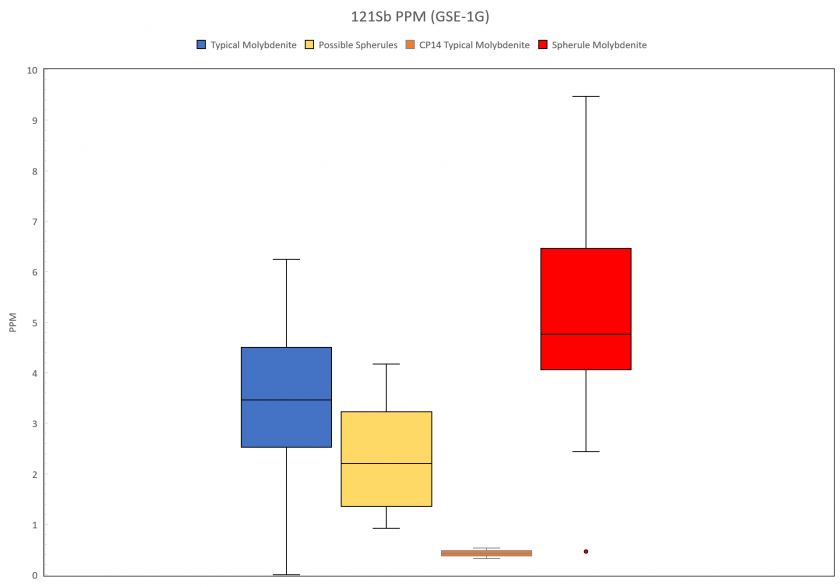
Figure 5.13
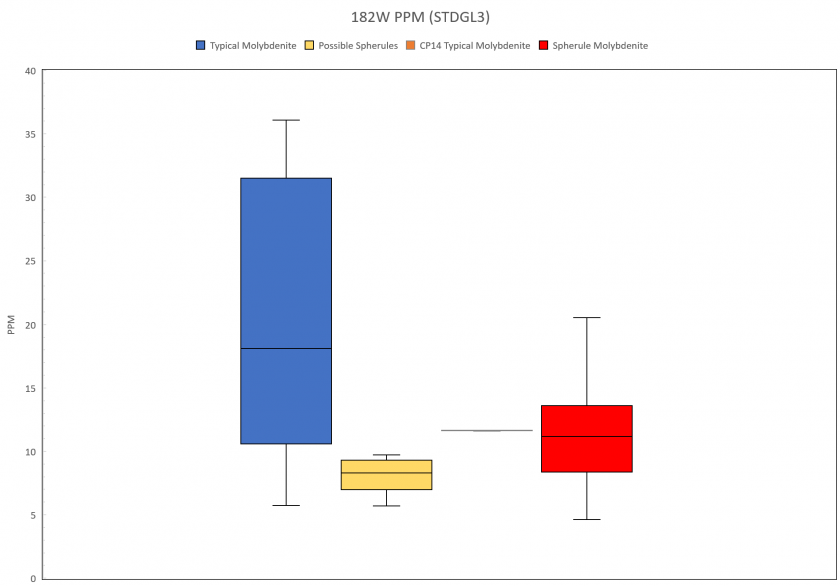
Figure 5.14
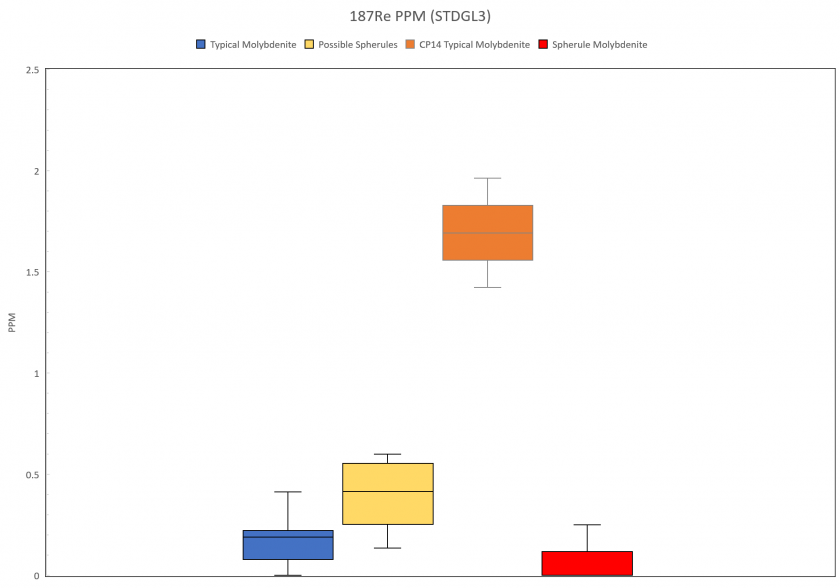
Figure 5.15
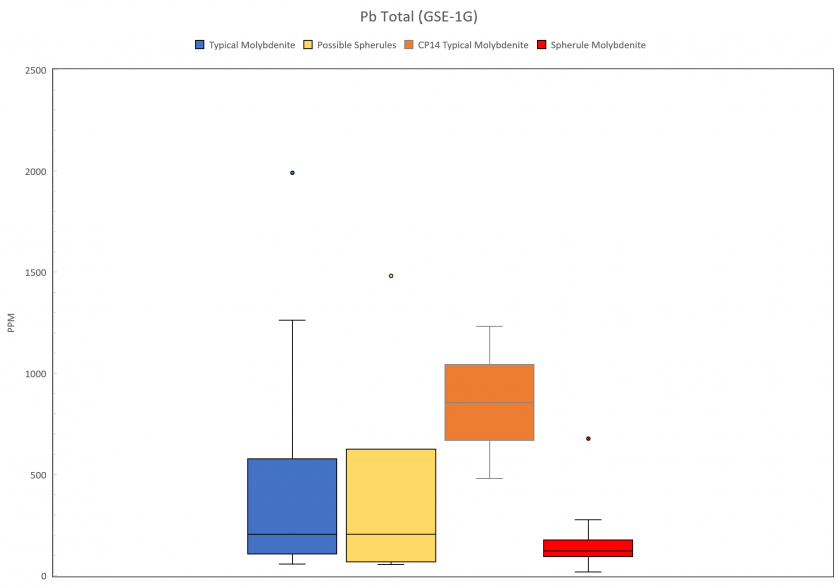
Figure 5.16
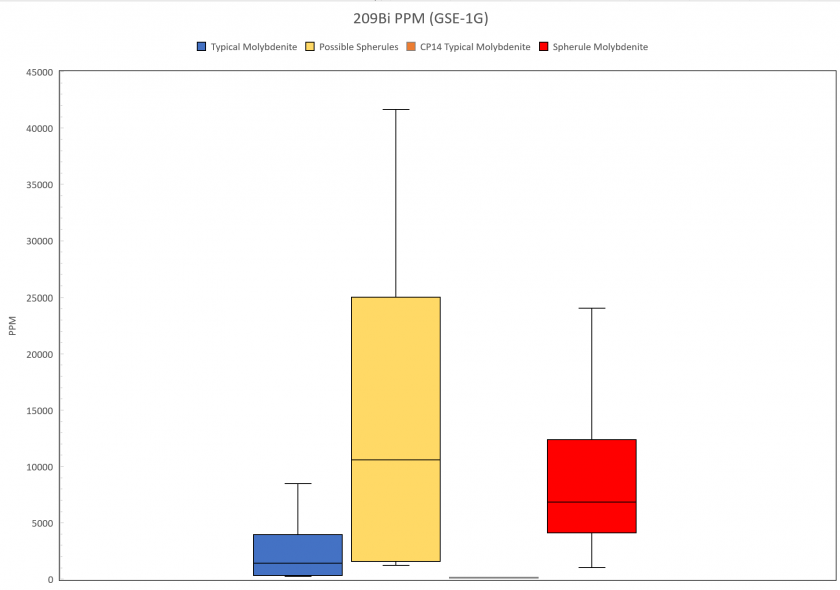
Figure 5.17