Proposal
Abstract
The Cave Peak intrusive complex hosts a porphyry molybdenum deposit emplaced in the late Eocene in Trans-Pecos Texas. The complex consists of three breccia pipes, with the largest of these pipes being 762m across, forming Cave Peak (Sharp, 1979). Local magmatism began ~39Ma, with a quartz latite-quartz monzonite porphyry plug forming a remnant body within the main breccia pipe 36Ma, and porphyritic quartz monzonite emplaced into the earlier phases at 32Ma (Sharp, 1979). Cave Peak, the largest pipe at the North end of the complex is the primary focus of this project due to the extensive work done on it shortly after it was discovered, including roughly 11600 meters of exploration core drilling done by both Union Carbide and Texaco during the late 1960’s and early 1970’s. This drilling showed at least 3 distinct zones of molybdenum mineralization, which has been a focus of later studies (Sharp, 1979). These 3 distinct zones of molybdenum mineralization and their associated cross cutting relationships have been known since the 1970s and strongly suggest multiple phases or ‘pulses’ of molybdenum mineralization. More recent work (Ugurhan 2018) has revealed that there are two distinct types of molybdenite (MoS2) at Cave Peak, with notably different habits. While the more common of the two appears platy or bladed and is vein controlled, there is also a disseminated variety of molybdenite often found hosted in blobs or fluorine minerals that is spherical and shows evidence of zoning. This spherical molybdenite habit is not known outside of Cave Peak. The goal of this project is to use LA-ICP-MS to establish if there is not just structural zoning, but also compositional zoning as has been shown in molybdenite within other deposits (Ciobanu 2013). Once this is determined, a point raster and/or bulk composition scans of the spherules and more common vein controlled-platy molybdenite will be taken using LA-ICP-MS. The aim of the project is to establish if there are compositional differences between more typical Cave Peak molybdenite, and this perplexing spherical molybdenite. Using trace element concentrations and ratios within the two types of molybdenite, a clearer picture of Cave Peak’s molybdenum mineralization history and timing will be painted, alongside uncovering clues about the cause and origin of this unique spherical molybdenite.
Research Objective
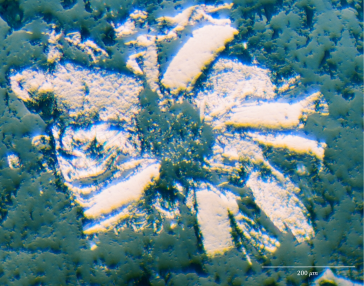
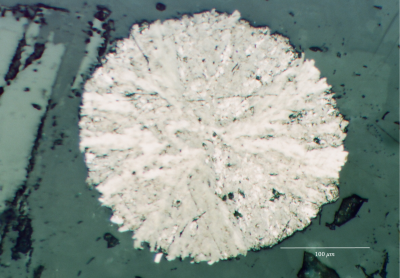
Unique to Cave Peak among porphyry molybdenum deposits is its style of molybdenite mineralization. Typically, molybdenite, the most common of the molybdenum sulfide minerals, forms within veins, often as a ‘railroad track’ coating along the vein rims. This is not always the case, with other modes of vein mineralization and disseminated molybdenite mineralization existing. Molybdenite may also take on a platy habit exhibiting cleavage, and when euhedral, a hexagonal or sometimes trigonal crystal structure may be present. Cave peak does exhibit more typical vein controlled molybdenite as its primary mode of mineralization. However, while much less frequent than vein controlled molybdenite, is a mode of mineralization unique to the Cave Peak porphyry molybdenum deposit. This unique mode of molybdenite mineralization consists of tiny spherules roughly 100-300µm in diameter. The spherules of molybdenite are surrounded by blobs of sodium-aluminum-fluorine rich melt and appear in many different configurations. While some are near perfect spheres, others closely resemble ooids while still some appear broken or non-uniform (Ugurhan 2018).
The formation of these spherules and their relationship to the intrusive phases and fluorine rich melt blobs is not fully understood. However, a thorough look into the trace element composition within these spherules could help provide key answers about their enigmatic formation, relationship to the melt blobs, and potentially aid in answering questions about the relative timing of Cave Peak’s molybdenum mineralization.
The goal of this project will be to establish the trace element composition of the molybdenite spherules alongside that of more typical vein molybdenite at Cave Peak. The isotopes that will be measured are: 9Be, 57Fe, 59Co, 60Ni, 65Cu, 66Zn, 75As, 77Se, 93Nb, 107Ag, 118Sn, 121Sb, 125Te, 182W, 185Re, 192Os, 204-208Pb, 209Bi, 238U. This will be done using a LA-ICP-MS. One of the initial goals of the project will be to establish if both Mo-spherules and platy/bladed Mo at Cave Peak are compositionally zoned. This is important as zoning can help establish changes in trace element composition within the melt as the molybdenite crystallizes and has been established to occur within molybdenite at other deposits using LA-ICP-MS (Ciobanu 2013). The foremost goal is to establish if the spherules have similar or different trace element compositions to more typical molybdenite at Cave Peak. If this can be established and data proves adequate from the LA-ICP-MS scans, variation within the trace element composition may help answer key questions about the origin of the spherules, and the different stages and timing of Cave Peak’s Mo mineralization.
Regular Molybdenite vs Spherical
Discussion of Significance
Cave Peak is a porphyry molybdenum deposit and has gained past attention as such both due to economic and research interests (Sharp 1979, Audétat 2010, Ugurhan 2018). However, it is not molybdenum alone that is enriched within Cave Peak, with several other critical minerals and REE’s having been concentrated within the system and mineralizing in the deposit. The primary rare earth elements and critical minerals enriched at Cave Peak are beryllium, copper, zinc, niobium, silver, tin, tungsten, and lead. This isn’t to say other REE’s and critical minerals aren’t enriched at Cave Peak as well, but rather the aforementioned are of high enough grade to be of economic interest. With such high concentrations of these minerals within the deposit, it stands to reason that some may have been incorporated within the molybdenite that was also mineralizing within the system. What isn’t fully understood is the timing of the mineralization of Mo, relative to other minerals within the deposit. Previous research has shown low correlation between other minerals and molybdenum at Cave Peak, with only a small degree of Mo-Cu correlation, and no correlation between the remaining minerals. However, analysis of these minerals as trace elements within the two habits of molybdenite could provide key clues as to if they were formed during separate mineralization events, alongside the timing of these two phases of molybdenite mineralization, relative to that of other minerals within the deposit. If compositional zoning proves present, it could further enhance the timeline of mineralization by identifying peaks and troughs of these minerals as trace elements within the molybdenite if the zoning is large enough to be resolved. By analyzing the stable isotopes 9Be, 57Fe, 59Co, 60Ni,63-65Cu, 66Zn, 75As, 77Se,93Nb, 95Mo, 107Ag, 118Sn, 121Sb, 125Te, 182W, 192Os, 204-208Pb, 209Bi, and 238U using LA-ICP-MS, the goal is to gain a representative image of the concentrations of these isotopes within the two different habits of molybdenite at Cave Peak, and therefore an idea of their concentrations of them within the melt at the time of mineralization for each molybdenite habit.
Previous research regarding Cave Peak did attempt to date the two different molybdenite habit at Cave Peak using ICP-MS and 187Re-187Os dating. However, while a date was arrived at for the more typical molybdenite habit, it failed at dating the spherical molybdenite. The reason why is not fully established but is likely either due to the sample being too small or from lower-than-expected rhenium content within the spherules. To help establish the cause of past difficulties, both 192Os and 185Re will be analyzed. While the primary goal of this is to find the cause of previous failed dating attempts alongside using rhenium and osmium as trace elements for concentration comparison between the two molybdenite habit, mass 187 will also be analyzed since 185Re and 192Os are being analyzed too in case values to prove sufficient to date. However, as previously mentioned, obtaining a radiometric date is not one of the primary goals of the project or this analysis.
The remaining isotopes that will be analyzed, those being 9Be, 57Fe, 59Co, 60Ni,63-65Cu, 66Zn, 75As, 77Se,93Nb, 95Mo, 107Ag, 118Sn, 121Sb, 125Te, 182W, 192Os, 204-208Pb, 209Bi, and 238U are important due to their prevalence as trace elements within ICP-MS analysis, and more particularly molybdenite analysis. These isotopes will add important data to the data pool for analysis and trace element ratio comparisons. Furthermore, 57Fe and 60Ni, alongside previously mentioned 65Cu, 66Zn, and 93Nb will be critical for the initial high resolution scan line when identifying if compositional zoning is present within trace elements since these are likely to be some of the most common trace elements at Cave Peak. Beyond this, Ciobanu 2013, which analyzed trace elements within molybdenite of Carlin deposits in Nevada using LA-ICP-MS included these minerals in the study. While the deposits the molybdenite is sampled from in Ciobanu are very different from Cave Peak in geographic region and formation, and source, likely having different trace element ratios and concentrations, having a reference point on these trace element values from another paper will aid in spotting anomalies and act as a crucial source of comparison for the values and results obtained in this study.
Review of Relevant Work
The Molybdenite from this study originates from the Cave Peak breccia pipe complex in Culberson County, Texas. As described in Sharp (1979) These breccia pipes, located on the Sierra Diablo mountain range, consist of three pipes, a main quartz latite-quartz monzonite porphyry associated plug and two rhyodacite associated plugs. The intrusion began some time around 39 Mya with the emplacement of a rhyodacite plug and breccia pipe. North of which was another set of plug and pipe. Finally, the Cave Peak breccia pipe formed adjacent to the previous pipe. After brecciation of the main pipe, mineralized zones of molybdenum developed. Lastly, these pipes as well as the molybdenum were cut by porphyritic quartz monzonite around 32 Mya. This paper provides a good overview into the geological setting at and around Cave Peak .
Our method will in most part come from Ciobanu et al. (2012) where they studied two previously analyzed deposits of molybdenite to demonstrate how LA-ICP-MS can be used to document trace element patterns to corroborate successive events in the deposit’s history.
Ciobanu et al. used a 7500 mass spectrometer coupled with a UP-213 laser ablation system to analyze the molybdenite samples and acquire trace element data. They used an in-house standard STDGL2b2 for calibration. Isotopes that were measured include: 57Fe, 59Co, 60Ni, 65Cu, 66Zn, 75As, 77Se, 107Ag, 118Sn, 121Sb, 125Te, 182W, 185Re, 197Au, 204Pb, 206Pb, 209Bi, and 238U. Analysis of standard were done at 10 Hz laser frequency and 80 μm spot size while molybdenite samples were done at 5 Hz and 35 μm spot size. The total measuring time per sample was 90 seconds; 30 seconds measuring of the background with the laser turned off and 60 s measuring with the laser on.
Uncertainty in the molybdenum standard STDGL2B2 is around 6%. This uncertainty is spread to all analyzed elements in the study since molybdenum is used as the internal standard. Rhenium uncertainty is believed to be of similar magnitude. Thus a total error between 20-40% is estimated for the Rhenium concentrations.
Molybdenite samples from both the Hilltop and Boddington deposits show lamellar or aggregates grains with common kinks or folding. Bismuth and galena inclusions were present throughout the samples. LA-ICP-MS was targeted on homogenous areas of grains that would be analyzed to help understand any variation in regard to different grain textures. Molybdenite grains from a Hilltop sample (HT-X) showed richer concentration of Re compared to the others. A grain from this sample stands out by having a coarse lamellar core surrounded by fine-grained cemented chalcopyrite and silicates. The grain’s inner core shows low Re concentration compared to its outer core. Contrary to Hilltop, Boddington samples show Re to be homogeneously distributed throughout the grains.
This difference in trace element distribution shows that trace element distributions of Molybdenite can be used to interpret mineralization histories of the samples. It is our goal in our own study to figure out if the same can be done by us to interpret both morphological types of molybdenite.
Early in the project process we struggled to find a even a mention of another standard to use in addition to STDGL2LB2. Sulfide standards appeared to be far and few in between with most studies using resorting to using silicate standards. Zhi Ren et al. (2018) used the GSG-1G basaltic standard alongside STDGL2LB2 for calibration. The study conducted by Zhi Ren et al. (2018) looked at trace element amounts in the Shapinggou deposit located in the Dabie Orogenic Belt in eastern China. Isotopes that were measured were, 27Al, 57Fe, 59Co, 60Ni, 65Cu, 66Zn, 75As, 77Se, 88Sr, 90Zr, 107Ag, 111Cd, 118Sn, 121Sb, 125Te, 172Yb, 182W, 185Re, 205Tl, 208Pb, 209Bi, and 238U. These were selected in order to avoid isobaric and polyatomic interferences that may have arose otherwise. Laser frequency, spot size, and run time for the standards and the molybdenite samples were identical to that of Ciobanu et al. (2012). The data from the study shows that highly variable metal concentrations, such as Re, Pb, and Cu, are present in the Molybdenite from the area. In addition to this, Re concentrations as well as Mo/Cu ratios decreased alongside decreasing temperatures. Opposite to this, concentrations of Cu, W + Sn, as well as Re/Cu and Co/Ni ratios increased.
Audétat (2010) findings suggests that the brecciated Cave Peak and Marble Canyon, locations which are linked in their history and formation, show an evolution from mafic magmas to more felsic as you progress to the Cave Peak locality. By plotting incompatible trace element abundances from melt inclusions Audétat found linear trends showing 100 times the average bulk upper continental crust composition suggesting these felsic magmas originated from a mafic source and transitioned to felsic by fractional crystallization. Molybdenum concentrations also increased from 4 ppm to 12 ppm as the magma shifted from mafic to felsic composition. This Molybdenum content later decreased to 5 ppm which suggests that it was removed from the melt.
Perhaps the most in depth study on Cave Peak molybdenite comes from Ugurhan (2018). In his thesis, Ugurhan suggests a possible connection between two plutons in the area: Cave Peak and Marble Canyon. A look at Al2O3, K2O, Fe2O3, MgO, CaO, TiO2 and P2O5 amounts in both locations show a trend from silica poor magma to silica rich magma. Ugurhan states that this trend indicates differentiation of the magma through time; becoming more silica rich when reaching the Cave Peak location. This is in agreement with Audétat (2010) as that study’s trace element trends point towards fractional crystallization occurring. Audétat and Ugurhan’s findings both point towards Cave Peak molybdenite coming from fractional crystallization.
Materials and Methods
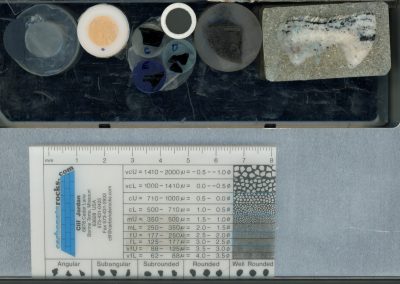
Samples exist in the form of both thin sections and polished billets. Typical molybdenite samples are spread across 2 thin sections with multiple samples in each. Spherical molybdenite exists in the form of both thin section and polished billet, with both thin section and billet coming from the same DH and intercept. There are multiple spherules in each of these that are suitable for analysis. Ideally the thin section will be the primary piece used for analysis, but if more samples prove necessary upon start of analysis, the billet will be used supplementary.
We plan to use a laser ablation technique with an Agilent mass spectrometer in order to acquire trace element data. We will use three different standards for calibration, the first being the aforementioned STDGL3 standard and the second being the OREAS-460-P standard. At the moment, it is possible that a 3rd standard, that being a USGS basalt glass GS(X)-1G standard will be used for Re/Os in conjunction with the STDGL3 standard, though this is currently under discussion as dating is not one of the primary goals of the project. Using the laser ablation technique discussed earlier, we will look at the previously discussed 9Be, 57Fe, 59Co, 60Ni, 65Cu, 66Zn, 75As, 77Se, 93Nb, 107Ag, 118Sn, 121Sb, 125Te, 182W, 185Re, 192Os, 204-208Pb, 209Bi, 238U, to determine if there is any significant differences between the different molybdenite habits. Ideally we will like to see if any zoning is present in the grains we plan to do 2D maps for in the hopes to see some different compositions in the bands.
Possible Outcomes
Cave Peak has long been assumed to have had multiple phases of molybdenum mineralization due to the cross-cutting relationships between the porphyritic quartz monzonite (PQM) unit and the mineralized zones (Sharp 1979). However, the exact nature of these different mineralizing phases isn’t fully understood. Ugurhan 2018 first described the two distinct habits of molybdenite at Cave Peak, potentially opening the doors to better understand how the multi-phase mineralization occurred if trace element composition proves to differ between the two types of molybdenite. Furthermore, this unique spherical molybdenite isn’t known to exist elsewhere and the conditions and cause behind its formation remain enigmatic. Using LA-ICP-MS, this project hopes to analyze both habits of molybdenite at Cave Peak to gain a better understanding of the timing and relationship of molybdenite with other critical minerals and REE’s at Cave Peak, alongside potential lithological association. Furthermore, trace element analysis may lead to key findings regarding more significant compositional differences between spherical molybdenite and more common habits, as well as clues as to the cause, setting, and origin of these peculiar spheres.
Time Frame and Budget
The time frame of the project spans until December 7th, 2023 with the LA-ICP-MS analysis taking place on November 17th. The pre-ablation and actual line scans were conducted from around 1pm to 4pm and the 2D maps were pre-ablated and scanned from 5pm to around 6pm. While thin sections and billets already exist, polishing was required of some of the smaller samples. While polishing we cut the thickest billets into thinner pieces that could also be used for ablation. The entire cutting and polishing of already existing and new samples took roughly an hour. The primary cost lies not in the LA-ICP-MS run time nor sample procurement, but rather with the price of the standards. While already possessed by UT Austin, the STDGL3 sulfide standard can cost roughly $2,100. Thankfully, this standard as well as the GSE-1G basalt glass standard were already in possession of the Jackson School. In addition to these two, we decided to purchase and use the OREAS-460-NP sulfide and ore standard from the MyStandards website. This standard was sponsored my Dr. Nathanial Miller’s Q-ICP-MS lab. We chose OREAS 460-NP due to it bearing compositional resemblance to STDGL2B2 used in Ciobanu et al. (2012) and its updated version (STDGL3) used in this experiment.
In summary, we chose to use a total of three standards for our project.
STDGL3 sulfide standard,
GSE-1G basalt glass standard
OREAS-460-NP sulfide and ore standard