Results
| Element | West Campus analysis levels maximum (ppb) | WHO/EWG limit levels (ppb) |
| Aluminum (Al) | 8.31 | 200 |
| Vanadium (V) | 49.59 | 1000 |
| Chromium | 2.17 | 100 |
| Manganese | 4.12 | 100 |
| Copper | 8.44 | 1300 |
| Arsenic | 1.01 | 10 |
| Selenium | 0.18 | 50 |
| Strontium | 234.4 | 1500 |
| Barium | 68.41 | 2000 |
| Lead | 0.15 | 10 |
ICP-MS Analysis results in excel format: Results.xlsx
Measured concentrations of trace and heavy metals in both bottled and West Campus tap water samples fell within ranges considered acceptable when compared to guideline values reported by the World Health Organization (WHO) and benchmark levels summarized by the Environmental Working Group (EWG). For regulated toxic metals such as As and Pb, all samples were below the EPA maximum contaminant levels of 10 µg/L, and were generally consistent with WHO guideline values. Concentrations of Cd, Cr, Cu, Zn, Mn, Fe, Ba, Sr, and Se were also within expected ranges for treated municipal water and commercially bottled waters, with most values well below health-based thresholds. While EWG health-based guidelines are often more conservative than federal regulatory limits, measured concentrations typically remained below or near these benchmark levels, particularly for trace metals detected at low-ppb concentrations. Overall, the data indicate that both bottled and West Campus tap waters exhibit metal concentrations consistent with safe drinking-water standards, supporting the conclusion that observed differences between sources reflect natural variability, treatment processes, and distribution infrastructure rather than exceedances of health-based limits.
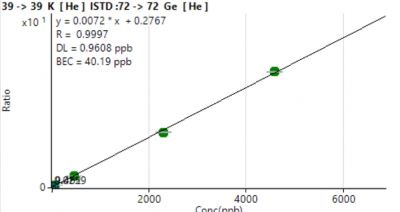
Linearity of Multi-Point Calibration
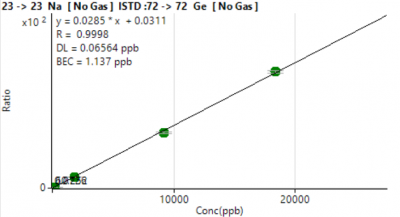
Six-level external calibration curves were generated for all analytes. Calibration responses increased monotonically across 3–4 orders of magnitude, with exceptionally strong linearity (R² ≥ 0.9993 for all masses; Table 1).
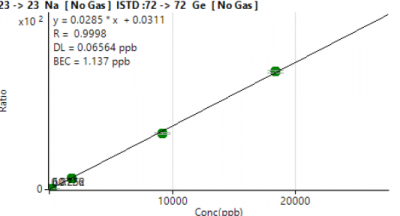
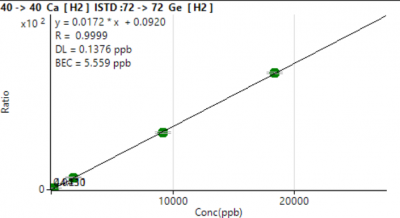
Figure 1 shows a representative calibration curve for Na, illustrating stable, high-sensitivity response over the entire concentration range (0–18,600 µg/L).
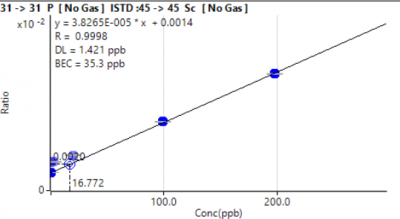
Phosphorus required reprocessing after exclusion of L2–L4 due to curvature in the original data. The corrected fit (Figure 2) still yielded R² ≈ 0.9998, although low-level variability increased relative to other analytes.
Method Detection Limits (MDLs)
LOD values were calculated from the standard deviation of five reagent blanks (LOD = t₀.₉₉,n-1 × σ). MDLs ranged from 0.001–3.4 µg/L (Table 1).
-
Most trace metals (V, Cr, Mn, Fe, Cu, Zn, Sr, Ba, Pb isotopes) exhibited LOD < 0.1 µg/L.
-
Difficult analytes showed higher MDLs:
-
P ≈ 1.22 µg/L
-
K ≈ 3.38 µg/L
-
Se (He mode) ≈ 0.29 µg/L
-
These values indicate that the majority of analytes were well above the method’s minimum quantifiable levels in all water samples.
Instrument Precision and Internal Standard Behavior
Precision Across Calibration and Samples
MassHunter Quant RSDs for calibration levels and unknown samples were generally:
-
<5% for major elements (Na, K, Ca, Sr, Ba)
-
<5–10% for most trace metals
-
Elevated for low-level P, As, and Se, consistent with their higher LODs
This pattern indicates stable short-term instrument precision.
Internal Standard Response and Matrix Effects
A systematic offset in internal standard (Sc, Ge, Rh, In, etc.) recoveries was observed between:
-
Blank + QC1 solutions (2% HNO₃)
-
Student-prepared standards and samples
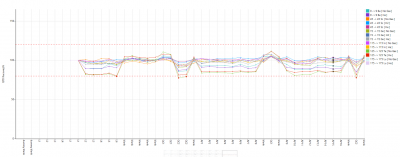
As illustrated in this figure (Figure 3), IS recoveries in student-made solutions deviated from the expected 100% ± 10% band, suggesting a matrix mismatch. Some of the discrepancy in internal standard recoveries between blanks/QC1 and student-prepared solutions may also reflect subtle inconsistencies in sample preparation (e.g., imperfect mixing after acid addition, leading to minor variation in effective acid strength and matrix composition between aliquots). However, the consistent offset across all student-prepared solutions suggests that matrix differences (acid composition and/or total dissolved solids) were the dominant factor.
This discrepancy should be considered when interpreting accuracy.
Analytical Accuracy and QC Recoveries
Accuracy was evaluated using:
-
QC1: NIST 1643f (10×)
-
QC2: L4 Check Standard
Across the run, recoveries typically remained within 95–110% for Na, Ca, Sr, Ba, Mn, Fe, and Zn (Figure 3).
Some analytes (particularly P and Se) showed wider deviations, aligning with their weaker performance at low concentration levels and the matrix differences noted above.
Sample Chemistry
Major Cations in Bottled Water
Major cations (Na, K, Ca) varied widely among the bottled waters (AP1–AP16). Concentrations ranged from:
-
Na: ~3 to ~1800 µg/L
-
K: ~9 to ~545 µg/L
-
Ca: ~22 to ~1900 µg/L
These patterns are shown in Figure 4 (4a,4b,4c), which highlights substantial differences among brands.
Trace Metal Levels Relative to LOD
Trace metals were generally near or moderately above their MDLs:
-
Zn, Sr, Ba, Mn, Fe consistently detected across samples
-
Pb, As, and Se often close to LOD but quantifiable in several cases
Figure 3 displays the ratio of sample concentration to LOD, demonstrating which analytes were robustly detected and which approached method limits.
Summary Table
A complete results table is provided (Table 1,2), reporting:
-
Concentration (µg/L)
-
Uncertainty (mean × RSD)
-
LOD for each analyte
-
Mode used (No Gas, He, H₂)
Values are presented in µg/L (ppb). Corresponding mg/L (ppm) values are provided for comparison with bottled-water labels and drinking-water guidelines.