RESULTS
1. Data Calibration
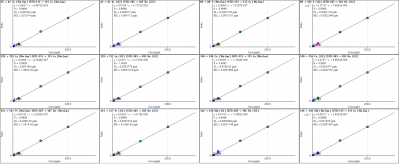
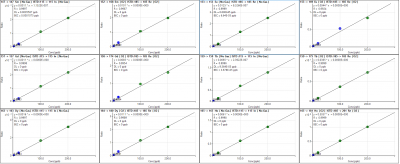
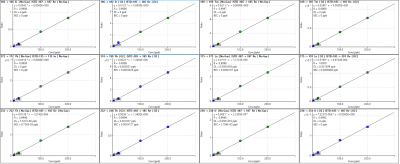
All calibration curves demonstrated excellent linearity across the full working range, with correlation coefficients (R) exceeding 0.999 for nearly all analytes under both no-gas and O₂ reaction-gas modes. The vast majority of rare earth elements showed highly linear responses (R = 0.9997–1.0000), indicating stable ion transmission and consistent detector performance.
A few O₂-mode reaction-product transitions exhibited slightly lower, but still acceptable, correlation coefficients. Specifically, 142 → 158 Nd, 152 → 174 Gd, 153 → 169 Eu, and 164 → 180 Dy produced R values marginally below 0.999. Despite these small deviations, the calibration curves remained linear enough to support accurate quantification, with well-behaved slopes, low detection limits, and negligible background equivalent concentrations.
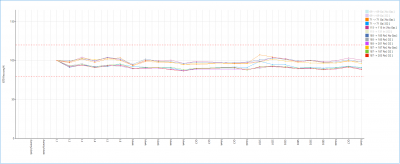
Measurement Stability
2. Final Results
Best data to report

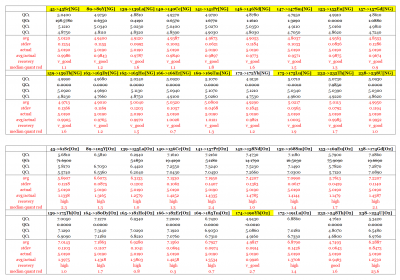
3. Quality Control
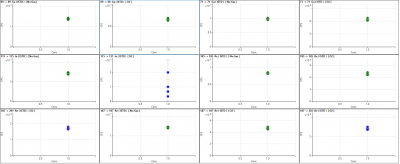
The top set of results represents the No Gas measurements, while the bottom set corresponds to the O₂ Mode measurements. Overall, the QC recoveries under No Gas are very close to 1.0 for most elements, indicating accurate quantification and minimal bias. In general, the No Gas mode provides more consistent performance, with lower variation and recoveries that cluster tightly around the expected values.
In contrast, QC recoveries in O2 mode show greater variability. Several elements exhibit recoveries noticeably much higher than 1.0, reflecting an overestimation that is not observed in the No Gas data. Despite this trend, Yb is an exception – its recovery in O2 mode is comparable to, or slightly better than, its performance in No Gas mode.