METHODOLOGY
1. Sample Collection
A coal fly ash (CFA) sample was collected from the Powder River Basin (Fig. 1), and subsequently shipped to the Aqueous Geochemistry Lab at the Jackson School of Geoscience at the University of Texas at Austin.
The sample was subjected to leaching with 12 M nitric acid. Following leaching, the slurry was transferred to acid-cleaned centrifuge tubes and centrifuged at 8000 rpm for 10 min to separate the solid and liquid phases. The clarified leachate was then decanted into new acid-cleaned tubes and stored for subsequent chemical analysis.

Fig. 1 Map of the Powder River Basin and Adjacent States.
(1) Sample Preparation
Prior to instrumental measurement, each leachate was diluted with 2% v/v HNO₃ (prepared from TraceMetal™ grade nitric acid and 18.2 MΩ·cm DI water) to achieve final dilution factors 100x (S1D1), 500x (S2D1), 1000x (S3D2), 5000x (S4D2), 10000x (S5D2) and 50000x (S6D2),
(2) Calibration Standards Preparation
Calibration standards (L1–L6) were prepared through serial gravimetric dilutions of the CMS-1 stock solution using 2% HNO₃ as the diluent. The L6 solution was first generated at a required dilution factor (DF) of 50 by mixing 0.3047 mL of the CMS-1 stock with 14.7 mL of acid, accounting for solution density to obtain a final volume of approximately 15 mL. Subsequent standards (L5, L4, L3, and L2) were prepared by stepwise diluting L6 at dilution factors of 2, 10, 100, and 400, respectively. Each dilution used gravimetrically measured volumes of stock and acid to ensure accurate DF calculations and to monitor changes in solution density.
The resulting series covered REE concentrations from ~0.0005 ppb in L1 up to ~200 ppb in L6 for the no-gas isotopes, providing a broad and linear calibration range suitable for ICP-MS quantification. Analyte masses were selected based on their native isotopes in no-gas mode (e.g., 45Sc, 89Y, 140Ce), and the same concentration levels were applied consistently across the full REE suite. Standard L1 represents the acid blank, while L2–L6 progressively span low-ppt to high-ppb concentrations, ensuring reliable determination of both low-level and high-level REEs in coal fly-ash leachates.
(3)Internal Standards (ISTDs) Preparation
Gallium (Ga), indium (In), and rhenium (Re) were used as internal standards. Each internal-standard solution was prepared gravimetrically by adding 0.20 mL of the corresponding stock solution to 2% HNO₃ and diluting to a final volume of 500 mL, yielding a final concentration of 0.4 ppm. This preparation yielded dilution factors that closely matched the intended 2500-fold dilution.
(4) Quality Control (QC) Preparation
One QC solution was prepared through a two-stage dilution of the CMS-1 multi-element stock in 2% HNO₃. The first dilution (D1) was prepared to achieve a 2000-fold dilution by adding 0.15 mL of CMS-1 to 14.85 mL of acid, producing a total solution mass of approximately 15 g and an actual dilution factor closely matching the intended value. A second dilution (D2) was prepared by diluting 0.75 mL of the D1 solution to a final volume of 15 mL, corresponding to an additional 20-fold dilution. Together, these dilutions yield an overall 40000-fold dilution of the original CMS-1 stock, establishing the final concentrations 5.02 ppb of Sc, Y, La, Ce, Pr, Nd, Sm, Eu, Gd, Tb, Dy, Ho, Er, Tm, Yb, and Lu in the QC working solution. This final QC mixture provides trace-level concentrations suitable for monitoring instrument stability, accuracy, and drift throughout ICP-MS analyses.
2. ICP-MS Instrument Tuning
Prepared samples were analyzed using an Agilent 8900 triple-quadrupole ICP-MS (ICP-MS/MS) at the Plasma Elemental Analysis Core Lab in the Jackson School of Geosciences, The University of Texas at Austin. Prior to data acquisition, the instrument underwent a full auto-tune sequence to assess plasma stability, ion-transmission efficiency, mass-resolution accuracy, and background levels, ensuring optimal analytical performance. Instrument performance was evaluated under both no-gas mode and oxygen reaction-gas mode, following the manufacturer’s recommended tuning protocol.
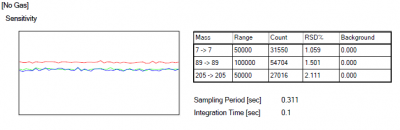
(1) Sensitivity and Background
No-Gas Mode
In no-gas mode, the instrument demonstrated stable and reproducible sensitivity across low-, medium-, and high-mass analytes. Measured count rates were 31,550 cps for ⁷Li, 54,704 cps for ⁸⁹Y, and 27,016 cps for ²⁰⁵Tl, with low relative standard deviations (RSD = 1.06–2.11%), indicating stable nebulization and plasma robustness. Background signals for all monitored masses were reported as 0 cps, reflecting clean ion optics and high vacuum stability.
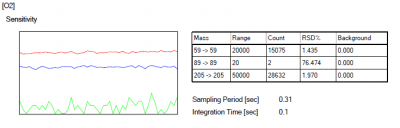
O₂ Mode
In O₂ reaction mode, sensitivity decreased relative to no-gas conditions due to ion-molecule reaction losses and energy discrimination settings. Count rates were 15,075 cps for ⁵⁹Co, 2 cps for ⁸⁹Y, and 28,632 cps for ²⁰⁵Tl. The extremely low signal for ⁸⁹Y is consistent with its high reactivity with O₂ and the tuned OctP Bias/ED parameters, which favor reaction-product formation rather than transmission of the on-mass ion. Background levels remained at 0 cps, indicating minimal cell-derived noise during O₂ operation.
(2) Oxide and Doubly Charged Ratios
No-Gas Mode
Oxide formation, represented by the CeO⁺/Ce⁺ proxy (m/z 156/140), was 1.98%, well within typical tuning thresholds (<3%), indicating efficient plasma dryness and minimized oxygen-based polyatomic formation. The doubly charged ratio (Ba²⁺/Ba⁺ measured using m/z 70/140) was 9.67%, typical for robust plasma conditions and stable ion extraction.
O₂ Mode
In O₂ mode, both oxide and doubly charged ratios increase dramatically, as expected when reactive O₂ gas is introduced into the CRC. Reported values reached 15,490% for CeO⁺/Ce⁺ and 13,237% for Ba²⁺/Ba⁺. These very high apparent ratios reflect the intended high reaction efficiency and strong ion–molecule chemistry, not plasma instability. In O₂ mode, m/z 156 and 70 represent reaction-product pathways, not traditional oxide or doubly charged species, and therefore serve as indicators of cell reactivity rather than plasma cleanliness.
(3) Mass Peak Characteristics (Q1 and Q2)
No-Gas Mode
Mass peak shapes measured in Q1 and Q2 (page 1) showed symmetric profiles with narrow widths:
- Q1 peak widths at 50% height ranged from 0.48–0.55 amu across m/z 7, 89, and 205.
- Q2 peak widths at 50% height ranged from 0.52–0.59 amu.
These values confirm proper quadrupole resolution tuning and adequate mass-filter stability for trace-element quantification. Axis alignment (Q1 Axis Gain ≈ 0.9998) was also optimal.
O₂ Mode
In O₂ mode, mass-peak shape is influenced by ion–molecule collisions, but resolution parameters remain stable. The same mass axis parameters were maintained, and the Q1/Q2 axis gains and offsets matched no-gas settings. Because O₂ mode focuses on reaction-product transmission, peak widths are determined primarily by collision cell dynamics and energy discrimination. The consistent mass-axis settings reflect stable quadrupole performance under reaction conditions.
(4) Plasma Operating Conditions
No-Gas Mode
Plasma settings were identical between no-gas and O₂ modes. The ICP operated at 1550 W RF power, with a 0.70 L/min nebulizer gas flow, 0.50 L/min makeup gas, and 15.0 L/min plasma gas flow. The sample depth was 8.0 mm, and the spray chamber was maintained at 2 °C, supporting reduced oxide formation and stable aerosol transport.
O₂ Mode
Plasma conditions remained unchanged to maintain comparability between modes. The stability of plasma parameters ensures that observed tune differences arise solely from CRC chemistry rather than plasma behavior.
(5) Cell Conditions and Reaction Gas Settings
No-Gas Mode
The collision/reaction cell was operated without gas:
- He flow = 0.0 mL/min
- H₂ flow = 0.0 mL/min
- O₂ off
- OctP Bias = –8.0 V
- Energy Discrimination = +5.0 V
These conditions maximize transmission efficiency while minimizing collisional scattering.
O₂ Mode
O₂ reaction mode enabled gas introduction into the cell:
- O₂ flow (4th gas) = 40%
- He and H₂ flows remain 0
- OctP RF increased to 180 V
- OctP Bias increased to –3.0 V
- Energy Discrimination adjusted to –7.0 V
The higher RF amplitude and modified bias enhance reaction product formation and stabilize ion energies, essential for interference-free REE measurements (e.g., converting REE⁺ → REE·O⁺).
The Q1 Exit, Cell Entrance, Cell Exit, and Q2 Bias voltages were all modified to optimize product-ion focusing.
(6) Hardware and Lens Parameters
No-Gas Mode
Lens voltages (Extract 1/2, Omega Lens, Cell Focus, Q1 Entrance/Exit) were tuned for maximum ion throughput, producing strong sensitivity benchmarks for Li, Y, and Tl. EM settings (analog HV 2175 V, pulse HV 1118 V, discriminator 3.3 mV) confirmed stable detector operation.
O₂ Mode
Small but targeted adjustments were applied to extraction, deflection, and cell-lens voltages to enhance O₂-based reaction efficiencies. Notably:
- Cell Entrance shifted from –40 V to –50 V
- Cell Exit changed from –50 V to –70 V
- Q2 Bias lowered from –3 V to –10 V
These modifications improve focusing of reaction-product ions and suppress on-mass species.
3. ICP-MS Measurements
Rare earth elements (Sc, Y, La, Ce, Pr, Nd, Sm, Eu, Gd, Tb, Dy, Ho, Er, Tm, Yb, and Lu), together with Th and U, were determined using an Agilent 8900 triple-quadrupole ICP-MS at the Jackson School of Geosciences, The University of Texas at Austin. The instrument was tuned to maximize sensitivity across the mass range while maintaining low oxide formation (<1.982%). An octopole reaction system (ORS) was operated in oxygen reaction mode to remove polyatomic interferences where required, and data were reported from the mode (no-gas or O₂) that provided the best combination of low detection limits and acceptable quality-control (QC) performance for each analyte. Calibration curves were highly linear, with correlation coefficients R ≥ 0.999 for most isotopes; the poorest fits, for 142→158 Nd, 152→174 Gd, 153→169 Eu, and 164→180 Dy in O₂ mode, still had R ≈ 0.995–0.999. Internal standards (Ga, In, and Re), introduced continuously via in-line pumping, were used to correct for instrumental drift, and internal-standard signal variations remained well within the QA tolerance of ±50% over each analytical block. Limits of detection, calculated from replicate 2% HNO₃ blanks acquired throughout the run, were typically better than 0.01 ppb, with a median LOD of ~0.004 ppb for the REEs and actinides in their optimal modes.
The ICP-MS analytical sequence began with three dummy blanks to condition the sample-introduction system and establish a stable baseline, followed by six calibration standards (L1–L6) analyzed sequentially. Five procedural blanks were then measured to verify the absence of carryover and ensure baseline stability before quantifying samples. The QC solution (QC1, ~5 ppb REE) was analyzed twice to assess calibration accuracy, followed by an additional blank and a third QC1 measurement to monitor short-term instrument drift. The samples were then analyzed in the order S1D1, S2D1, S3D2, S4D2, S5D2, and S6D2, with a blank and QC1 bracketting sample groups to check for carryover and maintain data quality. A final blank was analyzed at the end of the run to confirm system cleanliness and the absence of memory effects.
QC performance was evaluated using the QC1 replicates. For analytes reported from the no-gas mode, average QC recoveries were very close to unity (median recovery ≈100% and generally within ±2% of the target concentration), and were systematically better than those obtained in O₂ mode, where recoveries tended to be high (typically 25–45% above the target) for most REEs except Yb, which remained close to unity in both modes. Median relative standard deviations for QC1 were low, typically ~0.7–2.7% across the REE suite in both modes, indicating excellent short-term precision. Key ICP-MS operating conditions, including plasma settings, lens voltages, and ORS parameters, are summarized in Table 1.
Table 1. ICP-MS operating conditions and instrument parameters
| ICP-MS Instrument | Agilent 8900 ICP-QQQ-MS | |
| Plasma Conditions | ||
| Nebulizer | MicroMist Nebulizer 0.2mL/min | |
| Nebulizer pump (rps) | 0.10 | |
| Spray Chamber | Scott double-pass (Quartz) | |
| Sampling Depth (mm) | 8.0 | |
| RF power (W) | 1550 | |
| RF Matching (V) | 1.10 | |
| Carrier gas flow (L/min) | 0.70 | |
| Make-up gas flow (L/min) | 0.50 | |
| Cones | Ni | |
| Reaction cell (ORS) modes and masses measured | ||
| O2 mode (4.5mL/min) | 45->61Sc, 89->105Y, 139->155La, 140->156Ce, 141->157Pr, 142->158Nd, 152->168Sm, 153->169Eu, 158->174Gd, 159->175Tb, 164->180Dy, 165->181Ho, 166->182Er, 169->185Tm, 174->190Yb, 175->191Lu, 232->248Th, 238->254U | |
| No gas mode | 45Sc, 89Y, 139La, 140Ce, 141Pr, 146Nd, 147Sm, 153Eu, 157Gd, 159Tb, 163Dy, 165Ho, 166Er, 169Tm, 172Yb, 175Lu, 232Th, 238U | |
| Internal stds | 69Ga (No Gas), 69Ga (O2), 71Ga (No Gas), 71Ga (O2), 115In (No Gas), 115->131In (O2), 185Re (No Gas), 185Re (O2), 185->201Re (O2), 187Re (No Gas), 187Re (O2), 187->203Re (O2) | |
| Detection system | Dual stage (pulse & analog) discrete dynode electron multiplier | |
| Data Acquisition | ||
| Scan mode | Peak hopping | |
| Points across peak | 3 | |
| Integration per mass (sec) | 0.100 | |
| Replicates | 3 |
Table 2: Analyte detection limits and recoveries on quality control (QC) standards
| ORS Mode | Isotope | Calibration (rho) | LOD (ppb) | QC Recovery |
| no gas mode | 45Sc | 0.9996 | 0.0077 | 1.00 |
| 89Y | 0.9999 | 0.0042 | 0.98 | |
| 139La | 0.9999 | 0.0042 | 0.98 | |
| 140Ce | 0.9997 | 0.0042 | 0.98 | |
| 141Pr | 0.9998 | 0.0042 | 0.99 | |
| 146Nd | 0.9998 | 0.0033 | 0.98 | |
| 147Sm | 0.9997 | 0.0033 | 0.96 | |
| 153Eu | 0.9999 | 0.0042 | 0.99 | |
| 157Gd | 0.9998 | 0.0042 | 0.97 | |
| 159Tb | 0.9996 | 0.0042 | 0.99 | |
| 163Dy | 0.9997 | 0.0033 | 0.98 | |
| 165Ho | 0.9998 | 0.0042 | 1.00 | |
| 166Er | 0.9998 | 0.0042 | 1.00 | |
| 169Tm | 0.9997 | 0.0042 | 1.01 | |
| 172Yb | 0.9999 | 0.0033 | 0.98 | |
| 175Lu | 0.9998 | 0.0031 | 1.00 | |
| 232Th | 0.9998 | 0.0116 | 1.00 | |
| 238U | 0.9998 | 0.0042 | 1.00 | |
| O2 Mode | 45Sc | 0.9998 | 0.0095 | 1.13 |
| 89Y | 0.9998 | 0.0033 | 1.32 | |
| 139La | 1.0000 | 0.0017 | 1.26 | |
| 140Ce | 0.9997 | 0.0025 | 1.43 | |
| 141Pr | 0.9999 | 0.0033 | 1.43 | |
| 146Nd | 0.9989 | 0.0025 | 1.48 | |
| 147Sm | 0.9987 | 0.0025 | 1.41 | |
| 153Eu | 0.9924 | 0.0025 | 1.15 | |
| 157Gd | 0.9954 | 0.0025 | 1.44 | |
| 159Tb | 0.9999 | 0.0025 | 1.40 | |
| 163Dy | 0.9989 | 0.0033 | 1.43 | |
| 165Ho | 0.9999 | 0.0033 | 1.38 | |
| 166Er | 0.9990 | 0.0033 | 1.43 | |
| 169Tm | 0.9999 | 0.0025 | 1.35 | |
| 172Yb | 0.9999 | 0.0041 | 0.99 | |
| 175Lu | 1.0000 | 0.0039 | 1.37 | |
| 232Th | 0.9999 | 0.0059 | 0.95 | |
| 238U | 0.9993 | 1.2078 | 1.25 |