Results
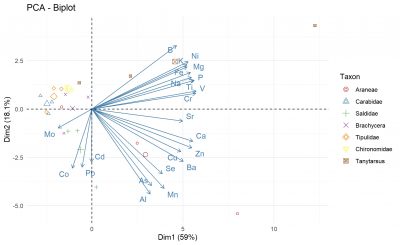
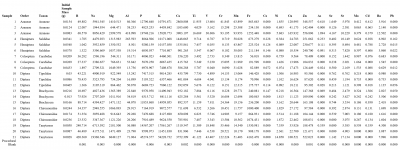
Figure 4. PCA Biplot visualizes individuals’ elemental compositions in two dimensional space according to principal components which explain the most amount of variance compressed into one dimension as possible. Points represent individual samples. An individual’s taxon is indicated by the shape and color of its point. Larger points represent the means for that taxon. Arrows represent vectors indicating the contribution and correlation of analytes.

Figure 5. Concentrations of micronutrients quantified in seven taxa of arctic arthropods. Boxplots filled with the same color represent different taxa in the same order (green = Diptera). Boxes represent the middle 50% of the data, or interquartile range (Q1-Q3), lines within the boxes represent the median, and whiskers represent data no further than 1.5 times the interquartile range.

Figure 6. Concentrations of heavy metals and other potential pollutants quantified in seven taxa of arctic arthropods. Boxplots filled with the same color represent different taxa in the same order (green = Diptera). Boxes represent the middle 50% of the data, or interquartile range (Q1-Q3), lines within the boxes represent the median, and whiskers represent data no further than 1.5 times the interquartile range.
According to one-way ANOVAs run for each analyte comparing concentrations between taxa, concentrations of the following elements vary significantly according to taxon: B, Ca, Cr, Mn, Fe, Co, Ni, Cu, Zn (marginally significant), Sr, Mo, and Cd (Table 4).
Table 4. Significant and marginally significant p-values from one-way ANOVAs run for each analyte. P-values <0.05 indicate that arctic arthropods vary significantly according to their taxon in their concentration of that element.

Table 5. Analyte concentrations in ppm (ug/g) and initial dry sample masses in triplicates of seven arctic arthropod taxa