Results
Header image: Phlogopite, apatite, and amphibole in a thin section from Fei di Doccio. FOV = 2mm
Mineral Compositions
Compositions of pentlandite and phlogopite analyzed in this project are described in Results Table 1. Analysis focused on pentlandite and phlogopite grains that were in association with each other (e.g., intergrowths and/or spatially associated). The full dataset can be viewed at the link below.
Pentlandite
Fei di Doccio. Pentlandite from FDD1 contains 34.4-37.1 wt.% Ni, and 0.66-1.59 ppm Cu, 46.34-60.55 ppm Se, and 0.4-26.6 ppm Te. PGE contents are characterized by 289-368 ppb Ru, 2-14 ppb Rh, 816-2128 ppb Pd, 3-42 ppb Os, 3-9 ppb Ir, and 1-5 ppb Pt. Pentlandite from sample FDD6 contains 33.1-36.9 wt.% Ni and 0.69-3.07 ppm Cu, 39.37-59.06 ppm Se, and 2.2-22 ppm Te. It is noted that spot FDD6-4 contains 8584.5 ppm Cu due to the ablation of a Cu-rich inclusion in the pentlandite. PGE contents from FDD6 are characterized by 222-340 ppb Ru, 11-64 ppb Rh, 179-1485 ppb Pd, 7-30 ppb Os and < 2 ppb Ir. Platinum was below detection limits for every pentlandite analysis in this sample.
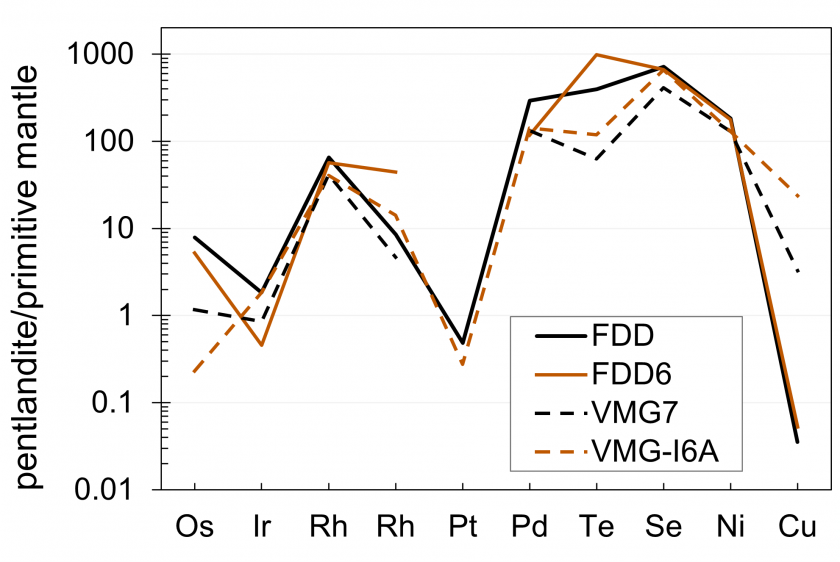
Valmaggia. Pentlandite from VMG7 (pipe core) contains 25.1-25.5 wt.% Ni, and 30.28-193.51 ppm Cu, 30.69-31.42 ppm Se, and 0.34-1.08 ppm Te. PGE contents are characterized by 1126-1227 ppb Ru, 4.2 ppb Rh, 487-574 ppb Pd, 1-5 ppb Os, 2-3 ppb Ir. Only one analysis from this sample contained Rh. Platinum was below detection limits for every pentlandite analysis in this sample. Pentlandite from VMG-I6A (pipe rim) contains 23.0-27.8 wt.% Ni, and 121.96-2516.11 ppm Cu, 44.87-59.42 ppm Se, and 0.5-2.8 ppm Te. PGE contents are characterized by 169-228 ppb Ru, 9-18 ppb Rh, 201-1247 ppb Pd, < 1 ppb Os, 2-10 ppb Ir, and < 2 ppb Pt, with the majority of measurements below detection limits.
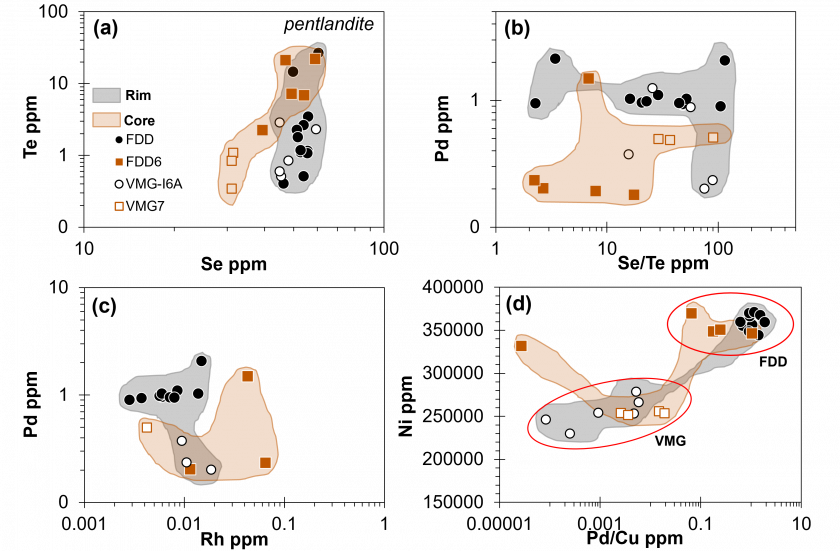
Table 1. Major, minor, and trace element concentrations in pentlandite from Fei di Doccio (FDD) and Valmaggia (VMG). BDL indicates the analysis was below detection limits. Pentlandite grains I6A-3 and I6A-4 were not able to be resolved due to rapid drill-down during laser analysis.
| 29Si | 60Ni | 63Cu | 65Cu | 82Se | 125Te | 99Ru | 101Ru | 103Rh | 105Pd | 189Os | 193Ir | 195Pt | |
| Spot | ppm | ppb | |||||||||||
| FDD-1 | 122.50 | 360345.39 | 0.65 | 0.96 | 55.71 | 1.15 | 636 | 353 | bdl | 922 | 37 | 6 | 1 |
| FDD-2 | 354.53 | 359949.50 | 0.52 | 0.78 | 56.44 | bdl | 555 | 317 | bdl | 817 | 31 | 9 | 6 |
| FDD-3 | 788.20 | 344232.58 | 0.91 | 0.66 | 52.78 | 1.10 | 694 | 328 | 4 | 935 | 22 | 5 | 3 |
| FDD-4 | 120.53 | 358405.24 | 0.90 | 1.00 | 55.93 | 3.47 | 649 | 290 | 14 | 1029 | 30 | 7 | bdl |
| FDD-5 | 292.07 | 355170.21 | 1.54 | 1.31 | 54.07 | 0.51 | 606 | 317 | 3 | 897 | 28 | 6 | bdl |
| FDD-6 | 261.79 | 356514.18 | 0.90 | 0.90 | 53.98 | 2.62 | 673 | 336 | 6 | 960 | 35 | 4 | bdl |
| FDD-7 | 193.21 | 359725.78 | 1.45 | 1.59 | 51.33 | 2.26 | 601 | 331 | 6 | 981 | 38 | 3 | bdl |
| FDD-8 | 154.68 | 366239.56 | 1.09 | 1.16 | 51.65 | 1.78 | 679 | 326 | 9 | 1099 | 34 | bdl | bdl |
| FDD-9 | 269.85 | 369923.00 | 1.15 | 1.11 | 55.57 | 1.07 | 746 | 346 | 6 | 1029 | 22 | bdl | bdl |
| FDD-10 | 251.07 | 348580.48 | 0.92 | 1.04 | 52.78 | 1.18 | 614 | 369 | 7 | 951 | 43 | bdl | bdl |
| FDD-11 | 119.93 | 371044.59 | 0.76 | 0.81 | 60.55 | 26.60 | 710 | 311 | 8 | 945 | 3 | bdl | bdl |
| FDD-12 | bdl | 367384.24 | 1.12 | 1.34 | 46.34 | 0.40 | 713 | 301 | 15 | 2064 | 21 | bdl | bdl |
| FDD-13 | 125.14 | 359319.22 | 1.36 | 1.14 | 49.83 | 14.54 | 718 | 332 | bdl | 2129 | 6 | bdl | bdl |
| FDD6-1 | 211.90 | 348535.36 | 1.02 | 1.09 | 54.25 | 6.85 | 994 | 286 | bdl | 193 | bdl | bdl | bdl |
| FDD6-2 | 723.08 | 369406.30 | 0.69 | 3.07 | 59.06 | 22.02 | 1066 | 259 | 11 | 203 | bdl | bdl | bdl |
| FDD6-3 | 693.10 | 350517.07 | 0.82 | 0.73 | 39.37 | 2.25 | 1041 | 341 | bdl | 180 | 31 | bdl | bdl |
| FDD6-4 | 1475.46 | 331758.13 | 8504.83 | 8589.54 | 47.00 | 21.09 | 913 | 314 | 65 | 233 | 15 | 2 | bdl |
| FDD6-5 | 891.76 | 346129.74 | 1.43 | 1.41 | 49.27 | 7.19 | 718 | 222 | 43 | 1486 | 8 | 1 | bdl |
| vmg7-1 | 178.86 | 253797.33 | 166.84 | 193.51 | 31.42 | 1.08 | 1151 | 206 | 4 | 497 | 6 | 3 | bdl |
| vmg7-2 | 1539.11 | 251449.38 | 136.40 | 136.43 | 31.07 | 0.84 | 1228 | 219 | bdl | 488 | 4 | 3 | bdl |
| vmg7-3 | 165.49 | 255896.26 | 34.47 | 34.50 | 31.08 | 0.34 | 1167 | 193 | bdl | 510 | 1 | 3 | bdl |
| vmg7-4 | 127.63 | 253585.91 | 31.53 | 30.28 | 30.69 | bdl | 1127 | 209 | bdl | 574 | 5 | 2 | bdl |
| i6a-1 | 2871.24 | 266291.56 | 174.11 | 152.39 | 47.99 | 0.85 | 1191 | 192 | bdl | 884 | bdl | 5 | bdl |
| i6a-2 | 9878.07 | 253182.67 | 303.89 | 266.44 | 59.42 | 2.32 | 1384 | 227 | bdl | 1248 | bdl | 11 | bdl |
| i6a-5 | 1060.26 | 230086.98 | 969.76 | 939.49 | 45.45 | 0.51 | 921 | 228 | 11 | 235 | bdl | 2 | bdl |
| i6a-6 | 1799.82 | 246153.37 | 2516.11 | 2424.89 | 44.88 | 0.60 | 1036 | 213 | 19 | 201 | bdl | bdl | 2 |
| i6a-7 | 622.48 | 254159.12 | 436.05 | 409.89 | 44.87 | 2.87 | 963 | 194 | 9 | 375 | 1 | bdl | bdl |
| i6a-8 | 1354.35 | 278630.84 | 121.96 | 74.27 | 52.78 | bdl | 1111 | 170 | bdl | 385 | bdl | bdl | bdl |
Phlogopite
Fei di Doccio. Phlogopite from FDD1 contain 6-12 wt.% Si. Silica contents are anomalously low and diverge from the expected (15-18 wt.% Si) due to the heterogeneity of Fe concentrations within phlogopite. Phlogopite contains 306-777 ppm of Ni and 0.3-1.2 ppm Cu. All of the FDD1 phlogopite grains generally had PGE below detection limits, with some rare, but low-concentration exceptions (Table 2): < 2 ppb Ru, < 2 ppb Rh, < 1 ppb Ir and < 1 ppb Pt. These PGE measurements have high errors (> 40 %) and are not used in the discussion of the data. Phlogopite from FDD6 contain 12.9-14.7 wt.% Si, which is closer to the expected values from previous studies (15-18 wt.% Si). Phlogopite contains 732-781 ppm of Ni and 0.5-1 ppm Cu. Similar to FDD1, all of the FDD6 phlogopite grains generally had PGE below detection limits, with some rare, but low-concentration, exceptions (Table 2): 9 ppb Pd and < 1 ppb Ir. These PGE measurements have high errors (> 40 %) and are not used in the discussion of the data.
Valmaggia. Phlogopite from VMG7 contain 13.4-14.7 wt.% Si. Phlogopite contains 357-374 ppm of Ni and 0.7-0.9 ppm Cu. Phlogopite grains generally had PGE below detection limits, with the exception of 2 ppb Rh. These PGE measurements have high errors (> 50 %) and are not used in the discussion of the data. Phlogopite from VMG-I6A contain 12.4-14.1 wt.% Si, 266-318 ppm Ni and 0.7-1.8 ppm Cu. One phlogopite grain had detectable Te (I6A-Phl-2; 90.8 ppb). PGE contents are generally below detection limits, with the exception of some grains exhibiting < 4 ppb Ru, 4-6 ppb Pd, and <1 ppb Ir (Methodology Table 2).
Table 2. Major, minor, and trace element concentrations in phlogopite from Fei di Doccio (FDD) and Valmaggia (VMG). BDL indicates the analysis was below detection limits.
| 29Si | 60Ni | 63Cu | 65Cu | 82Se | 125Te | 99Ru | 101Ru | 103Rh | 105Pd | 189Os | 193Ir | 195Pt | |
| Spot | ppm | ppb | |||||||||||
| FDD-phl-1 | 116237.91 | 777.59 | 0.11 | 0.48 | bdl | bdl | bdl | bdl | bdl | bdl | bdl | bdl | bdl |
| FDD-phl-2 | 112906.85 | 530.89 | 0.27 | 0.66 | bdl | bdl | bdl | 0.4 | bdl | bdl | bdl | bdl | bdl |
| FDD-phl-3 | 75597.29 | 363.84 | 0.84 | 1.20 | bdl | bdl | bdl | 1.5 | 1.2 | bdl | bdl | 0.2 | bdl |
| FDD-phl-4 | 60701.88 | 374.73 | 0.28 | 0.43 | bdl | bdl | 0.7 | bdl | bdl | bdl | bdl | bdl | 0.1 |
| FDD-phl-5 | 90149.17 | 443.15 | 0.11 | 0.37 | bdl | bdl | bdl | 1.3 | bdl | bdl | bdl | bdl | bdl |
| FDD-phl-6 | 65830.22 | 306.07 | 0.10 | 0.41 | bdl | bdl | bdl | bdl | bdl | bdl | bdl | bdl | bdl |
| FDD6phl-1 | 147154.90 | 736.80 | 0.80 | 1.08 | bdl | bdl | bdl | bdl | bdl | bdl | bdl | bdl | bdl |
| FDD6phl-2 | 134705.85 | 781.33 | 0.23 | 0.50 | bdl | bdl | bdl | bdl | bdl | 9.8 | bdl | bdl | bdl |
| FDD6phl-3 | 140626.77 | 732.08 | 0.37 | 0.64 | bdl | bdl | bdl | bdl | bdl | bdl | bdl | 0.2 | bdl |
| FDD6phl-4 | 129847.17 | 768.40 | 0.33 | 0.55 | bdl | bdl | bdl | bdl | bdl | 9.9 | bdl | bdl | bdl |
| vmg7-phl-1 | 134393.61 | 374.92 | 0.36 | 0.70 | bdl | bdl | bdl | bdl | bdl | bdl | bdl | bdl | bdl |
| vmg7-phl-3 | 134062.73 | 371.22 | 0.39 | 0.74 | bdl | bdl | 1.0 | bdl | bdl | bdl | bdl | bdl | bdl |
| vmg7-phl-4 | 134860.86 | 366.77 | 0.49 | 0.87 | bdl | bdl | bdl | bdl | 2.2 | bdl | bdl | bdl | bdl |
| vmg7-phl-5 | 139075.25 | 360.68 | 0.43 | 0.78 | bdl | bdl | bdl | bdl | bdl | bdl | bdl | bdl | bdl |
| vmg7-phl-6 | 147529.19 | 357.99 | 0.57 | 0.87 | bdl | bdl | bdl | bdl | bdl | bdl | bdl | bdl | bdl |
| vmg7-phl-7 | 139992.73 | 361.99 | 0.47 | 0.82 | bdl | bdl | bdl | bdl | bdl | bdl | bdl | bdl | bdl |
| i6a-phl-1 | 129829.07 | 301.70 | 0.38 | 0.74 | bdl | bdl | bdl | bdl | bdl | 6.5 | bdl | 0.3 | bdl |
| i6a-phl-2 | 140688.64 | 315.68 | 0.50 | 0.92 | bdl | 0.09 | bdl | bdl | bdl | bdl | bdl | bdl | bdl |
| i6a-phl-4 | 130590.63 | 318.39 | 0.83 | 1.16 | bdl | bdl | 1.8 | bdl | bdl | bdl | bdl | bdl | bdl |
| i6a-phl-5 | 129759.98 | 287.64 | 0.36 | 0.84 | bdl | bdl | bdl | bdl | bdl | bdl | bdl | bdl | bdl |
| i6a-phl-6 | 124984.36 | 266.39 | 0.49 | 0.97 | bdl | bdl | bdl | bdl | bdl | 4.9 | bdl | bdl | bdl |
| i6a-phl-7 | 134059.10 | 286.60 | 0.42 | 0.86 | bdl | bdl | 1.9 | bdl | bdl | bdl | bdl | bdl | bdl |
| i6a-phl-8 | 125874.59 | 294.76 | 0.57 | 1.13 | bdl | bdl | bdl | bdl | bdl | bdl | bdl | bdl | bdl |
| i6a-phl-9 | 134979.07 | 313.46 | 1.32 | 1.78 | bdl | bdl | bdl | 3.4 | bdl | bdl | bdl | bdl | bdl |