Methodology
Sample Preparation
Four thin sections, two from the Fei di Doccio locality and two from the Valmaggia locality, were collected and analyzed. Sample ablation spots (pentlandite or phlogopite grains) were identified using petrographic microscopy using a Leica DVM6 in the Department of Earth and Planetary Sciences at The University of Texas at Austin. Large grains of associated pentlandite and phlogopite with few to no visible cracks were marked for analysis.
Samples underwent quantitative mineral major and minor element analysis using a JEOL JXA-8200 electron microprobe equipped with wavelength and energy dispersive spectrometers (EDS and WDS) in the Department of Earth and Planetary Sciences, Washington University, St. Louis, Missouri, USA. The major and minor element chemistry of sulfides was determined with a beam diameter of 3 μm, and accelerating voltage of 15 kV with a beam current of 25 nA. Sulfides were analyzed for As, S, Fe, Pb, Se, Ag, Co, Bi, Sb, Ni, Cu, and Zn. Calibration was performed with a combination of natural and synthetic standard materials. The data was processed using the JEOL and Probe for EMPA (PFE) software.
Table 1. Sample characteristic summary.
| Sample | Lithology | Ore Mineralogy | Ore Modal Abundance | Hypothesized pipe location |
| FDD1 | Am-Ol-Opx-Phl | Po-Pn-Ccp | < 1% | Core (undetermined) |
| FDD6 | Am-Ol-Opx-Phl | Pn-Po-Ccp | 10-15% | Rim (undetermined) |
| VMG7 | Am-Ol-Opx-Phl | Po-Pn-Ccp | < 5% | Core (determined) |
| i6a | Am-Ol-Phl-Opx | Po-Pn-Ccp | < 10% | Rim (determined) |
Standard Selection
Four standards were selected: NIST-612, GSD-1G, STDGL3, and UQAC-Fes-1-2023. These are described in Methodology Table 2. NIST-612 was used for tuning the instrument, and UQAC-Fes-1-2023 was used for data reduction.
Table 2. Descriptions and accompanying data for standards selected. All preferred and published values were queried and pulled from GeoReM (Jochum et al., 2005).
| Standard | Type | Elements | Source |
| NIST-612 | glass | Ag, Al, As, Au, B, Ba, Be, Bi, Ca, Cd, Ce, Cl, Co, Cr, Cs, Cu, Dy, Er, Eu, F, Fe, Ga, Gd, Ge, H, Hf, Ho, In, Ir, K, La, Li, Lu, Mg, Mn, Mo, Na, Nb, Nd, Ni, P, Pb, Pd, Pr, Pt, Rb, Re, Rh, S, Sb, Sc, Se, Si, Sm, Sn, Sr, Ta, Tb, Th, Ti, Tl, Tm, U, V, W, Y, Yb, Zn, Zr | Jochum et al. (2011) |
| GSD-1G | synthetic basalt glass from USGS | Ag, Al, As, Au, B, Ba, Be, Bi, Ca, Cd, Ce, Co, Cr, Cs, Cu, Dy, Er, Eu, Fe, Ga, Gd, Ge, Hf, Ho, In, K, La, Li, Lu, Mg, Mn, Mo, Na, Nb, Nd, Ni, P, Pb, Pr, Pt, Rb, Sb, Sc, Se, Si, Sm, Sn, Sr, Ta, Tb, Th, Ti, Tl, Tm, U, V, W, Y, Yb, Zn, Zr | Guillong et al. (2005) |
| STDGL3 | LiB sulfide glass | Ag, Al, As, Au, Bi, Cd, Co, Cu, Fe, Gd, Ge, Hf, In, Mg, Mn, Mo, Na, Ni, Pb, Pt, Re, S, Sb, Se, Sn, Sr, Ta, Te, Th, Ti, Tl, U, W, Zn | Belousov et al. (2023) |
| UQAC-Fes-1-2023 | sulfide pressed pellet | Ag, As, Au, Ba, Bi, Co, Cr, Cu, Fe, Ga, In, Ir, Mn, Mo, Ni, Os, Pb, Pd, Pt, Re, Rh, Ru, S, Sb, Se, Si, Sn, Te, Ti, V, Zn | Savard et al. (2018) |
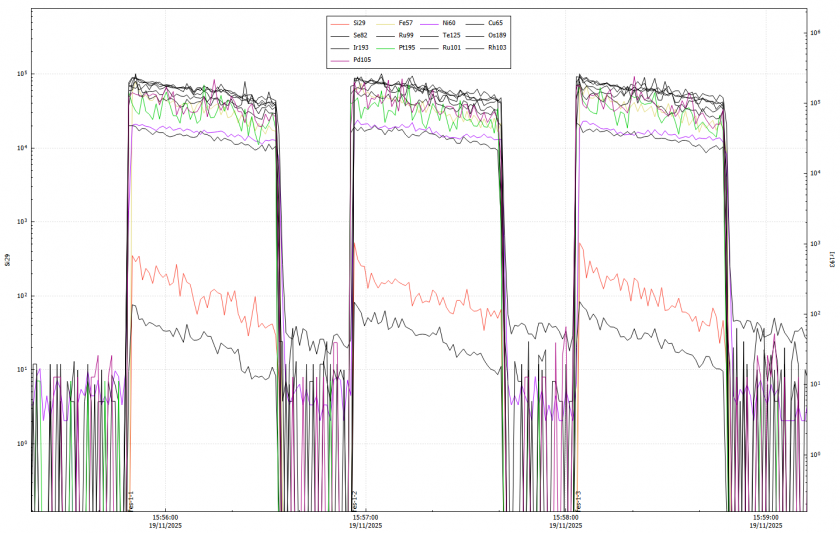
The same analytes were analyzed for both pentlandite and phlogopite: 29Si, 57Fe, 60Ni, 63Cu, 65Cu, 82Se, 99Ru, 101Ru, 103Rh, 105Pd, 125Te, 189Os, 193Ir, 195Pt.
Analytical Method
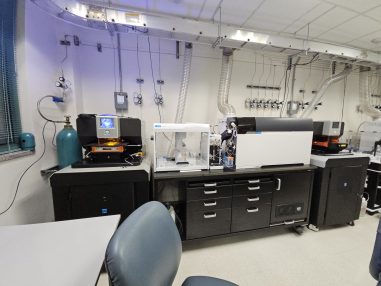
Analysis was conducted using an Agilent 8900 triple quadrupole inductively coupled plasma mass spectrometer (QQQ-ICP-MS) equipped with an ESI NWR193 excimer laser ablation apparatus (193 nm, 4ns pulse width) housed in the Department of Earth and Planetary Sciences at The University of Texas at Austin. Tuning, spot selection, and pre-ablation was completed on November 18, 2025 and a complete analytical run of all four samples was completed on November 19, 2025. Tuning, pre-ablation, and ablation were all done with a flow of 800 ml/min of both Ar and He gasses. All samples and standards fit cleanly into the sample cell and were loaded into the system on November 18. Tuning was performed on the NIST-612 standard for the analytes listed in the above section. Tuning was set at a fluence of 3.8 J/cm2, spot size of 75 µm, and repetition rate of 10 Hz. Major and minor elements (29Si, 57Fe, 60Ni, 63Cu, and 65Cu) were analyzed for a 10ms measurement time, while trace elements (82Se, 99Ru, 101Ru, 103Rh, 105Pd, 125Te, 189Os, and 193Ir, 195Pt) were measured at 20ms. Following initial tuning, spots were then selected for pre-ablation and analysis. Spot selection followed microprobe and microscopic analysis. Representative pentlandite and phlogopite spots were selected for each thin section, and the number of spots selected is summarized in Methodology Table 3. Fewer phlogopite spots were selected due to relatively less availability of large grains. Between spot selection and pre-ablation, several pentlandite spots were selected and ablated to preemptively test the quality of recovery of the method. It was found that a spot size of 60µm with a repetition rate at 15 Hz yielded the best recovery for analytes, especially PGE. All spots were pre-ablated (75µm spot size, rep rate 2 Hz, 2.9 J/cm2 fluence) to remove surface contaminants and thereby improve signal quality. The spot size for pre-ablation was larger than that of the true ablation to maximize the quality of the pre-ablation method itself.
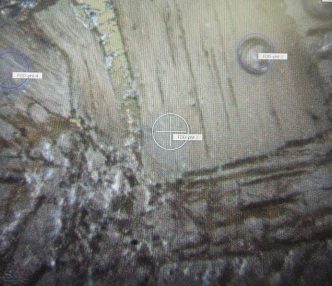
Table 3. Total number of spots selected for mineral phases in each thin section.
| Thin Section | Pentlandite | Phlogopite |
| FDD1 | 13 | 6 |
| FDD6 | 5 | 4 |
| VMG7 | 4 | 6 |
| I-6a | 8 | 9 |
| SUM | 30 | 25 |
The final analytical run including all spots on all thin sections was conducted at a laser fluence of 2.9 J/cm2, 60µm spot size, and repetition rate of 15 Hz with a dwell time of 45 seconds. Baseline intensities were measured before each standard and sample analysis by 20 second gas blanks. The sampling period was 1.0236 seconds, giving 97.69% of time spent measuring. The order of the run including standards and samples is described in Methodology Table 4. Sampling depth was set to 7μm and the laser did burn through several grains. This was expected, as sulfide minerals decompose quickly under the laser. This was accounted for in the data reduction process.
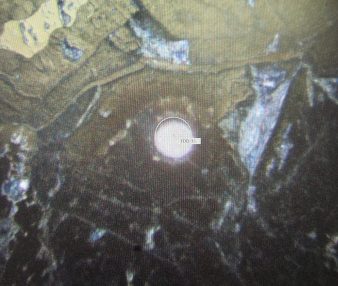
Table 4. Order of standards and samples run for final analysis with associated sequence numbers.
| Sample / Standard | Sequence Number |
| NIST612 | 1 – 3 |
| GSD1G | 4 – 6 |
| UQAC-Fes-1-2023 | 7 – 9 |
| STDGLS3 | 10 – 12 |
| FDD1 – Pentlandite | 13 – 25 |
| FDD1 – Phlogopite | 26 – 31 |
| FDD6 – Pentlandite | 32 – 36 |
| FDD6 – Phlogopite | 37 – 40 |
| VMG7 – Pentlandite | 41 – 44 |
| VMG7 – Phlogopite | 45 – 50 |
| i6a – Pentlandite | 51 – 58 |
| i6a – Phlogopite | 59 – 66 |
| NIST612 | 67 – 69 |
| GSD1G | 70 – 72 |
| UQAC-Fes-1-2023 | 73 – 75 |
| STDGLS3 | 76 – 78 |
Data Quality
Data was reduced and processed using the Iolite software (Paton et al., 2011). After loading both the laser log and complete run data into the software, data were cleaned by selecting time intervals where signal for crystal ablation were differentiated from signal of underlying glass. This was especially important for spots where the laser had completely burned through the pentlandite or phlogopite. Internal standard values for Fe were determined from EMPA analysis. The UQAC-Fes-1-2023 standard was used as the core internal reference standard for data reduction. Percent recovery for the UQAC-Fes standard was calculated to be nearly 100% for all analytes (Methodology Table 5). Percent recoveries varied for the three other standards, especially for PGE (Methodology Table 5).
Table 5. Standards comparing reference values with average recoveries based on analytical run. UQAC-FeS-1 is the most precise of these and was used as the internal standard.
| Standard | Value | 29Si | 60Ni | 63Cu | 65Cu | 82Se | 99Ru | 101Ru | 103Rh | 105Pd | 125Te | 189Os | 193Ir | 195Pt |
| G_NIST-612 | Reference Value | 336061 | 38.8 | 37.8 | 37.8 | 0.91 | 1.05 | 2.51 | ||||||
| Avg Recovery | 235210.73 | 57.43 | 43.14 | 41.63 | 8.33 | 0.06 | 0.06 | 16.40 | 23.28 | 21.41 | 4.68 | 4.32 | ||
| Percent Recovery | 94.58 | 99.02 | 102.72 | 99.11 | 71.94 | |||||||||
| G_GSD1G | Reference Value | 248678 | 58 | 42 | 42 | 2 | 6 | |||||||
| Avg Recovery | 268776.94 | 33.99 | 34.03 | 30.88 | 18.67 | 0.72 | 0.38 | 26.25 | 1.46 | |||||
| Percent Recovery | 79.98 | 87.61 | 90.04 | 81.70 | 79.26 | 36.52 | 58.29 | |||||||
| S_STDGL3 | Reference Value | 242.33 | 348 | 348 | 3843.5 | 0.02 | 0.02 | 0.32 | 10.6 | 1254 | 0.01 | 19.67 | ||
| Avg Recovery | 825.41 | 235.53 | 379.08 | 363.48 | 2554.29 | 0.02 | 0.02 | 0.27 | 0.13 | 961.81 | 0.02 | 14.56 | ||
| Percent Recovery | 97.19 | 108.93 | 104.45 | 66.46 | 97.01 | 98.33 | 85.57 | 1.23 | 76.70 | 236.61 | 74.02 | |||
| S_UQAC-Fes-1-2023 | Reference Value | 25040 | 24950 | 22663 | 22663 | 325 | 67 | 67 | 65 | 48 | 154 | 79 | 58 | 54 |
| Avg Recovery | 25040.57 | 24949.99 | 22663.04 | 22663.03 | 324.99 | 67.00 | 67.00 | 65.00 | 48.00 | 153.99 | 79.00 | 58.00 | 54.00 | |
| Percent Recovery | 100.00 | 100.00 | 100.00 | 100.00 | 100.00 | 100.00 | 100.00 | 100.00 | 100.00 | 100.00 | 100.00 | 100.00 | 100.00 |
Accuracy and precision. Repeated UQAC-FeS-1 analyses for this method show that the method accuracy for analytes is when compared to the published values (Savard et al., 2018) is ≤1% and the analysis had recoveries of 100% for all measured analytes (Methodology Table 6) in the standard. The analysis generally had an external precision (2σ) of ≤6%, however it is noted that two analytes had a higher 2σ, with 189Os and 195Pt having a 2σ of 7.51% and 19.46%, respectively.
Table 6. Detailed accuracy, precision, and LOD analysis for internal standard UQAC-FeS-1. Preferred values from Savard et al. (2018).
| Measured Values | 29Si | 60Ni | 63Cu | 65Cu | 82Se | 99Ru | 101Ru | 103Rh | 105Pd | 125Te | 189Os | 193Ir | 195Pt |
| FeS-1-1 (ppm) | 25215.72 | 24774.15 | 22278.73 | 22119.50 | 316.87 | 66.36 | 66.83 | 66.30 | 48.06 | 151.87 | 76.23 | 57.03 | 53.63 |
| FeS-1-2 | 24711.77 | 25605.54 | 22881.31 | 22963.53 | 329.37 | 67.74 | 67.54 | 64.83 | 47.70 | 157.39 | 80.66 | 58.14 | 53.09 |
| FeS-1-3 | 25207.48 | 24468.28 | 22831.43 | 22914.87 | 329.03 | 66.91 | 66.63 | 63.78 | 48.21 | 152.81 | 80.23 | 58.83 | 55.12 |
| FeS-1-4 | 24868.02 | 25084.96 | 22848.63 | 22765.65 | 323.43 | 67.57 | 67.32 | 68.25 | 49.95 | 152.48 | 78.70 | 60.25 | 63.47 |
| FeS-1-5 | 24280.83 | 24518.22 | 22697.20 | 22642.16 | 320.01 | 65.29 | 65.65 | 63.25 | 46.38 | 152.32 | 75.09 | 55.44 | 48.15 |
| FeS-1-6 | 25959.62 | 25248.81 | 22440.94 | 22572.48 | 331.27 | 68.13 | 68.02 | 63.60 | 47.70 | 157.11 | 83.09 | 58.31 | 50.54 |
| Preferred Values | 25040 | 24950 | 22663 | 22663 | 325 | 67 | 67 | 65 | 48 | 154 | 79 | 58 | 54 |
| Standard Recovery (%) | 100 | 100 | 100 | 100 | 100 | 100 | 100 | 100 | 100 | 100 | 100 | 100 | 100 |
| 2σ (precision %) | 4.54 | 3.56 | 2.19 | 2.70 | 3.57 | 3.13 | 2.47 | 5.96 | 4.82 | 3.30 | 7.51 | 5.63 | 19.46 |
| Deviation (accuracy %) | 0.002287 | -0.000025 | 0.000178 | 0.000144 | -0.000597 | 0.000106 | 0.000056 | 0.000255 | 0.000402 | -0.000642 | 0.000221 | 0.000213 | -0.000026 |
| LOD (ppm average) | 47.2672 |
0.0978 |
0.1927 |
0.2674 |
2.4444 |
0.0041 |
0.0035 |
0.0026 |
0.0067 |
0.0881 |
0.0006 |
0.0006 |
0.0029 |
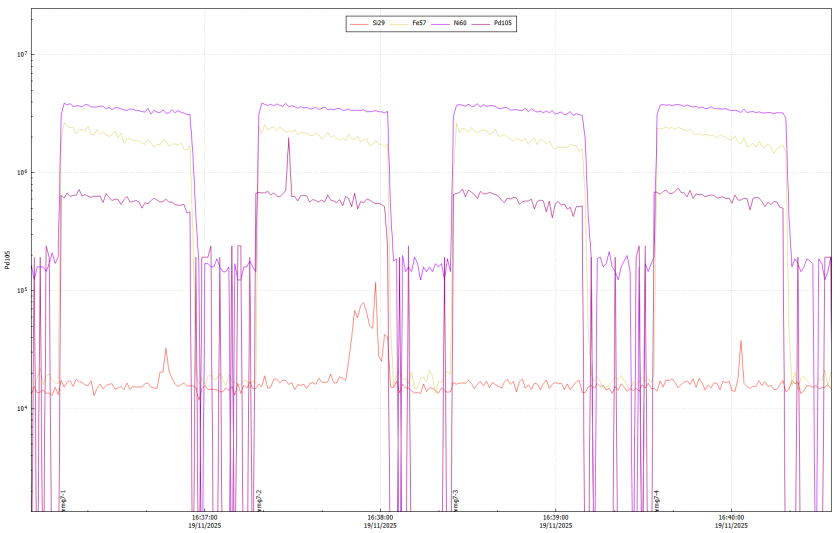
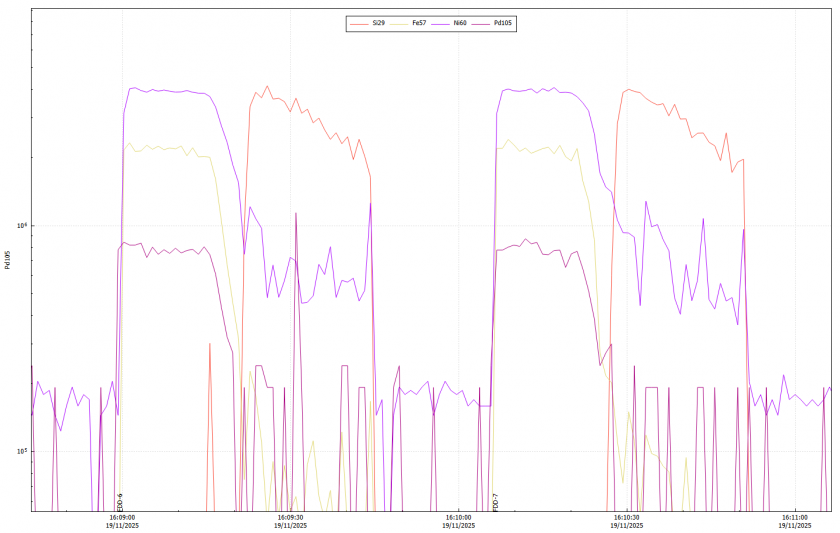
Iolite Data Reduction Examples
Iolite data reduction followed established cleaning and correction protocols. The following figures show representative images from the data reduction process. Importantly, Methodology Fig. 6 shows the differentiation between analysis of target grains versus underlying glass. For all samples where this shift was identified, time resolved windows were corrected to account for only sample data.