Results
Overview
This page presents the final culled solution-mode ICP-MS results for the Monterey Formation shale samples following complete HF microwave digestion. All elements were quantified using optimized modes to minimize argon, chlorine, and oxide-based interferences. Concentrations are reported in grams per tonne (g/t) with associated uncertainties derived from quantitative RSD or standard error outputs.
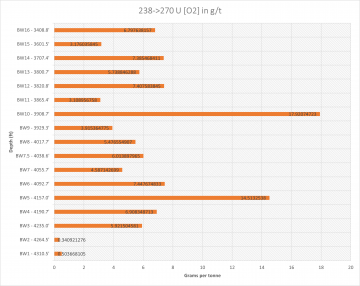
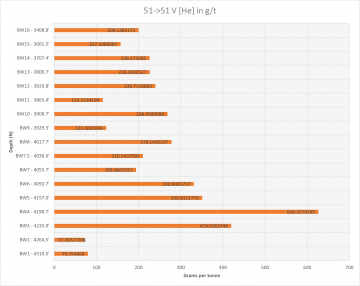
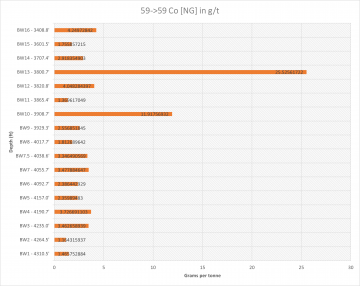
The dataset below presents the selected trace-metal analytes that exhibit consistent, interpretable variation across the BW1–BW16 core interval and the SBC-1 control sample. Vanadium, nickel, cobalt, and molybdenum exhibit clear stratigraphic changes, with several pronounced enrichments in intervals BW3–BW5, BW10, and BW12–BW14, reflecting shifts in redox conditions and authigenic metal accumulation. Lanthanum and overall REE behavior remain stable but display elevated concentrations in BW10–BW14, corresponding to zones with higher clay or organic content. Uranium shows moderate enrichment in a few intervals, consistent with reducing conditions but without extreme anomalies. Overall, the analytes selected for reporting demonstrated clean spectral performance, low interferences, and reliable uncertainties, providing a robust geochemical profile for the core.
| Sample ID | 51V (He) (g/t) | 59Co (NG) (g/t) | 60Ni (NG) (g/t) | 95Mo (NG) (g/t) | 139La (NG) (g/t) | 238→270U (O₂) (g/t) |
|---|---|---|---|---|---|---|
| BW1 | 79.8 ± 1.83 | 1.47 ± 0.0308 | 26.5 ± 0.239 | 4.90 ± 0.147 | 0.641 ± 0.0192 | 0.504 ± 0.0136 |
| BW2 | 72.3 ± 1.88 | 1.16 ± 0.0268 | 34.0 ± 0.170 | 3.76 ± 0.0451 | 0.281 ± 0.00956 | 0.341 ± 0.0150 |
| BW3 | 420 ± 11.7 | 3.46 ± 0.0589 | 93.6 ± 1.87 | 53.9 ± 1.02 | 4.28 ± 0.0599 | 5.92 ± 0.124 |
| BW4 | 626 ± 6.26 | 3.73 ± 0.0596 | 110 ± 2.21 | 77.6 ± 1.24 | 4.71 ± 0.0471 | 6.91 ± 0.187 |
| BW5 | 351 ± 9.82 | 2.36 ± 0.0330 | 98.9 ± 2.27 | 109 ± 1.31 | 4.54 ± 0.0409 | 14.5 ± 0.0581 |
| BW6 | 331 ± 4.30 | 2.39 ± 0.0477 | 65.3 ± 0.719 | 49.5 ± 0.940 | 4.55 ± 0.0546 | 7.45 ± 0.0819 |
| BW7 | 194 ± 2.33 | 3.48 ± 0.0209 | 70.3 ± 2.32 | 12.5 ± 0.400 | 5.21 ± 0.0677 | 4.59 ± 0.0826 |
| BW7.5 | 210 ± 2.94 | 3.35 ± 0.0636 | 72.9 ± 1.38 | 16.1 ± 0.145 | 6.41 ± 0.122 | 6.01 ± 0.283 |
| BW8 | 278 ± 2.50 | 1.81 ± 0.0453 | 41.7 ± 1.29 | 9.36 ± 0.150 | 4.14 ± 0.0952 | 5.48 ± 0.115 |
| BW9 | 123 ± 2.34 | 2.56 ± 0.0537 | 38.1 ± 0.457 | 8.46 ± 0.203 | 5.38 ± 0.108 | 3.92 ± 0.0587 |
| BW10 | 268 ± 6.44 | 11.9 ± 0.0715 | 154 ± 2.61 | 23.0 ± 0.161 | 17.8 ± 0.642 | 17.9 ± 0.358 |
| BW11 | 115 ± 3.45 | 1.37 ± 0.00959 | 29.5 ± 0.207 | 6.07 ± 0.0425 | 3.21 ± 0.0353 | 3.11 ± 0.0124 |
| BW12 | 240 ± 3.84 | 4.05 ± 0.0202 | 59.9 ± 0.180 | 11.6 ± 0.139 | 11.0 ± 0.0220 | 7.41 ± 0.363 |
| BW13 | 227 ± 1.59 | 25.5 ± 0.613 | 82.7 ± 1.57 | 2.36 ± 0.0283 | 33.4 ± 0.668 | 5.74 ± 0.184 |
| BW14 | 226 ± 2.04 | 2.92 ± 0.0292 | 59.2 ± 0.651 | 14.2 ± 0.185 | 6.23 ± 0.00623 | 7.39 ± 0.155 |
| BW15 | 157 ± 7.70 | 1.76 ± 0.0334 | 30.5 ± 0.397 | 7.46 ± 0.127 | 4.27 ± 0.111 | 3.18 ± 0.0191 |
| BW16 | 200 ± 2.20 | 4.25 ± 0.0510 | 53.8 ± 0.860 | 14.9 ± 0.298 | 11.8 ± 0.141 | 6.80 ± 0.163 |
| SBC-1 | 194 ± 2.53 | 2.99 ± 0.0627 | 67.2 ± 1.28 | 10.3 ± 0.195 | 3.64 ± 0.0546 | 2.60 ± 0.0182 |
Summary Plots
Below are summary bar charts highlighting the key analyte trends across the sample suite. These plots visually represent trace-metal variability and support the identification of metal-rich intervals within the Monterey Formation.
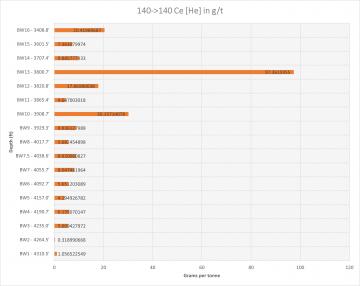
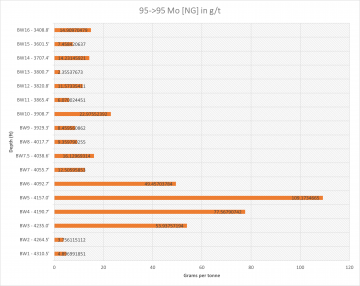
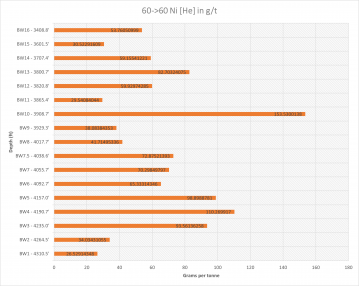
These analytes, V, Ni, Mo, U, Ce (representing REE), and Co, were selected because they provide the clearest, most diagnostic geochemical signals needed to evaluate both depositional redox conditions and critical mineral enrichment in the Monterey Formation. Each of these elements is highly sensitive to environmental conditions (organic-rich deposition) or has direct economic importance (REEs, Co, U). Together, they form a compact yet powerful dataset that directly addresses our overarching project objective: to develop a reliable solution-mode ICP-MS workflow capable of generating accurate trace-metal data to assess the potential of shale-hosted critical minerals and hydrocarbons.
Additionally, these elements performed exceptionally well analytically, displaying stable internal standards, clean mass behavior in He or no-gas mode, and minimal polyatomic interference, making them ideal “representative outputs” for demonstrating the method’s success.
Each plot is formatted using sample names along the x-axis and concentration (g/t) on the y-axis, with error bars showing ± uncertainty.
REE Spider Diagram – Monterey Formation Shale
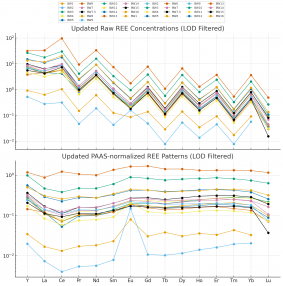
The REE spider chart above shows that the Monterey shale maintains a consistent rare-earth signature across all samples, with light REE enrichment and relatively flat heavy REE patterns that point to a stable sedimentary provenance and minimal geochemical fractionation during deposition. Variations in overall REE magnitude, especially the enriched intervals such as BW10 and BW13, reflect localized increases in REE-hosting minerals rather than changes in source material. Incorporating the updated Eu values from the O₂ mode significantly improved data accuracy by removing artificial anomalies and producing a clearer, more realistic Eu signal, revealing the expected slightly negative to neutral Eu anomalies typical of detrital shale deposits. Together, these updates strengthen the interpretation that the Monterey shale exhibits predictable, upper-crustal REE behavior.
Why PAAS Normalization Is Used
PAAS (Post-Archean Australian Shale) provides a widely accepted geochemical reference representing the average composition of global shale. Normalizing REE concentrations to PAAS removes natural odd-even abundance variations and allows differences in enrichment, depletion, and anomaly behavior to be seen clearly. This makes it easier to interpret depositional conditions, identify unusual geochemical signatures, and compare samples directly regardless of their absolute concentrations.
All Analytes
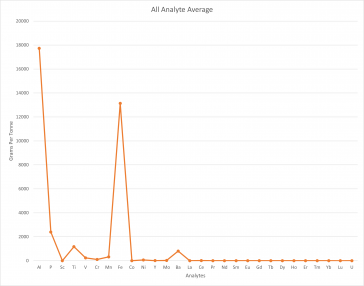
This plot shows the average concentrations (g/t) of all measured trace elements across the Monterey Formation samples. Major elements such as Al and Fe appear at significantly higher concentrations than trace metals, forming two dominant peaks that reflect the aluminosilicate matrix and iron-bearing minerals common in these shales. Most other analytes fall below ~500 g/t, consistent with typical shale background levels. REEs and transition metals appear as low-amplitude signals on this scale, indicating that their overall abundance is minor relative to the bulk elemental composition.
Average REE Analytes
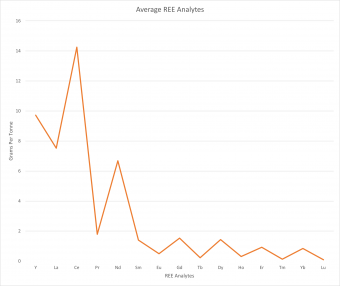
This chart isolates the average concentrations of the rare earth elements plus Y. The REE profile shows a typical shale-like pattern: moderate LREE enrichment (La–Nd), a mid-series decrease through Sm–Gd, and consistently low HREE values (Dy–Lu). Yttrium appears at levels similar to La and Ce, reflecting its geochemical coherence with the REE series. The overall pattern suggests a stable detrital input with limited fractionation, consistent with marine sedimentation in the Monterey Formation.
Heat chart for all REE
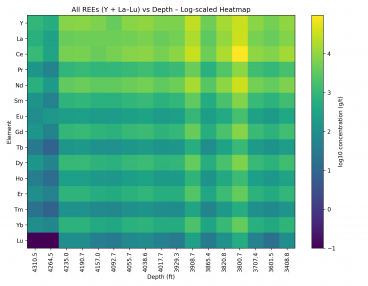
The heatmap shows systematic variation in individual REE concentrations with depth, reflecting changes in depositional conditions rather than random variability. Coherent enrichment across all REEs at specific depths indicates intervals of enhanced pelagic deposition and/or sediment condensation, which promote trace-element concentration. In contrast, muted REE concentrations in other intervals reflect greater hemipelagic input and terrigenous dilution, producing lower overall REE abundances.
Scatter Plot of Average Total REE by Depth
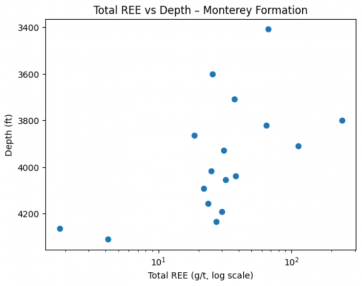
Total rare earth element concentrations (ΣREE) plotted against depth on a logarithmic scale show discrete stratigraphic enrichment intervals within the Monterey Formation, particularly near ~3800–3910 ft, indicating localized geochemical concentration rather than uniform distribution.
When viewed alongside regional pelagic–hemipelagic stratigraphic oscillations, the ΣREE depth profile indicates that rare earth element enrichment in the Monterey Formation is linked to pelagic, high-productivity depositional intervals rather than uniform background sedimentation.
Analytical Quality
| Isotope | Average Recovery (ppb) | ± | Calibration (ρ) | LOD (ppb) | QQQ mode | QC1 | QC2 | QC3 |
|---|---|---|---|---|---|---|---|---|
| ²⁷Al | 1.77E+07 | 4.04E+05 | 1.00 | 0.13 | 27→27Al [NG] | 1.03 | 0.97 | 1.01 |
| ³¹P | 2.40E+06 | 4.22E+04 | 1.00 | 6.48 | 31→31P [NG] | nr | 1.04 | 1.16 |
| ⁶¹Sc | 3.34E+03 | 67.13 | 0.99 | 0.16 | 45→61Sc [O₂] | nr | nr | nr |
| ⁴⁷Ti | 1.17E+06 | 2.49E+04 | 1.00 | 0.12 | 47→47Ti [NG] | nr | 1.00 | 1.04 |
| ⁵¹V | 2.42E+05 | 4.31E+03 | 1.00 | 0.02 | 51→51V [He] | 0.96 | 0.99 | 1.00 |
| ⁵³Cr | 1.07E+05 | 1.62E+03 | 1.00 | 0.05 | 53→53Cr [He] | nr | nr | 1.01 |
| ⁵⁵Mn | 3.26E+05 | 6.54E+03 | 1.00 | 0.04 | 55→55Mn [NG] | 0.96 | 0.99 | 1.00 |
| ⁵⁶Fe | 1.31E+07 | 3.16E+05 | 1.00 | 0.10 | 56→56Fe [H₂] | 0.99 | 1.02 | 1.02 |
| ⁵⁹Co | 4.56E+03 | 74.57 | 1.00 | 0.04 | 59→59Co [NG] | 0.99 | 0.99 | 1.04 |
| ⁶⁰Ni | 6.59E+04 | 1.14E+03 | 1.00 | 0.02 | 60→60Ni [NG] | 0.98 | 0.99 | 1.03 |
| ⁸⁹Y | 9.72E+03 | 155.26 | 1.00 | 0.00 | 89→89Y [He] | nr | nr | 1.09 |
| ⁹⁵Mo | 2.50E+04 | 387.43 | 1.00 | 0.01 | 95→95Mo [NG] | 0.98 | 0.98 | 1.07 |
| ¹³⁷Ba | 8.03E+05 | 1.00E+04 | 1.00 | 0.01 | 137→137Ba [NG] | 4.35 | 0.98 | 1.03 |
| ¹³⁹La | 7.52E+03 | 132.28 | 1.00 | 0.00 | 139→139La [NG] | nr | nr | 1.09 |
| ¹⁴⁰Ce | 1.43E+04 | 149.58 | 1.00 | 0.00 | 140→140Ce [He] | nr | nr | 1.10 |
| ¹⁴¹Pr | 1.79E+03 | 18.46 | 1.00 | 0.00 | 141→141Pr [He] | nr | nr | 1.11 |
| ¹⁴⁶Nd | 6.68E+03 | 95.83 | 1.00 | 0.00 | 146→146Nd [NG] | nr | nr | 1.07 |
| ¹⁶³Sm | 1.40E+03 | 32.42 | 1.00 | 0.00 | 147→163Sm [O₂] | nr | nr | 1.09 |
| ¹⁵³Eu | 379.20 | 10.54 | 1.00 | 0.00 | 153→153Eu [NG] | nr | nr | 1.09 |
| ¹⁷³Gd | 1.53E+03 | 24.92 | 1.00 | 0.00 | 157→173Gd [O₂] | nr | nr | 1.10 |
| ¹⁵⁹Tb | 226.94 | 5.76 | 1.00 | 0.00 | 159→159Tb [NG] | nr | nr | 1.07 |
| ¹⁶³Dy | 1.43E+03 | 33.06 | 1.00 | 0.00 | 163→163Dy [NG] | nr | nr | 1.07 |
| ¹⁶⁵Ho | 308.82 | 4.93 | 1.00 | 0.00 | 165→165Ho [He] | nr | nr | 1.08 |
| ¹⁸²Er | 926.10 | 14.94 | 0.98 | 0.00 | 166→182Er [O₂] | nr | nr | 1.43 |
| ¹⁶⁹Tm | 131.81 | 3.21 | 1.00 | 0.00 | 169→169Tm [He] | nr | nr | 1.08 |
| ¹⁷²Yb | 845.15 | 27.00 | 1.00 | 0.00 | 172→172Yb [NG] | nr | nr | 1.08 |
| ¹⁷⁵Lu | 92.48 | 3.51 | 1.00 | 0.03 | 175→175Lu [NG] | nr | nr | 1.08 |
| ²³⁸U | 6.30E+03 | 134.00 | 1.00 | 0.01 | 238→270U [O₂] | nr | 1.01 | 0.94 |
Analytical Quality Notes
-
All samples passed internal standard performance thresholds.
-
No analytes in this results table displayed drift-related scatter or interference-related overestimation.
-
Mode selection (He, H₂, O₂, or NG) was optimized per isotope to reduce polyatomic and isobaric species.
-
The values shown are culled and validated and represent the highest-confidence data from the run.